725
AN IMAGE DENOISING SCHEME FOR BASKETBALL
VIDEO IMAGE
HONGQIANG LI
Department of Sports Training, Xi’ an Physical Education University, Xi’an, 710068, Shannxi China
ABSTRACT
In recent years, the wavelet-based image denoising techniques mainly focus on the case that uses a single wavelet base. In fact, different wavelet bases can often effectively represents different areas or features of an image. In this paper a new image denoising method using multiple wavelet bases is proposed. First, the noisy image is denoised by various wavelet bases and then a set of the denoised images are obtained. Next, the local character is computed in time domain of every denoised image. The variance, the mean and the gradient are selected to explain the local character of the denoised images. When the character is bigger, the recovery effect of the image is better, the pixel is picked up as a clear pixel to the final denoised image. Third, these multiple denoised images are fused into a final denoised image based on the local character. Experiments show that the simple fusion improves the visual quality of the recovery image.
Keywords: Image Denoising, Bayes Thresholding, Local Character, Multiple Wavelet
1. INTRODUCTION
With the rapid increasing of basketball video data, effective video analysis has become popular in multimedia research. So image processing has becoming one of the most research hotspots in sports video. The quality of the image can seriously affect the result of the analysis. As the pretreatment of image processing, image denoising is the key issue in video analysis.
When the background noises are white Gaussian noises, the classical method is using low passing filter. But this method blurs the image edges and textures while restrains the noise, namely, over-smoothing. Wavelet is effective in image denoising, which is used in non-stationary signal analysis. In an image, many characters such as the edge and texture, are non-stationary component, so the wavelet-based image denoising techniques can retain the detail information while remove the noise.
Wavelet is succeeded in this field due to those causes [1]: (1) low entropy, the ‘large’ wavelet coefficients are sparse and the entropy decreased. (2) multi-resolution, the structure can well describe the non-stationary character such as the edges, the pinnacles, the discontinue point, etc. (3) de-correlated, wavelet can well de-correlate the signal. (4) multi-bases, the wavelet transform can choose
various wavelet bases and dispose different images and different areas of an image.
726 performance but its computation cost is less. And the selection of the wavelet bases is discussed from experiments.
2. THE MODEL OF IMAGE DENOISING
BASED ON WAVELET SHRINKAGE[6]
The noise-corrupted image is obtained by an unknown image X plus the noise
( , ) ( , ) ( , )
0, , 1; 0, , 1
Y i j X i j i j
i M j N
ε
= +
= L − = L −
,
(1)
Where
ε
( , )i j is a zero-mean Gaussian white noiseof varianceσ2, satisfy:
2
{ ( , )} 0,
{ ( , ) ( , )} ( ) ( )
E i j
E i j i j i i j j
ε
ε ε σ δ δ
=
′ ′ = − ′ − ′
(2)
Let W denote an N × M orthogonal or biorthogonal wavelet transform matrix. In the wavelet domain, (1) becomes:
W
W
W
=
=
+
w
Y
X
e
(3) After the decomposition, the energy of the image is compacted into a small number of large wavelet coefficients and lower solution scale coefficients, while the noise is remain equally scattered in all the wavelet coefficients and lower resolution scale coefficients. Thus a reasonable technique called the wavelet-based image denoising is to shrink the small coefficients while retain the large coefficients. The technique is a typical method based on no parameters and has good robustness, simple reputation, less former experimental information. The three important parts in the wavelet-based image denoising are the estimation of noise variance, the estimation of the threshold, and the selection of the threshold function. Then the three problems are as follows.In Decompose the image, the subbands (K is the largest level) are as follows:
( ) ( ) ( )
( , ), ( , ), ( , ), ( , ), 1, 2, ,
k k k
K LH HL HH
c m n w m n w m n w m n
k= L K
(4)
where cK( , )m n represents the low scale coefficient,
HL, LH and HH respectively represent the horizontal detail, vertical detail, diagonal detail of the same level, and the superscript is the decomposition level.
The standard variance of the noise is estimated from the subband HH1 by the robust median
estimator,
(1)
ˆ MAD w( HH( , ) ) / 0.6745m n
σ = (5)
Because there is few signal component in the subband HH1, and large wavelet coefficient is sparse. And the estimation is much robust.
Now we can estimate the threshold and select the thresholding (or shrinkage) function. The soft thresholding function is a double input and single output nonlinear function, as follows:
ˆ( , ) soft_T( ( , ), ( , ))
{ ( , )}( ( , ) ( , )), ( , ) ( , )
0, ( , ) ( , )
w m n w m n λm n
sign w m n w m n λm n w m n λm n
w m n λm n
====
−−−− ≥≥≥≥
====
<<<<
(6) where
w m n w m n
ˆ ( , ), ( , ), ( , )
λ
m n
are respectivelydenote estimated wavelet coefficient , noise wavelet coefficient and threshold. In the shrinking processing we often deal with the detail coefficient and not with the low scale coefficients. To simplify notation, the superscript and the subscript are ignored in the follows.
Except the soft-threshold function, there are hard-threshold function, semisoft-threshold function and empirical-wiener filtering etc. The selection of the threshold is the key part of the wavelet-based image denoising. The universal threshold [7] only depends on the number of subband-coefficient and the noise variance, the SURE threshold [8] depends on the energy of the subband-coefficient and the noise variance. And the local Bayes threshold [9], the spatially adaptive wavelet thresholding have appeared, every time the new method achieves much high performance. The combination of local Bayes threshold and soft thresholding function is one of the most effectively methods based on experiments. The local Bayes threshold is a spatially adaptive wavelet thresholding for image denoising, which is employed by the cluster property of the coefficients, that is to say: the coefficients in wavelet domain are not even, and the large coefficients which are represent the edges and the textures of an image often get together. In the edges we wish to use small threshold to keep the detail character, while in the smooth area, we use large threshold to remove some of the noise and preserve most of the signal due to the little difference between the signal and the noise. That is to say we use the averaged energy in the local area of the wavelet domain to estimate the signal energy. For example, we use the window 7×7, the point
)
,
(
m
n
727
( 3, 3) ( 3, 3)
( , ) ( , )
( 3, 3) ( 3, 3)
w m n w m n
B m n w m n
w m n w m n
L
M M
L
− − − +
− − − +
− − − +
− − − +
====
++++ −−−− ++++ ++++
(7)
The estimated energy including noise of this point is:
∑
∈ × =
) , ( ) , (
2 2
) , ( 7
7 1 ) , ( ˆ
n m B j i w
y mn w i j
σ (8)
the estimated energy of the signal is:
2 2
2
ˆ ) , ( ˆ ) , (
ˆ σ σ
σx mn = y mn − (9)
So according to Bayes rule, the threshold of this point is:
≤ > =
0 ˆ , ) , (
0 ˆ , ˆ ˆ ) , (
2
x x x
n m w n m
σ σ σ
σ λ
(10) Obviously, when the signal is much stranger than the noise, the threshold is chosen to be small in order to preserve most of the signal and remove the some of the noise; vice versa, when the noise dominate and the normalized threshold is chosen to be large to remove the noise which has overwhelmed the signal. In this paper we use local Bayes threshold to all the wavelet bases, and the neighboring field is square field of 7×7.
3. JOINT IMAGE DENOISING METHOD
VIA MULTIPLE WAVELET BASES
Differing from the Fourier transform, the wavelet transform has various wavelet bases. Different wavelet bases can often represent different areas and features of an image due to their different time-frequent character. For example, short support wavelet bases, such as Haar, with better local time character, can effectively represent the suddenly changes of the signal, especially the odd point. While other wavelet bases which have high regularity and high vanishing moment can effectively represent the smooth area of a signal. Most images consist of regions, smoothness, edges and textures. As for the smoothness, the smooth wavelet with high regularity and high vanishing moment can achieve the better effect. That’s to say, the energy is central in some big wavelet coefficients. While for the sharp region, the longer the support of the wavelet base, the stranger the Gibbs-like ringing, and the energy of the signal is scatter on many small wavelet coefficients. It is harm to the image denoising. However the wavelet with short support is not well in the smooth area but in the sharp transition. Traditionally only one single wavelet is used to denoise the image. Often the
wavelet base is high regularity and high vanishing moment. But this method leads to over-smooth phenomena in the edges and textures. The base with high regularity and high vanishing moment can often achieve more signal-to-noise improvement than short support wavelet. That is because the most areas of the image are smooth.
3.1 The Joint Denoising Method based on Local Character and Multiple Wavelets
The traditional method is difficult to benefit from both the smooth area and the sharp area only with one single wavelet. So a joint denoising method via multiple wavelet bases is proposed. Firstly, various wavelet bases are employed to decompose, threshold, and recover the image, then a set of denoised images are obtained. Next, the local character of every pixel in denoised images is computed by the square window. Third, the multi-denoised images are fused into one final image based on local character. The flow chart of the method is as follows:
Input noisy image Y
The multi-denoised images
Compute the character matrix
Decide the weighting factor
Fuse and denoised image I
1
,
2,
,
NI
I
L
I
1
,
2,
,
N,
E
E
L
E
Figure. 1 The Flow Chart Of The Proposed Algorithm
3.2 The Local Character
The denoised images have little noise and better visual quality, the local character in time domain can explicit the effect of the images. The variance, the mean and the gradient are selected to explain the local character of the denoised images. When the character is bigger, the recovery effect of the image is better, the pixel is picked up as a clear pixel to the final denoised image.
728 is
I i j
( , )
, then the character ofI i j
( , )
is computed by the average of the pixel energy inside the window. The formula is as follows:2
1 2 2 2
1
( , ) ( , ) ( , )
1
( , ) ( , ) ( , )
1
( , ) ( , ) ( , ) j k
i k
m i k n j k
j k i k
x y
m i k n j k
j k i k
m i k n j k
V i j I m n I m n
d
G i j G m n G m n
d
M i j I m n I m n
d
+ +
= − = − + +
= − = − + +
= − = −
= −
= +
= −
∑ ∑
∑ ∑
∑ ∑
(11)
Where, d is the pixel number of window (2k+1)×(2k+1) . ( , )I i j is the mean of the pixels in the window:
1
( , ) ( , )
j k i k
m i k n j k
I i j I m n
d
+ +
= − = −
=
∑ ∑
(12)
( , )
x
G m n and G m n are respectively denote y( , ) the first order derivate of horizontal and vertical in pixel ( , )m n .
[image:4.612.319.535.246.409.2]In order to test the denoising results of various characters, some experiments are designed. Two images are selected in basketball video, and changed to gray image. The Gaussian noise with zero mean and 15 variance is added to original image. After the denoising flow of section 3.1, the experimental results are shown in Table 1.
Table 1.The Experimental Results Of Various Characters (ISNR: Db)
The group of wavelet bases
character PSNR
Im1.jpg
Haar+Bior4.4+Sym8 variance 29.02 Haar+Bior4.4+Sym8 mean 29.03 Haar+Bior4.4+Sym8 gradient 29.02
shoot.jpg
Haar+Bior4.4+Sym8 variance 31.08 Haar+Bior4.4+Sym8 mean 31.08 Haar+Bior4.4+Sym8 gradient 31.08
3.3 The Selection of The Wavelet Bases
In an image there are some smoothness and sharp
transition (edge and texture). In the smoothness, we use high regularity and high vanishing moment smooth wavelet system, for example, the least asymmetric wavelet Sym8 (the filter coefficients are 16 and the vanishing moment is 8) and the symmetric wavelet Bior4.4.also named 9/7 wavelet (biorthogonal, the filter coefficients are 9 and 7, the vanishing moment is 4), and the wavelet Db10[10]. All the wavelets can process the different smoothness properties. While in the sharp transition, we use the compact-support wavelet bases such as Haar, Db2, Db3, which are good indealing with discontinue point. In this paper, we use the multiple wavelets in the processing. Instinct, the more different in time-frequent field, the preferable result are achieved.
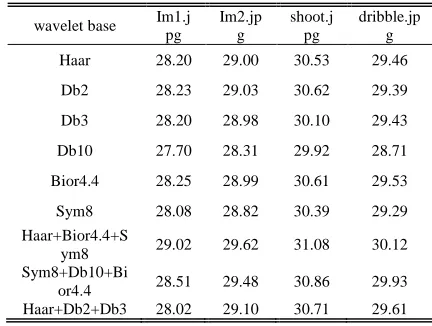
Table 2 presents the results of different sets. From that we can see the first set (Haar+Bior4.4+Sym8) is the best, which include the compact-support wavelet (Haar), the middling-length but good time-frequent wavelet (Bior4.4), and the smooth wavelet (Sym8).
Table 2 The Performance Of Denoised Image σ=15,
(PSNR: Db)
4. THE EXPERIMENTAL RESULTS
The test images are from the basketball video, and changed to gray image. The Gaussian noise with zero mean and 15 variance is added to original image. In the denoising experiment, we apply the three-level decomposition and local Bayes threshold with soft threshold function. The local character is variance and the group of wavelet base is Haar, Bior4.4 and Sym8.
There are some measurement to evaluate the denoised images, such as mean square error (MSE), ratio (SNR), and peak signal-noise-ratio (PSNR). In this paper, PSNR is used. Suppose
( , )
f m n is a clean image,f m nˆ
(
,)
is the denoisedimage,the maximum gray is
max
max{ ( , )}
f
=
f i j
, so, the PSNR of denoised image is defined as follows: (dB)2 max
10 1 1 2
0 0 10 log
ˆ [ ( , ) ( , )]
M N
m n
f M N
PSNR
f m n f m n
− − = =
⋅ ⋅
= ×
−
∑
∑
(11) wavelet base Im1.j
pg
Im2.jp g
shoot.j pg
dribble.jp g
Haar 28.20 29.00 30.53 29.46
Db2 28.23 29.03 30.62 29.39
Db3 28.20 28.98 30.10 29.43
Db10 27.70 28.31 29.92 28.71
Bior4.4 28.25 28.99 30.61 29.53
Sym8 28.08 28.82 30.39 29.29 Haar+Bior4.4+S
ym8 29.02 29.62 31.08 30.12 Sym8+Db10+Bi
[image:4.612.91.297.417.515.2]729 The more PSNR, the better the denoised result is.
From Figure 2, we can see the denoised images have a better visual result.
Figure 2 The Visual Result Of Denoised Image
5. CONLUSION
In this paper, we proposed a simple and effective joint image denoising method via multiple wavelet bases. The method fuses some pieces of images into one by pixel weight. In fact, considering the space localization property, we may first divide the image into smooth area and the edges (texture), then various weighted coefficients is made to various domain or various points. The performance may be improved. In addition, we simply consider two-band wavelet, in fact, all these wavelets are little different in their filter figure except for their vanishing moment. We also select M-band wavelet, multi-wavelet, and the result maybe well than ever.
REFERENCES:
[1] S. G. Mallat, “A theory for multiresolution signal decomposition: the wavelet representation”, IEEE Transactions on Pattern Analysis and Machine Intelligence. Vol. 11, No. 7, 1989, pp. 674-693.
[2] A. Chambolle, R. A. DeVore, N. Lee, and etc., “Nonlinear wavelet image processing: Variational problems, compression, and noise removal through wavelet shrinkage”, IEEE Transctions on Image Processing, Vol. 7, No.3, 1998, pp. 319–335.
[3] S. Grace Chang, Bin Yu and M.Vetterli, “Adaptive wavelet thresholding for image denoising and compression”, IEEE Transactions on Image Processing, Vol.9, No.9, 2000, pp. 1532-1546.
[4] F. Abramovich, T. Sapatinas, and B.W. Silverman, “Wavelet thresholding via a Bayesian approach”, Journal of the Royal Statistical Society Series B-Statistical Methodology, Vol. 1, No. 2, 1998, pp. 725-749. [5] S. Grace Chang, Bin Yu and Martin Vetterli, “Spatially adaptive wavelet thresholding with context modeling for image denoising”, IEEE Transactions on Image Processing, Vol.9, No.9, 2000, pp. 1522-1531.
[6] M. K. Mihcaak, I.Kozintsev, K. Ramchandran, and etc., “Low-complexity image denoising based on statistical modeling of wavelet coefficients”, IEEE Signal Processing Letters, Vol.6, No.12, 1999, pp. 300-303.
[7] D. L. Donoho, “De-noising by soft-thresholding ” , IEEE Transactions on Information Theory, Vol.41, No.3, 1995, pp.613-627.
[8] M.S.Charles, “Estimation of the mean of a multivariate normal distribution”, Annals of Statistics, Vol.9, No.6, 1981, pp.1135-1151. [9] G.M. Shi, F.D. Li, “ Image denoising with
optimized subband threshold”, ICCIMA 2003, 7: 27-30.