2092
REVIEWS ON EDGE-BUNDLING TECHNIQUES FOR
PARALLEL COORDINATES
1N. NADIA S. ‘ASRI, 2ZAINURA IDRUS, 3SITI ZZ ABIDIN, 4H. ZAINUDDIN, 5MT MISHAN
1,2,3Faculty of Computer & Mathematical Sciences, Universiti Teknologi MARA Shah Alam, Malaysia
4Faculty of Applied Sciences. Universiti Teknologi MARA Shah Alam, Malaysia
5Faculty of Computer & Mathematical Sciences, Universiti Teknologi MARA Melaka, Malaysia
E-mail: 1[email protected], 2[email protected], 3[email protected], 4[email protected], 5[email protected]
ABSTRACT
Parallel coordinates are well-known visualization tool for high and multi-dimensional datasets. However, data cluttering and over plotting data are major issues for parallel coordinates and becoming worst in the era of Big Data. Thus, edge-bundling technique has overcome the aforementioned problems by bundling similar edges in parallel coordinates. This paper provides in-depth reviews on six approaches of edge-bundling techniques which are cost-based approach, geometry-based approach, image-based approach, force-directed bundling approach, divided bundling approach and lastly, hierarchical edge-bundling approach. On top of that, these particular approaches are able to reduce the visual clutter without changing the positions of the nodes and only the shapes of edges have some changes. Based on the findings, each approach supports certain features of parallel coordinates such as shape, scale, weight, position, direction and length. This paper suggests a relationship diagram for all these features. The relationship model was proposed in order to improve data visualization by removing data clutter. In summation, edge-bundling techniques are applicable to parallel coordinates in order to visualize multivariate datasets.
Keywords: Parallel Coordinates, Edge-bundling, Data Visualization, Information Visualize, Big Data
1. INTRODUCTION
Recently, information visualization has drawn attention as an important tool in Big Data Analytics (BDA). Big Data with both structured and unstructured data which contains text, image, audio, video and other forms of data are exponentially growing in volume and variety of complexity [1]. These kind of data are collected from numerous datasets. Besides that, information visualization also has been extensively used to scrutinize and analyze data which users can interactively select and minimize the range of view for a prominent information understanding [2]. Furthermore, data visualization which is a graphical display of abstract information enables people to figure out the cardinality of knowledge behind vast data through visual context. During this contemporary days, visual analysis of multidimensional data is vital in various application areas [3] such as mathematics, statistics, climate science, medicine and bioinformatics [4] due to the large and complex
[image:1.612.313.525.571.687.2]datasets. On that account, several convincing techniques have been projected by researchers in order to display, process, filter and interpret the information of the datasets contain. For many generations, parallel coordinates become a popular visualization technique [1, 3, 4, 5, 6] for the multivariate data analysis [4] and transforming multidimensional data into a 2D image [3].
Figure 1: Standard 2D Parallel Coordinates [8]
2093 corresponding value and is useful to analyze high-dimensional datasets [4]. The examples of data visualization and analysis tools which have been integrated with this particular technique are XLSTAT and GGobi [3]. However, researchers perceived quite a few problems or challenges with this traditional parallel coordinate technique. One of the main challenges when using parallel coordinates is occlusion or data clutter, and over plotting due to wide range of datasets which restrict the patterns recognition in the data [5, 6]. The visual clutter caused by load of edges makes it challenging to attain information from the visualization besides affects the inventive representation quality. Moreover, parallel coordinates has no efficiency in expressing time sequence information besides visual complexity which resulted from serious line crossing. It is also complicated to determinate distinct intersection points. Besides that, in parallel coordinates, visual clutter restricts the relationship patterns to be revealed [7]. Hence, several clutter reduction techniques have been proposed for these kind of problems such as sampling, filtering, brushing, clustering and bundling.
This paper will review edge-bundling techniques because they are widely used and have many successful story. In accordance to [8], edge-bundling has recently become a common clutter reduction technique in information visualization research. However, the study in parallel coordinates is very less so there is still room for improvement. Hence, the main aim of this research is to study various edge-bundling techniques and understand their main features to find the feasibility in adopting the techniques into parallel coordinates. The paper initiates with an introduction to parallel coordinates. Section 3 introduces the edge-bundling technique which consists of various approaches such as cost-based approach, geometry-cost-based approach, image-based approach, force-directed edge-bundling approach, divided edge-bundling approach, and hierarchical edge-bundling approach. Section 4 which is method part, discusses step-by-step process of conducting this research. Next, section 5 is analysis part of relationship between features of edge-bundling approaches and parallel coordinates. To sum up, this paper will be concluded in Section 6.
2. PARALLEL COORDINATES
Parallel coordinates plot is a prominent technique for scrutinizing multi-attribute datasets and has been broadly implemented in visualization [9, 10]. Parallel coordinates plot was made widely
popular almost one hundred years later by Alfred Inselberg and Bernard Dimsdale [2, 6] in 1980 even though it was first published in 1885 [6]. Both Inselberg and Dimsdale introduced parallel coordinates by drawing polylines between independent axes at appropriate values. The data that has been probed between the axes includes the data frequencies, data relationship and lastly, data aggregation patterns. Besides that, parallel vertical axes which are linearly scaled within their data range expresses the multivariate data attribute whereas a polygonal line which intersects each axis at its respective attribute data value represents each data item [8].
[image:2.612.313.524.484.599.2]In accordance to [11], parallel coordinates system which has been proposed by Inselberg has parallel axes to represent data attributes using polylines associating the properties of the axis whereas the axis and the intersection points of polylines symbolize the corresponding attribute value. Moreover, the main idea of parallel coordinates system is to use the parallel axes in order to indicate data attributes. As a dimension is represented by each axis in parallel coordinates, the performance of spatial information has been extended. In addition, attributes of records which have been organized in parallel sustain the analysis of relationship between record and attribute set. As for a better and clearer view, Figure 2 illustrates parallel coordinates visualization graph which includes four dimensional data records with five attributes.
Figure 2: Multivariate Data Displayed In Parallel Coordinates [11]
2094 correlations between attributes by recognizing the locations of intersection points. Other than that, data distributions and functional dependencies can be revealed by parallel coordinates. Next, another general advantage of parallel coordinates is its ability to provide a better scope of view of the data. In addition, parallel coordinates also has been outperformed by scatter plots for linear correlation in order to display specific patterns. Another strength of this particular parallel coordinates is for cluster analysis, it performs better compared to the other techniques that have been introduced. Lastly, based on the studies, one advantage of parallel coordinates is the correlations between variables in the dataset can be spotted easily.
[image:3.612.91.300.438.549.2]Although this particular parallel coordinates has been applied for multivariate data visualization since it was introduced, it has its own drawbacks while dealing with large datasets. As stated earlier, the problem is the polylines clutter and crowd each other when the data size grows. Thus, in order to cope with this situation, the parallel coordinates and scatterplot scaling are combined together by scattering points in parallel coordinates [12]. Besides that, re-ordering of parallel axes which allows clutter reduction can be done by a similarity-based method [13]. To sum up, Figure 3 shows a cluttered parallel coordinates plot.
Figure 3: A Cluttered Parallel Coordinates Plot [8]
3. EDGE-BUNDLING TECHNIQUES
Edge-bundling, which is a well-studied technique for minimizing visual clutter in information visualization, has grabbed attention for graph visualization, flow visualization, multidimensional visualization, and other various types of visualization. Besides that, in accordance to [14], edge-bundling has been a familiar subject which can upgrade the comprehensibility of drawing complex graphs that incorporates constitutively similar edges and draws them as bundles. Moreover, the main idea of edge-bundling is to visually merge edges with similar features such as length, direction and position, such that
edge crossings are significantly minimized and increase readability [15].
The basic process of edge-bundling initiates with the deformation of similar edges and group them into bundles. Thus, it gives an abstract and uncluttered display of the original edge-cluttered visualization. Edge-bundling techniques can be classified into six distinct approaches which are cost-based technique, geometry-based technique, image-based technique [16], force-directed bundling approach, divided bundling approach and lastly, hierarchical edge-bundling approach. In the edge-edge-bundling stage of the aforementioned techniques, the positions of the nodes are still the same, only the shapes of the edges have changes. The positions of the nodes hold several meaning semantically such as geographical locations.
Based on the findings, there are several advantages or strengths of edge-bundling techniques. By using this particular technique, people can have more understanding and knowledge over the data right from the overview. When user can have clear insight and more knowledge over the datasets, it indirectly leads to a better understanding of the clusters and the data itself. Besides that, edge-bundling techniques assists the data analysis in a wider scope of context. On top of that, people also can explore precisely when proceeding to the interactions and on-demand details. Generally, by implementing this edge-bundling technique, almost all the graphs’ parameters that will be bundled such as datasets, bundle tension, opacity, bundle threshold, background, coloring and others, can be changed by people.
However, one main problem with the edge-bundling technique is one might be confused with the variety types of datasets. The confusion issue is caused by the cluttered edges in the detail-view. Thus, this will also lead to time complexity issue as people need more time to interpret and analyze the datasets. In summation, these six particular edge-bundling approaches are briefly explained in the next sub-section.
3.1 Cost-based approach
2095 arranged in a circular pattern. This particular edge-bundling technique disfigures the edges linking the nodes placed on the perimeter of a circle and computes the drawing of curved edges by minimizing the use of ink, as an example, total line length [17]. In this approach, there are two assigned control points for each edges which are the meeting point of the sources and the meeting point of the targets. Thus, four main points such that the source node, the meeting point of the sources, the meeting point of the targets and lastly, the target node, control the shape of an edge.
[image:4.612.313.525.233.329.2]As mentioned before, there were no changes in terms of the positions of the source node and the target node, during the bundling stage, whereas the other two control points which are the meeting point of the sources and the meeting point of the targets can be moved freely. In addition, this ink minimization of cost-based edge-bundling technique bundles or forms edges by positioning the control points of similar edges close together which is can be computed by using a numerical method. Besides that, bundles are built by minimizing the total ink used for layered graph layouts [18]. Two or more control points are assigned to each edges and edge are bundled by categorizing the control points of similar edges. Therefore, in order to obtain global ink minimization results, the positions of the control points can be changed. In conclusion, Figure 4 illustrates a bundled circular graph layout and a bundled layered graph layout.
Figure 4: Cost-based Edge-bundling Ink Minimization: (a) Before and (b) After Applied on A Circular Graph Layout: (c) Before and (d) After Applied on A Layered
Graph Layout [8]
[image:4.612.90.292.484.692.2]Besides that, energy minimization also can be applied in cost-based approach. The core aim of this energy minimization is to prevent the line from bending further [8]. This is because parallel coordinates consists of lines in forms of flexible springs and attractive forces are applied between lines. The attractive forces cluster parallel lines together. In summation, enhancement of bundled lines can be made by deviating the color and opacity based on the local line density of the curves.
Figure 5: Main Features of Cost-based Approach
Based on Figure 5, it can be summarized that cost-based approach consists of three main features. The first feature of cost-based approach is all nodes are in circular pattern. Due to this, it causes the shape of the graph to be in a circular structure. Besides that, by using cost-based approach, length of total line can be reduced after disfiguring the edges connecting the nodes. Both edges and nodes are actually the major features of parallel coordinates. Lastly, scale involves in this approach is multi-level agglomerative edge-bundling, as each edge is treated as a vector in 4-dimensional space. In conclusion, this approach improved its readability through color and opacity of local line density of the curves.
3.2 Geometry-based approach
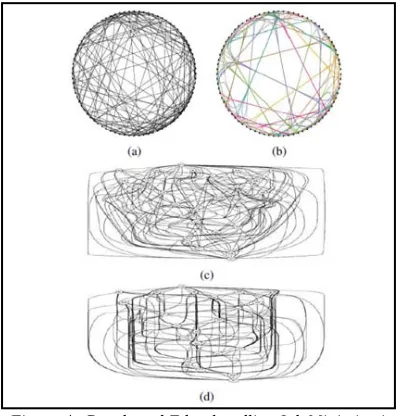
2096 bundling two edges at their common segments in their tree paths, as shown in Figure 6.
Figure 6: Effectiveness of Edge-bundling in Reducing Clutter: (a) Balloon Layout; (b) Radial Layout [8]
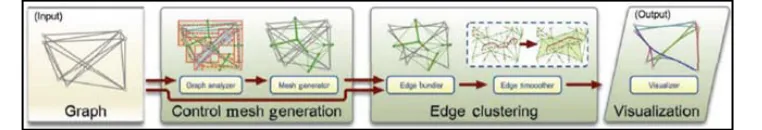
Other than that, various kinds of grids are used in order to aid the edge-bundling process. For instances, triangle meshes which is based on the control mesh generated by Delaunay triangulation [20]. The bundling results can be controlled besides the edges can be consecutively clustered by adjusting the control mesh. The nodes of the original graphs are represented by the vertices of the control mesh whereas the edges of the control mesh are computed by Delaunay triangulation. However, this algorithm which implemented the Delaunay triangulation generates many zigzag edges. Due to this, it is difficult to do tracing of curves and discriminating of endpoints, for large graphs. In conclusion, another mesh generation method has been proposed by [21] in order to address the above-mentioned problem. Figure 7 indicates the framework of this technique.
[image:5.612.90.300.116.239.2]This particular approach of edge-bundling techniques can be summarized into three features which are shape, position of edges, and scale. This approach has a circular or hierarchical structure because the original straight edges have been further curved. Due to this, the original shape of the graph will be changed into new shape, either in circular or hierarchical. Besides that, as for the position of edges, the edges are routed around the bounding boxes with single-flow scale. Thus, as the edges moved and routed around the bounding boxes, it will cause the changes of position of the edges. Figure 8 indicates the summary of features of geometry-based approach.
Figure 8: Main Features of Geometry-based Approach
3.3 Image-based approach
In accordance to [8], image-based edge-bundling approach is applicable to parallel coordinates or graph with edge clusters computed by data clustering method. On top of that, image-based edge-bundling approach is rendered image-based on the given edge clusters. Therefore, these methods can be combined together with other edge-bundling layout approaches. In addition, rendering techniques are used in order to expose interesting patterns in parallel coordinates. Due to this, there are variety of image-enhancement tools that can be used to render the edge-bundling results. Figure 9 shows the distinct rendering results obtained by the image-based edge-bundling approach and the skeleton-based edge-bundling method. This particular skeleton-based edge-bundling method which is the expansion of the image-based edge-bundling [22], accomplish skeletonization together with edge clustering and distance fields in order to build bundled-edge layout. Lastly, individual edges appear as alpha-blended curves as all the edges are iteratively curved and attracted towards the skeleton of the edge clusters.
Figure 9: Rendering Results Generated by: (a) Image-based Edge-bundling; (b) Skeleton-Image-based Edge-bundling
[8]
[image:5.612.313.528.510.618.2] [image:5.612.115.496.654.719.2]2097 Figure 10: Features of Image-based Approach
By referring to Figure 10, image-based approach consists of two main features. First, in terms of shape, users can control the structural look either circular or parallel, depending on the datasets itself. The second feature of image-based approach is the edges running between the similar sets of nodes in opposite direction in order to be in different cluster. This is why it has been derived in terms of direction of this approach. In summation, rendering technique can be used on result of edge-bundling in order to improve its readability.
3.4 Force-directed edge-bundling approach
One of the existing works which has applied force-directed edge-bundling is population migration graph [23]. Figure 11 illustrates the population migration graph which nodes depict migration locations and edges represent population migrated between locations. However, due to a large number of edges in this node-link diagram, it is difficult to trace any patterns of visible high-level migration. Hence, by using force-directed edge-bundling approach, significant clutter reduction in visualizing large graphs can be achieved [23]. In general, this particular force-directed edge-bundling divides the edges into segments. As mentioned before, only position of each subdivision point changes by the combined force during bundling whereas no changes will occur at the positions of the end-points of all edges. During bundling process, each subdivision point of edges works in the directions of the combined force applied on it during each iterative stage. This iterative step will process more than one time till the bundling of the edges completed sufficiently.
Figure 11: Population Migration Graph (a) Origin; (b) directed Edge-bundling; (c) Extended
Force-directed Edge-bundling [22]
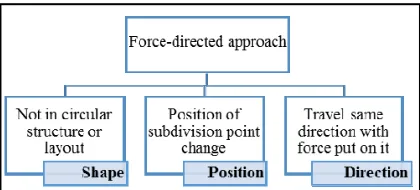
[image:6.612.314.524.501.596.2]This particular approach can be summarized into several main features. The first feature is in terms of shape, such that this approach is not in circular structure or layout. Next, position of endpoints of all edges remain the same whereas the position of subdivision points experiences some changes. This is why position feature has been derived from this force-directed approach. In addition, each subdivision point of edges travel in the same direction of the combined force apply on it. Due to this, direction has been extracts and becomes one of the main feature of the force-directed approach. Figure 12 indicates the features of force-directed edge-bundling approach.
Figure 12: Main Features of Force-directed Approach
3.5 Divided edge-bundling approach
2098 direction, edge weight, or graph connectivity patterns. This caused the high-level directional edge patterns to be implied. Due to this, the researchers came up with a solution by extending the force-directed edge-bundling to the new approach, called divided edge-bundling. This particular divided edge-bundling helps visualizations process as it is easier to analyze and expose both familiar and previously implied patterns. Basically, the edge weights are aggregated in bundles in order to allow more accurate visualization of total bundle weights. Figure 13 indicates the divided edge-bundling which is also an extensions to force-directed edge-bundling.
Figure 13: Force-directed (left), Divided Edge-bundling (right) [8]
After going through this divided edge-bundling approach thoroughly, there are three main features that can be considered. Firstly, this approach is not in circular layout or structure and thus, it has been categorized as shape. Besides that, the weight is related to the importance of an edge on graph. Individual edges that have a weight equal to the sum of the weights in a bundle should behave similarly to that bundle as a whole. Since it must be in parallel direction because edges that work in antiparallel direction cannot be bundled directly on top of each other, it has been grouped as direction of the approach. In conclusion, three main features have been constructed in Figure 14.
Figure 14: Main Features of Divided Edge-bundling Approach
3.6 Hierarchical edge-bundling approach
The next approach for edge-bundling technique is hierarchical edge-bundling. One example of existing works is regarding visualizing the adjacency relations in hierarchical data by using hierarchical edge bundles [25]. This study is basically about bundling the adjacency edges together visually. Each adjacency edge will be bend and modeled as a B-spline curve, toward the polyline which is defined by the path via inclusion edges from one point or node to another one. One advantage of this hierarchical edge-bundling is can reduce visual clutter besides helps in visualizing implicit adjacency edges between parent nodes. Parent nodes is actually the final output of explicit adjacency edges between their respective child nodes. Other than that, hierarchical edge-bundling also has been used in trace visualization [26].
[image:7.612.89.298.266.454.2]2099 Figure 15: Features of Hierarchical Edge-bundling
Approach
3.7 Applications of edge-bundling
Edge-bundling techniques have been
applied and implemented for numerous
applications. For instance, United State migration data which contains of 1790 nodes and 9798 edges applied these edge-bundling techniques [27, 28, 29, 30]. Besides that, edge-bundling technique also has been applied to US airline graphs which consists of 235 nodes and 2101 edges [27, 28, 30]. In accordance to [31, 32], car information datasets also used this proposed edge-bundling algorithms. The car information dataset contains 7 variables besides 392 data items. On top of that, edge-bundling approaches have been adopted by other techniques for data analysis purpose such as one-to-many matched graphs [33] and dynamic networks [34]. In summation, this particular edge-bundling technique also has been used in classificatory distribution in patent portfolios [35], visualization of media analysis results [36] and others.
Table 1 summarized the related works of edge-bundling approaches including cost-based approach, geometry-based approach, image-based approach, hierarchical approach and lastly, force-directed edge-bundling approach. Based on the table, regardless what approaches have been implemented in an application, the position of nodes will always remain the same and only shape of edges experiences some changes. Besides that, from the table we can simply conclude that edge-bundling techniques is applicable to parallel coordinates as each approaches satisfies at least two features of parallel coordinates. As mentioned earlier, the main features of parallel coordinates are axes, nodes or points, lines or edges, and curves.
4. METHOD
This paper involves four steps of method, which starts with choosing six approaches of edge-bundling techniques and ends with derivation of a relationship model of edge-bundling techniques and
[image:8.612.310.524.116.285.2]parallel coordinates. Figure 16 illustrates the four steps of method.
Figure 16: Methodology
i. Choose six approaches of edge-bundling
techniques
Based on the findings, six approaches of edge-bundling techniques have been chosen such as cost-based, geometry-based, image-based, force-directed, divided approach and lastly, hierarchical edge-bundling approach. The approaches have been chosen as they are widely used and have many citation from other studies. All these six approaches will be further discussed in Section 4.
ii. Extract features of parallel coordinates
In this second steps, main features of parallel coordinates have been extracted based on the findings. There are four main features of parallel coordinates which are axes, nodes or points, lines or edges, and curves. Further explanation is in Section 5.
iii. Extract features of each edge-bundling
approaches
After identifying the six approaches of edge-bundling, the process of extracting features of each approach is carried out. Each approach of edge-bundling techniques has their own features. All possible features of each approach such as shape, length, scale, position, direction, and weight have been extracted. The detailed features of the approaches have been discussed in Section 3.
iv. Derive a relationship model of
edge-bundling and parallel coordinates
2100 important in order to find the feasibility in adapting these techniques into parallel coordinates. The relationship model will be explained further in Section 5.
5. ANALYSIS
This section consists of three sub-sections. The first sub-section will discuss about the main features of parallel coordinates. The second section will compare each approach. The last sub-section derives a relationship model based on edge-bundling and parallel coordinate’s features.
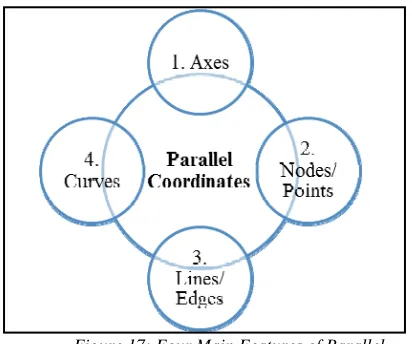
[image:9.612.89.295.275.447.2]5.1 Main features of parallel coordinates
Figure 17: Four Main Features of Parallel Coordinates
Based on Figure 17, it is clearly stated that parallel coordinates consists of four main features which are axes, nodes or points, lines or edges, and lastly, curves. Axes are an essential part in plotting a parallel coordinates [37]. This is because the order of the axes is important for finding features. Besides that, axes rotation is actually a translation in the parallel coordinates. For instance, axis rotation by 180 degrees. Next feature of parallel coordinates is nodes or points. In parallel coordinates domain, points or nodes may represent points, lines, planes or hyperplanes [37]. Besides that, the third features of parallel coordinates which
is lines or edges is the most common visual mapping for parallel coordinates. Lastly, curves as one of the major features of parallel coordinates, is important in order to visualize higher-order and multiple correlations. On the other hand, curves can also facilitate line tracing, and visualize clusters using bundling [37].
5.2 Comparison of edge-bundling approaches
After reviewing and studying all approaches of bundling techniques, edge-bundling techniques are suitable and can be adopted into parallel coordinates. This is due to the common behaviors of approaches that have been reviewed, each of them has certain behavior which is applicable to parallel coordinates. Since there is only a few application in parallel coordinates that implement edge-bundling techniques, so there is still room for improvements. Comparison of each of the edge-bundling approach has been summarized in Table 2. In summation, Table 2 also provides a better view on features of each approach which compatible with parallel coordinates features.
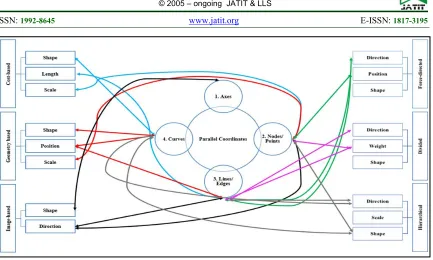
5.3 A relationship model of edge-bundling and
parallel coordinates
2101 6. CONCLUSION
Edge-bundling becomes a cardinal technique for reducing or minimizing data clutter in visualizations. In this paper, we have reviewed parallel coordinates as a well-studied technique for visualization. Besides, edge-bundling techniques with six different approaches are reviewed include cost-based approach, geometry-based approach, image-based approach, force-directed approach, divided edge-bundling approach and lastly, hierarchical edge-bundling approach. Based on the findings, each approaches supports certain features of parallel coordinates, so there is still room for improvement. As for future enhancement, we can hybrid certain approaches in adopting the edge-bundling technique into parallel coordinates. In conclusion, edge-bundling technique is applicable to parallel coordinates.
ACKNOWLEDGEMENT
The authors would like to thank Universiti Teknologi MARA, Malaysia and Ministry of Higher Education Malaysia for the facilities and financial support under the national grant
600-IRMI/FRGS 5/3 (022/2017) ,
FRGS/1/2017/1CT04/UITM/02/2.
REFERENCES:
[1] J. Zhang, M.L. Huang, W.B. Wang, L.F. Lu, and Z. P. Meng, “Big Data Density Analytics Using Parallel Coordinate Visualization”, International Conference on Computational
Science and Engineering, 2014, pp. 1115-1120.
[2] J. Zhang, M.L. Huang, and Z.P. Meng, “Bigdata Visualization: Parallel Coordinates Using Density Approach”, International Conference on Systems and Information
(ICSAI), 2014,pp. 1056-1063.
[3] J. Heinrich, Y. Luo, A.E. Kirkpatrick, H. Zhang, and D. Weiskopf, “Evaluation Of A Bundling Technique For Parallel Coordinates”, September 2011, pp. 1-11.
[4] J. Johansson, and C. Forsell, “Evaluation Of Parallel Coordinates: Overview, Categorization And Guidelines For Future Research”, IEEE Transactions on Visualization and Computer
Graphics, vol. 22, no. 1, January 2016, pp.
579-588.
[5] G. Palmas, M. Bachynskyi, A. Oulasvirta, H.P. Seidel, and T. Weinkauf, “An Edge-Bundling Layout For Interactive Parallel Coordinates”,
IEEE Pacific Visualization Symposium, 2014,
pp. 57-64.
[6] R.C. Roberts, R.S. Laramee, G.A. Smith, P. Brookes, and T. D’Cruze, “Smart Brushing For Parallel Coordinates”, Journal of Latex Class
[image:10.612.94.527.58.318.2]Files, vol. 14, no. 8, August 2015, pp. 1-14.
2102 [7] Z. Idrus, M. Bakri, F. Noordin, A. M. Lokman
and S. Aliman, “Visual Analytics of Happiness Index in Parallel Coordinate Graph”, In Lokman A., Yamanaka T., Levy P., Chen K., Koyama S. (eds) Proceedings of the &th International Conference on Kansei Engineering and Emotion Research 2018. Keer 2018. Advances in Intelligent Systems and
Computing, vol. 739, 2018, pp. 891-898
[8] H. Zhou, P. Xu, X. Yuan, and H. Qu, “ Edge Bundling In Information Visualization”,
Tsinghua Science and Technology, vol.18, no.
2, April 2013, pp.145-156.
[9] H. Nguyen and P. Rosen, “DSPCP: A Data
Scalable Approach For Identifying
Relationships In Parallel Coordinates”, IEEE Transactions on Visualization and Computer
Graphics, vol. 24, no. 3, January 2017, pp.
1301-1315.
[10] Z. Idrus, H. Zainuddin and A. D. M. Ja’afar, “Visual Analytics: Designing Flexible Filtering in Parallel Coordinate Graph”, Journal of
Fundamental and Applied Science, vol. 9, no.
5S, January 2018, pp. 23-32.
[11] Y. Zhonghua and W. Lingda, “3D-Parallel Coordinates: Visualization For Time Varying Multidimensional Data”, 2016, pp. 655-658. [12] X. Yuan, P. Guo, H. Zhou, and H. Qu,
“Scattering Points In Parallel Coordinates”, IEEE Transactions on Visualization and
Computer Graphics, vol. 15, no. 6,
November/December 2009, pp. 1001-1008. [13] L.F. Lu, M.L. Huang, and T.H. Huang, “A
New Axes Re-Ordering Method In Parallel Coordinates Visualization”, In Proc. 2012 11th
International Conference on Machine Learning
and Applications, December 2012, pp.
252-257.
[14] N. Toeda, R. Nakazawa, and T. Itoh, “On Edge Bundling And Node Layout For Mutually Connected Directed Graphs”, International
Conference Information Visualization, 2016,
pp. 94-99.
[15] J. Wu, J. Zeng, F. Zhu, and H. Yu, “MLSEB: Edge Bundling Using Moving Least Squares Approximation”, September 2017, pp. 1-16. [16] T. Yamashita and R. Saga, “Cluster-Based
Edge Bundling Based On A Line Graph”, in
Proceedings of the 12th International Joint
Conference on Computer Vision, Imaging and
Computer Graphics Theory and Applications,
2017, pp. 311-316.
[17] E. R. Gansner and Y. Koren, “Improved
Circular Layouts”, in Proceedings of
International Symposium on Graph Drawing,
Karlsruhe, Germany, 2006, pp. 386-398. [18] S. Pupyrev, L. Nachmanson, and M.
Kaufmann, “Improving Layered Graph Layouts With Edge Bundling”, in Proceedings of International Symposium on Graph
Drawing, Konstanz, Germany, 2010, pp.
329-340.
[19] D. Phan, L. Xiao, R. Yeh, P. Hanrahan, and T.
Winograd, “Flow Map Layout”, in
Proceedings of IEEE Symposium on
Information Visualization, Minneapolis, USA,
2005, pp. 219-224.
[20] H. Qu, H. Zhou, and Y. Wu, “Controllable And Progressive Edge Clustering For Large Networks”, in Proceedings of International
Symposium on Graph Drawing, Karlsruhe,
Germany, 2006, pp. 399-404.
[21] W. Cui, H. Zhou, H. Qu, P. C.Wong, and X. Li, “Geometry-Based Edge Clustering For Graph Visualization”, IEEE Transactions on
Visualization and Computer Graphics, vol. 14,
no. 6, 2008, pp. 1277-1284.
[22] O. Ersoy, C. Hurter, and F. Paulovich, “Skeleton-Based Edge Bundling For Graph
Visualization”, IEEE Transactions on
Visualization and Computer Graphics, vol. 17,
no. 12, November 2011, pp. 2364-2373. [23] D. Zhu, K. Wu, D. Guo, and Y. Chen,
“Parallelized Force-Directed Edge-Bundling On The GPU”, International Symposium on Distributed Computing and Application to
Business, Engineering & Science, 2012, pp.
52-56.
[24] D. Selassie, B. Heller, and J. Heer, “Divided Edge Bundling For Directional Network Data”, IEEE Transactions on Visualization and
Computer Graphics, vol. 17, no. 12, December
2011, pp. 2354-2363.
[25] D. Holten, “Hierarchical Edge Bundles: Visualization Of Adjacency Relations In Hierarchical Data”, IEEE Transactions on
Visualization and Computer Graphics, vol. 12,
no. 5, September/October 2006, pp. 741-748. [26] D. Holten, B. Cornelissen, and J. J. V. Wijk,
“Trace Visualization Using Hierarchical Edge Bundles And Massive Sequence Views”, pp. 47-54.
2103
Computer Graphics Forum, vol. 28, no.
3,2009, pp. 983-990.
[28] W. Cui, H. Zhou, H. Qu, P. C.Wong, and X. Li, “Geometry-Based Edge Clustering For Graph Visualization”, IEEE Transactions on
Visualization and Computer Graphics, vol. 14,
no. 6, November/ December 2008, pp. 1277-1284.
[29] A. Lambert, R. Bourqui, and D. Auber, “Winding Roads: Routing Edges Into Bundles”, Computer Graphics Forum, vol. 29, no. 3, 2010, pp. 853-862.
[30] O. Ersoy, C. Hurter, F. V. Paulovich, G. Cantareira, and A. Telea, “Skeleton-Based Edge Bundling For Graph Visualization”, IEEE Transactions on Visualization and
Computer Graphics, vol. 17, no. 12, 2011, pp.
2364-2373.
[31] H. Zhou, X. Yuan, H. Qu, W. Cui, and B. Chen, “Visual Clustering In Parallel Coordinates”, Computer Graphics Forum, vol. 27, no. 3, 2008, pp. 1047-1054.
[32] K. T. McDonnell and K. Mueller, “Illustrative Parallel Coordinates”, Computer Graphics
Forum, vol. 27, no. 3, 2008, pp. 1031-1038.
[33] E. D. Giacomo, W. Didimo, G. Liotta, and P. Palladino, “Visual Analysis Of One-To-Many
Matched Graphs”, Journal of Graph
Algorithms and Applications, vol. 14, no. 1,
2010, pp. 97-119.
[34] L. Shi, C. Wang, and Z. Wen, “Dynamic Network Visualization In 1.5D”, in Proceedings of IEEE Pacific Visualization
Symposium, Hong Kong, China, 2011,
pp.179-186.
[35] M. Giereth, H. Bosch, and T. Ertl, “A 3D Treemap Approach For Analyzing The Classificatory Distribution In Patent
Portfolios”, in Proceedings of IEEE
Symposium on Visual Analytics Science and
Technology, Columbus, USA, 2008, pp.
189-190.
[36] W. Kienrich and C. Seifert, “An Application Of Edge Bundling Techniques To The Visualization Of Media Analysis Results”, International Conference Information
Visualization, 2010, pp. 375- 380.
[37] J. Heinrich and D. Weiskopf, “State Of The Art Of Parallel Coordinates”, State of the Art
2104
Table 1: Applications of Edge-Bundling Approach
Year/
Author Approach Domain Nodes Edges
Features Parallel
coordinates (Major features) Position of nodes Shape of
edges Axes
Nodes Edges Curves
2008/
[14] Geometry-based edge-bundling
Migration graph among the states in the United States
1790 9798 No
changes changes Has
2008/
[14] Geometry-based edge-bundling
US airlines graph or routes
235 2101 No
changes changes Has
2008/
[17] Cost-based edge-bundling
Car information datasets
7
variables data 392 items
No
changes changes Has
2008/
[17] Hierarchical edge-bundling
Car datasets 7
dimen- sional
392 No
changes changes Has
2009/ [12] Force-directed edge-bundling US migration graph
1715 9780 No
changes
Has changes
2009/
[12] Force-directed edge-bundling
US airlines
graph 235 2101 changes No changes Has
2010/ [15] Geometry-based edge-bundling 2000 Air traffic network
1525 16479 No
changes
Has changes
2010/
[15] Geometry-based edge-bundling
US migration
graph 1715 9780 changes No changes Has
2010/
[26] Force-directed edge-bundling
Media analysis results
- - No
changes changes Has
2011/
[16] Image-based edge-bundling
US migration
graph 1715 9780 changes No changes Has
2011/ [16] Image-based edge-bundling US airlines graph
235 2099 No
changes
Has changes
2011/
2105
Table 2: Comparison of Approaches of Edge-Bundling Techniques
Edge-bundling approach
Strengths Weaknesses
Parallel Coordinates
Common behavior
Axes Nodes Edges Curves
Cost-based edge-bundling
1. Shapes of curved edges can be determined by costs of ink or energy. 2. Can form
bundles for layered graph layout through ink
minimization.
1. Global optimization procedure for layered graph layouts is very time consuming.
No changes in terms of position of nodes
Only shape of edges change
Merge similar edges into bundles.
Can reduce visual
compatibility by adjusting edges.
Bundles the edges within a node-link representation together
Improvement of edge layout.
Geometry-based edge-bundling
1. Can determine the shapes of curved edges by using tree and grids.
2. Able to reduce clutter by bundling two edges at their common segments in tree paths.
1. Generates many zigzag edges (not smooth) 2. Difficult to trace
the curves and the end points 3. Has
computational complexity issues
Image-based
edge-bundling
1. Suitable for parallel coordinates or graphs with edge clusters
2. Consists of many
image-enhancement tools which can be used to render the result of edge-bundling. 3. Rendering
technique in this approach can reveal patterns in parallel
coordinates. 4. Can massively
accelerate
1. If overdrawn edges occur, it cannot be recognized separately and directions of edge are
2107
Table 2: Comparison of Approaches of Edge-Bundling Techniques (cont.)
Edge-bundling approach
Strengths Weaknesses
Parallel Coordinates
Common behavior
Axes Nodes Edges Curves
Force-directed
edge-bundling
1. Suitable for general graphs. 2. Do not need a
hierarchy or a control mesh. 3. Self-organizing
edge-bundling approach (edges are modeled as flexible springs) which attract each other and be grouped as bundles.
1. Has
computational complexity in which the runtime will increase when the number of edges increase to a certain value. 2. Edge direction,
connectivity patterns and edge weight are not important.
No changes in terms of position of nodes
Only shape of edges change
Merge similar edges into bundles.
Can reduce visual
compatibility by adjusting edges.
Bundles the edges within a node-link representation together Improvement of edge layout. Divided
edge-bundling
1. Can aggregate edge weights in bundles to enable more accurate visualization of total bundle weights. 2. Extended
force-directed approach of edge-bundling
1. Allows only one scale as lane width is fixed.
Hierarchical edge-bundling
1. Bundles edges together by bending each edge. 2. Provide a
visualization of relations in an appealing and understandable way
3. Reduce visual clutter
1. Only allow visualization of graph with a hierarchical structure 2. Drawing of
relations is always unexplored or limited in the number of relations displayed in a better view.
![Figure 1: Standard 2D Parallel Coordinates [8]](https://thumb-us.123doks.com/thumbv2/123dok_us/8899966.954490/1.612.313.525.571.687/figure-standard-d-parallel-coordinates.webp)
![Figure 2: Multivariate Data Displayed In Parallel Coordinates [11]](https://thumb-us.123doks.com/thumbv2/123dok_us/8899966.954490/2.612.313.524.484.599/figure-multivariate-data-displayed-in-parallel-coordinates.webp)
![Figure 3: A Cluttered Parallel Coordinates Plot [8]](https://thumb-us.123doks.com/thumbv2/123dok_us/8899966.954490/3.612.91.300.438.549/figure-cluttered-parallel-coordinates-plot.webp)
![Figure 13: Force-directed (left), Divided Edge-bundling (right) [8]](https://thumb-us.123doks.com/thumbv2/123dok_us/8899966.954490/7.612.89.298.266.454/figure-force-directed-left-divided-edge-bundling-right.webp)