Optimized Fuzzy Backpropagation Neural Network
using Genetic Algorithm for Predicting Indonesian
Stock Exchange Composite Index
Anwar Rifa’iDepartment of Computer Science Universitas Budi Luhur
Jakarta, Indonesia [email protected]
Deni Mahdiana Departmentof Computer Science
Universitas Budi Luhur Jakarta, Indonesia [email protected] Abstract—Investment activities in the capital market have
the possibility to generate profits and at the same time also cause losses. The composite stock price index as an indicator used to determine investment continues to change over time. Uncertainty of stock exchange composite index requires investors to be able to make predictions so as to produce maximum profits. The aim of this study is to forecast the composite stock price index. The input variables used are Indonesia interest rates, rupiah exchange rates, Dow Jones index, and world gold prices. All data obtained in the period from January 2008 to March 2019. Data are used to build the Fuzzy Backpropagation Neural Network (FBPNN), model. The weight of FBPNN model was optimized using Genetic Algorithm then used to forecast the composite stock price index. The forecasting result of the composite stock price index for April to June 2019 respectively were 5822.6, 5826.8, and 5767.3 with the MAPE value of 8.42%. These results indicate that Indonesia interest rates, rupiah exchange rate, Dow Jones index, and the gold price are the proper indicators to predict the composite stock price index.
Keywords—fuzzy backpropagation neural network, genetic algorithm, stock exchange composite index
I. INTRODUCTION
Stock markets have a role in developing the country's economy. Investment activities in the capital market have the possibility to generate profits and at the same time also cause losses. In general, a country's stock market can be described by the stock exchange composite index [1]. This situation causes the composite stock price index, which is a blend of indices of various types of stocks on the stock exchange, as an important indicator to determine investment
The composite stock price index continues to change over time. It changes every day due to changes in market prices that occur every day and the presence of additional stock. Changes in the price of the stock in the market occur due to factors in demand and supply. There are various variables that influence demand and supply, which consist of rational and irrational. Although the capital market is a place that can provide big profits for investors, the environment also provides big and uncertain risks.[2].
In fact, changes in the value of the composite stock price index are unique patterns that are difficult to predict. Fuzzy Backpropagation Neural Network (NN) is one of the technics which can be used to forecast the composite stock price index. Neural networks are intelligent machines that can process large and complex information.[3]. In forecasting, neural networks have the ability to understand patterns but are unable to make a decision. To overcome this shortcoming, the neural network is combined with fuzzy logic that has the ability to explain decisions from data. Thus, Neural network and fuzzy
logic can complement each other in the forecasting process. The combination of fuzzy and NN produces a new method called Fuzzy Neural Network. According to Park and Han [4], Fuzzy Neural Network is an NN structure used to manage fuzzy data.
Stoeva and Nikov stated that [5] Backpropagation Neural Network has several advantages, i.e. greater speed of convergence, always converging to targets without oscillation, there is no possibility of falling to a local minimum, and does not require the assumption of a probability distribution and the independence of input data.
Furthermore, to get the minimum forecasting error, the weights generated through FBNN predictions will be optimized using genetic algorithms. The genetic algorithm is often used to optimize and create high-quality solutions even with complex data [6]. This algorithm is an algorithm that is easy to implement and able to provide solutions that can be received quickly.
Many factors affect the stock prices i.e. economy aspects and politics aspect. It is impossible to consider all variables in building a model for market forecasting [7]. In this research, we want to build a forecasting method of composite stock prices index by analyzing historical data of variables i.e. Dow Jones, Nikkei 225, rupiah exchange rate, gold price, and interest rates use Fuzzy backpropagation neural network which is optimized using genetic algorithms.
II. THEORETICAL BACKGROUND
A. Stock Exchange Composite Index
In general, stock markets always describe the economic energy base of a country [2]. This causes the economic attention of a country to always focus on the stock market. One of the easiest ways to observe stock market movements is to monitor the stock market index. The stock market index or composite stock price index is the best indicator to see the performance of stocks in the market [8].
Every day the composite stock price index always changes with an erratic pattern. The uncertainty of the stock exchange price index value requires investors to make predictions to avoid losses. Thus, forecasting the composite stock price index is the latest topic in the world of education and economics. fields [9]. In forecasting the composite stock price index, there are various influential variables. In this study variable considered to influence the composite stock price index including the Nikkei 225 Index, the Dow Jones Index, the interest rate, the world gold price, and the rupiah exchange rate.
B. Fuzzy Back Propagation Neural Network
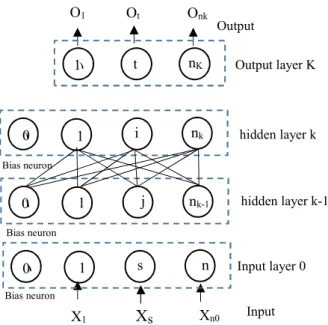
The back propagation algorithm is a training program that is used to determine the weight and minimize errors in the neural network [10]. After getting the output value, the value will be compared with the expected output value. The error obtained is then propagated backward on the network. This process will be repeated until more accurate results are obtained. According to Park and Han [4], the architecture of fuzzy neural networks with K + 1 layers are displayed in figure 1.
Fig. 1. Fuzzified Neural Network Architecture
C. Genetic Algorithm
Genetic algorithms search for a maximum value using the principle of natural selection and natural genetics [11].
Fig. 2. Genetic Algorithm Architecture
Genetic Algorithms begin by determining the values of genes where a collection of genes will form chromosomes, the set of chromosomes will form individuals, and the set of individuals form the initial population. Each individual in the population will be evaluated for their fitness value. Individuals with the best fitness will be saved then individuals in the population will be selected, selected individuals then crossed and mutated to obtain new individuals. New individuals formed are used to form new populations in the next generation. These steps will be repeated until the optimal solution value is obtained or after the nth generation is reached. The step of the genetic algorithm is shown in figure 2.
III. METHOD
The data analyzed in this study is a composite stock price index movement data every month. The entire data covers a period of 12 years i.e. from January 2008 - May 2019 as many as 135 data. The input used in the study is presented in the figure 3.
Fig. 3. Input Data
The Fuzzy Backpropagation Neural Network model used to make predictions is a three-layer perceptron model with a single hidden layer. The input variables used in this model include interest rates, rupiah exchange rates, Dow Jones index, and gold prices. While the output variable is the stock exchange composite index. The steps of building FBPNN model include: determining input, splitting data, fuzzification, determining the best network model, and defuzzification.
After obtaining the weights from the FBNN, then the weights are optimized using genetic algorithms. The steps taken in carrying out genetic algorithms are: coding the gene, generating initial population, evaluation of fitness values, elitism, selection, crossover, mutation, and initialize of new populations.
After the forecasting process is done, the results obtained will be evaluated using MAPE with the formula (1)
=1 | − |× 100% (1) = value of t-observation
= forecasting value at time t = number of observations
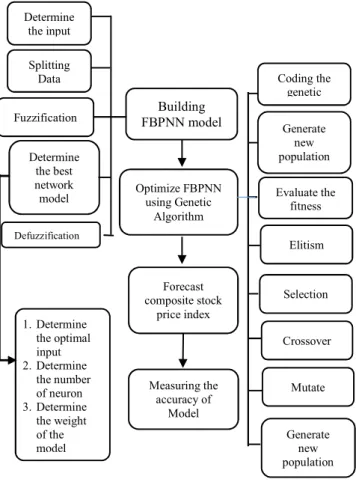
The research design is presented in figures 4. Start
Coding gen
Initial population
Evaluate the fitness
Elitism
Selection Crossover Mutate
Initialise new population nth generation
is gained Evaluate the fitness Solution is individual
with the best fitness
End Yes No ) ) ) ) Output X1
X
s Xn0 Bias neuron Bias neuron Bias neuron O1 Ot Onk Output layer K hidden layer k hidden layer k-1 Input layer 0 Input 0 0 0 1 1 1 1 t i j s n 0 nk-1 nk nK 0.00 10000.00 20000.00 30000.00 1 11 21 31 41 51 61 71 81 91 101 111 121 131 141 SBI (%) Exchange Rate (IDR) IDJ (USD) Gold (USD/troyons) Stock Price (IDR)Fig. 4. Steps of modeling the FBPNN optimized using Genetic Algorithm
IV. RESULT
In this study, the forecasting process of the composite stock price index is divided into two main processes i.e. the formation of the Fuzzy Backpropagation Neural Network model and the optimization process using Genetic Algorithms.
A. Fuzzy Backpropagation Neural Network
The first step to building FBPNN is to determine the input using a PACF plot. The plot of each variable is the composite stock price index, interest rate, exchange rate of rupiah, Nikkei 225 index, Dow Jones index, and the world gold price is significant if there is a line that passes through the confidence interval. Significant lag data on each variable is presented in Table I.
TABLE I. SIGNIFICANT LAG ON EACH VARIABLE
Variable Significant Lag Total
The composite stock
price index lag 1, lag 26 2
Interest rate lag 1, lag 2, lag 3 3
Rupiah exchange rates lag 1 1
Dow Jones Index lag 1, lag 5. 2
Nikkei 225 index lag 1 1
Gold price lag 1, lag 7, lag 12, lag 22 4
Based on the PACF plot generated, the biggest lag is lag 26. From this biggest lag, the target is composite stock price index data on lag 26, namely composite stock price index data
to 27 to 135 data. After determining network input using the PACF plot, the input data is 109 data with 13 input variables. Then the data is divided into two components i.e. training data and testing data. The composition of training data and testing data used was 80% (87 observations) for training data and 20% (22 observations) for testing data.
Fuzzification of data is done using the S growth curve membership function. Then, fuzzification data is used to form the FBPNN model. The model formation is done by determining the number of neurons contained in the hidden layer. This determination is done by experiment and seen the MAPE value produced.
The process of building a backpropagation network that will be used to predict the stock price index value is made using the help of MATLAB with the command:
net=newff(minmax(PF1),[n 1],{ 'logsig' 'logsig' }, 'traingdx');
The newff command is used to build a backpropagation network. In this command, there are n neurons contained in the hidden layer and 1 neuron contained in the output layer. The command {'logsig''logsig'} shows the activation function used. In MATLAB logsig is a binary sigmoid activation function. The training function used in this paper is traingdx.
The results of the FBPNN development process show that the smallest MAPE value occurs when the hidden layer is 10, with 4 inputs i.e. input the interest rate lag 2nd, exchange rate lag 1st, Dow Jones index lag 5th, and gold price lag 1st. The architectural design of the FBPNN model is presented in figure 5.
Fig. 5. FBPNN with 4 input, 10 hidden layers, 1output Architecture
B. Optimization using Genetic Algorithm
The first step taken in the optimization process using genetic algorithms is encoding genes. The gene encoding technique in this study is the coding of real values. Many genes are used according to many of the final weights obtained in the FBPNN model, which are 61 weights. Next is the initial population generation (spanning) using a random generator technique that is combined using a particular value approach. The next step is evaluating fitness values to determine whether or not an individual is fit. Evaluation of fitness value Building FBPNN model Optimize FBPNN using Genetic Algorithm Forecast composite stock price index Measuring the accuracy of Model Coding the genetic Generate new population Evaluate the fitness Elitism Selection Crossover Mutate Generate new population Determine the input Splitting Data Fuzzification Determine the best network model Defuzzification 1. Determine the optimal input 2. Determine the number of neuron 3. Determine the weight of the model X1 X2 X3 X4 Z2 Z1 Interest Rates Exchang e rate Dow Jones index Gold price Composit e Stock Price Index W0 Y1 X0 Z1 W0,1 W1,1 W2,1 W10,,1 V4,,10 V4,,2 V4,,1 V0,,1 V0,,2 V0,,10 V1,,1 V1,,2 V1,,10 V2,,1 V2,,2 V2,, 10 V3,, 10 V3,,2 V3,,1
is based on the smallest MAPE value obtained. Individuals with the best fitness scores will be saved and maintained through the elitism stage. This is done because without the elitism stage, fitness values can be damaged due to crossover and mutation stages.
After the fitness value is maintained, the selection phase begins. The selection technique used in this study was rank-based selection. This technique was chosen to get more diversity and to reduce the possibility of a solution towards optimal locality. The selected parent in the next selection process will pass the crossover stage. The probability of crossover used is 0.8.
After the steps above, next is forming a population in the next generation. Children formed in the previous process will replace their parent positions in the new population in the next generation. Individuals with the highest fitness value in the previous generation will also be maintained in the next generation. After forming a new population, a fitness evaluation process is carried out until the mutation.
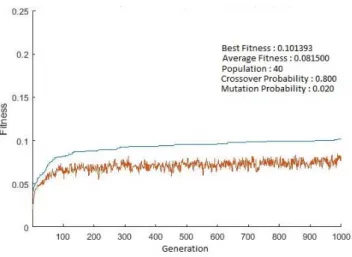
Based on several experiments conducted population size used in this study is 40, the number of generations is 1000 with a fitness value of 0.1013. The optimization of FBPNN using genetic algorithms chart can be seen in figure 6.
Fig. 6. Optimization of FBPNN using genetic algorithms
C. Prediction of Composite Stock Price Index
After obtaining the final weight through FBPNN which is optimized using genetic algorithms then the forecasting process of the composite stock price index is then carried out. The predicted composite stock price index is in the period of April 2019 to June 2019. The input variables used to make predictions are shown in Table II.
TABLE II. INPUT VARIABLES
Month
Input variable
SBI Exchange
rate IDJ Price Gold
April 10 14250 26592.91 1285.70
May 10 14275 24815.04 1305.80
June 10 14127.5 26599.96 1395.15
Composite stock price index forecasting results using FBPNN and forecasting using FBPNN optimized with genetic algorithm is shown in Table III.
TABLE III. COMPOSITE STOCK PRICE INDEX FORECASTING
Model April 2019 2019 May June2019 MAPE
Composite Stock
Price Index real 6455.35 6209.12 6358.63
FBPNN 5652.9 5658.5 5758.9 10.24%
FBPNN Optimized using Genetic Algorithm
5822.6 5826.8 5767.3 8.42%
Table III shows that there are differences in the MAPE value of 1.82% between the results of predictions using FBPNN and FBPNN which have been optimized using genetic algorithms. This means that the optimization of the FBPNN model using genetic algorithms is able to provide better forecasting than forecasting using only FBNN.
V. CONCLUSION
The optimization process using genetic algorithms on the results of fuzzy backpropagation neural network weights increases the precision of BPNN forecasting and overcome limitations of ordinary BPNN. The results of the prediction of the composite stock price index will help investors in managing their investment strategies. This promises greater profits by minimizing the risks that investors need to take.
The model in this study is applied to composite stock price index data for the period of January 2008 to March 2019. The input variables used are interest rates, rupiah exchange rates, Dow Jones index, and gold prices. The best network structure used in this study is four input variables, ten hidden layers, and one output. This study uses binary sigmoid activation function, traingdx learning algorithm, and S-curve fuzzy membership function. In the optimization phase, the type of rank-based selection is applied to obtain optimal prediction results. Genetic algorithm optimization is done with a probability of crossover 0.8, a probability of mutation 0.02, and a rank-based selection technique.
The results showed that the Fuzzy back propagation neural network optimized using genetic algorithms had successfully predicted the composite stock price index with a MAPE value of 8.42%. The prediction value of the composite stock price index in the April 2019 period until June 2019 is 5822.6, 5826.8, and 5767.3 respectively.
REFERENCES
[1] J. Gupta and A. Chevalier, “The causality between interest rate, exchange rate and stock price in emerging markets: the case of the Jakarta stock exchange,” Fuzzy Sets Manag. Econ. Mark., pp. 145–163, 1997.
[2] Y. S. Chen and C. H. Cheng, “Forecasting PGR of the financial industry using a rough sets classifier based on attribute-granularity,” Knowl. Inf. Syst., vol. 25, no. 1, pp. 57–79, 2010.
[3] L. R. Weatherford, T. W. Gentry, and B. Wilamowski, “Neural network forecasting for airlines: A comparative analysis,” J. Revenue Pricing Manag., vol. 1, no. 4, pp. 319–331, 2003.
[4] S. Park and T. Han, “Iterative inversion of fuzzified neural networks,” IEEE Trans. Fuzzy Syst., vol. 8, no. 3, pp. 266–
280, 2000.
[5] A. Nikov and S. Stoeva, “A fuzzy backpropagation algorithm Stefka,” Fuzzy Set Syst., vol. 14, no. 2, pp. 231– 244, 2001.
[6] X.-L. Luo, J. Feng, and H.-H. Zhang, “A genetic algorithm for astroparticle physics studies,” Comput. Phys. Commun., pp. 1–7, Jun. 2019.
[7] H. Hwang and J. Oh, “Fuzzy models for predicting time series stock price index,” Int. J. Control. Autom. Syst., vol. 8, no. 3, pp. 702–706, 2010.
[8] A. Alamsyah and A. N. Zahir, “Artificial Neural Network for Predicting Indonesia Stock Exchange Composite Using Macroeconomic Variables,” 2018 6th Int. Conf. Inf. Commun. Technol., vol. 0, no. c, pp. 44–48, 2018.
[9] Y. Liu, Y. Chen, S. Wu, G. Peng, and B. Lv, “Composite leading search index: a preprocessing method of internet search data for stock trends prediction,” Ann. Oper. Res., vol. 234, no. 1, pp. 77–94, 2015.
[10] N. Borisagar, D. Barad, and P. Raval, “Proceedings of International Conference on Communication and Networks,” in Chronic Kidney Disease Prediction Using Back Propagation Neural Network Algorithm, 2017, vol. 508, pp. 295–303.
[11] M. Yassami and P. Ashtari, “Using fuzzy genetic, Artificial Bee Colony (ABC) and simple genetic algorithm for the stiffness optimization of steel frames with semi-rigid connections,” KSCE J. Civ. Eng., vol. 19, no. 5, pp. 1366– 1374, 2015.