Automatic Detection of ECG R-R Interval
using Discrete Wavelet Transformation
1
Vanisree K 2Jyothi Singaraju Research Scholar Associate Professor
Dept. of Computer Science Sri Padmavathi Mahila Visvavidyalayam
Tirupati-517 502. AP, India.
Abstract—Detection of QRS-complexes takes an important role in the analysis of ECG signal, based on which the number of heart beats and an irregularity of a heart beat through R-R interval can be determined. Since an ECG may be of different lengths and as being a non-stationary signal, the irregularity may not be periodic instead it can be shown up at any interval of the signal, it is difficult for physician to analyze ECG manually. In the present study an algorithm has been developed to preprocess and to automatically determine the R-R interval of ECG signal based on Discrete Wavelet Transformation (DWT). The developed algorithm initially performs preprocessing of a signal in order to remove Baseline Drift (De-trending) and noise (De-noising) from the signal and then it uses the preprocessed signal for finding R-R interval of the ECG signal automatically. By using developed algorithm, the accuracy of the analysis can be increased and the analysis time can be reduced.
Keywords-ECG, QRS-complex, R-R interval, DWT, Baseline Drift, De-noising.
I. INTRODUCTION
The Electrocardiogram (ECG or EKG) is a graphic record of the direction and magnitude of electrical activity of the heart that is generated by depolarization and repolarization of the atria and ventricles [1].
Depolarization occurs when the cardiac cell, which are electrically polarized, lose their internal negativity. The spread of depolarization travels from cell to cell, producing a wave of depolarization across the entire heart. This wave represents a flow of electricity that can be detected by electrodes placed on the surface of the body. Once depolarization is completed the cardiac cells are restored to their resting potential, a process called
repolarization. This flow of energy takes in the form of ECG wave and is composed of P wave followed by QRS complex followed by T wave followed by U wave per cardiac cycle which is shown in Fig. 1. The P wave is a small low-voltage deflection away from the baseline caused by the depolarization of the atria prior to atria contraction. QRS-complex is the largest-amplitude portion of the ECG, caused by currents generated when the ventricles depolarize prior to their contraction. The T-wave is the result of ventricular repolarization and finally the small U wave although not always visible, is considered to be a representation of the Papillary Muscle or Purkinje Fibers.
Generally, the condition of a heart can be determined by extracting features [2] from the ECG signal. These features include the amplitudes of the waves and the intervals between them. A normal ECG signal has the following amplitudes values: P-wave 0.25 mV, R-wave 1.6mV, Q-wave 25% of the R-wave, T-wave 0.1 to 0.5 mV; the time interval values: PR-interval 0.12-0.2s, QRS complex 0.04 to 0.12s, QT interval <0.42s and the heart rate of 60-100 beats/min [3]. Any change in the above said values indicates the abnormality of the heart.
Among all the waves, QRS complex is the most significant wave [4] of an ECG signal through which R-R interval can be determined. Using this R-R interval [5][6] one can find the irregularity of the heart beat and the number of beats per minute. Identification of the normal QRS-complex from the P- and T-waves does not create difficulties because it has a characteristic waveform and dominating amplitude. This amplitude is about 1 mV in a normal heart and can be much greater in ventricular hypertrophy. The heart rate and the irregularity of heart beat can be determined using this QRS complex by calculating the R-R interval.
In the present study an algorithm has been developed in order to detect QRS-Complexes and the R-R intervals automatically. The developed algorithm initially decomposes the original ECG signal by using Discrete Wavelet Transformation and Daubehies Wavelet (db6) as mother wavelet. It removes the low frequency components in order to remove the Baseline Drift (De-trending) and removes the thresholded high frequency components in order to remove the noise (De-noising) from the original signal. Then it uses the preprocessed signal for finding R-R interval of the ECG signal automatically.
The sample ECG signals for the present study are obtained from MIT/BIH database via Physionet website [7]. The MIT-BIH database contains both normal and abnormal types of ECG signals. In this study, an abnormal ECG signal of type MIT-BIH Arrhythmia Database sampled at 360 Hz is selected. Each selected ECG signal is of thirty minute duration, but only 5 minutes duration of the signal is used for processing in this study.
The present paper is organized as follows. Section 2 gives a detailed description of Discrete Wavelet Transformation. In section 3, a procedure for the automatic detection of ECG R-R interval is presented. The Experiments and results of the present study are also given in this section and finally conclusion is given in section 4.
II. DISCRETE WAVELET TRANSFORMATION
Signals can be analyzed by using a well known method called Fourier Transformation, which breaks down a signal into constituent sinusoids of different frequencies. i.e it transforms the signal from time based to frequency based. For many signals (stationary signal), Fourier Transform is extremely useful because the signals frequency content is of great important. But the serious drawback with this approach is in transforming to frequency domain, the time information is lost. So, it is not possible to tell when a particular event occurred through this approach. This drawback can be overcome by using Short Time Fourier Transformation (STFT). In a Short Time Fourier Transformation a signal is mapped in both frequency and time dimensions using a technique called Widowing. Though the time and frequency information is obtained at a time using this approach, it has a drawback that the size of the time window must be fixed for all frequencies. To overcome this drawback a most commonly used method called Wavelet Transformation [8] is used where it has a time window of variable size.
A Wave is an oscillating function of time or space, Wavelets are localized waves and they have their energy concentrated in time or space. The Transform of a signal is another form of representing the signal. It does not change the information content present in the signal. The Wavelet Transform provides a time- frequency representation of the signal and is well suited to the analysis of non-stationary signals [9] such as ECG. A Wavelet Transformation uses multi resolution technique by which different frequencies are analyzed with different resolutions. A Wavelet Transform, at high frequencies, gives good time resolution and poor frequency resolution, while at low frequencies the Wavelet Transform gives good frequency resolution and poor time resolutions.
One of the most frequently and commonly used Wavelet Transformation is the Discrete Wavelet Transformation (DWT). Mathematically a Discrete Wavelet Transform can represent as
(1)
Where x(t) is the signal to be analyzed. Ψ(t) is the mother wavelet or the basis function. All the wavelet functions used in the transform are derived from the mother wavelet through wavelet translation (n) and scaling (m). The translation parameter n refers to the location of the wavelet function as it is shifted through the signal and the scale parameter m corresponds to frequency information. Large scales (low frequencies) dilate the signal and provide detailed information hidden in the signal, while small scales (high frequencies) compress the signal and provide global information about the signal. The wavelet transform merely performs the convolution operation of the signal and the basis function.
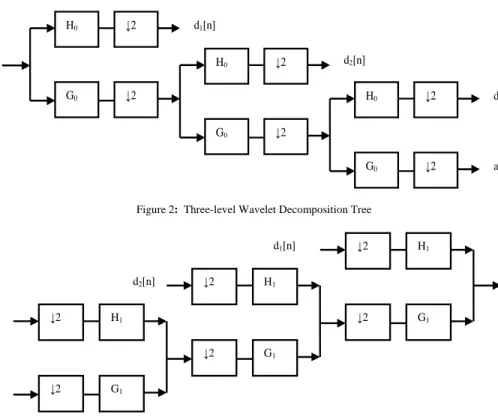
The Discrete Wavelet Transform of a signal can be computed by passing it through the lowpass and highpass filters as shown in Fig. 2. This is called the Mallat algorithm or Mallat-tree decomposition [10]. In the Fig. 2, X[n] represents the original signal to be filtered, where n is an integer, G0 represents the lowpass filer and H0
represents the highpass filter. At each level, the highpass filters produces detail information, d[n], while the lowpass filters associated with scaling function produces coarse approximations, a[n].
With this approach, the time resolution becomes arbitrary good at high frequencies, while the frequency resolution becomes arbitrary good at low frequencies. The filtering the decimation process is continued until the desired level is reached. The maximum number of levels depends on the length of the signal. The DWT of the original signal is then obtained by concatenating all the coefficients, a[n] and d[n], starting from the last level of decomposition.
Fig. 3 shows the reconstruction of the original signal from wavelet coefficients. Basically, the reconstruction is the reverse process of decomposition. The approximation and detail coefficients at every level are upsampled by two, passing through the low pass and high pass synthesis filters and then added. This process is continued through the same number of levels as in the decomposition process to obtain the original signal. The Mallat algorithm works equally well if the analysis filters, G0 and H0, are exchanged with synthesis filters, G1 and H1.
X[n] d1[n] H0 G0 ↓2 ↓2 d2[n] H0 G0 ↓2 ↓2
d3[n]
a3[n] H0 G0 ↓2 ↓2
Figure 2: Three-level Wavelet Decomposition Tree
d3[n]
a3[n] ↓2 ↓2 H1 G1
d2[n] d1[n] X[n] ↓2 ↓2 H1 G1 ↓2 ↓2 H1 G1
There are a number of basis functions that can be used as the mother wavelet for Wavelet Transformation. Since the mother wavelets produces all the wavelet functions used in the transformation through translation and scaling, it determines the characteristics of the resulting Wavelet Transform.
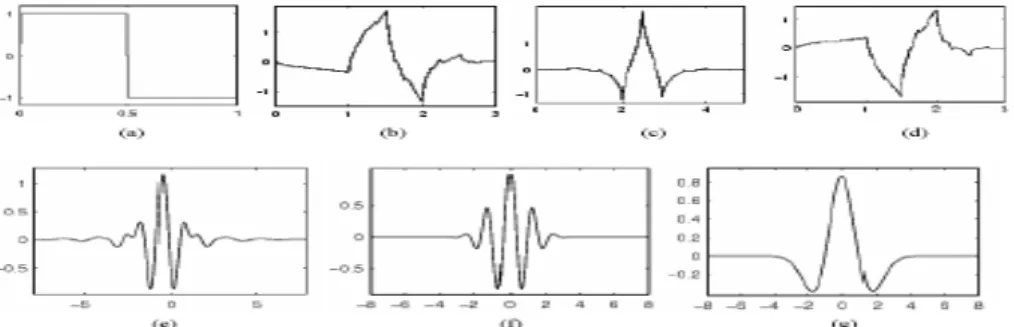
Fig. 4 illustrates some of the commonly used wavelet functions. The Haar wavelet is one of the oldest and simples wavelet. Daubaches wavelets are the most popular wavelets. The Haar, Daubeches, Symlets and Coiflets are compactly supported orthogonal wavelets. The wavelets are chosen based on their shape and their ability to analyze the signal in a particular application.
III. AUTOMATIC DETECTION OF ECGR-R INTERVAL USING DISCRETE WAVELET TRANSFORMATION
When an Electrocardiogram is recorded many kinds of noises are also be recorded due to very low and high frequencies [11] , which causes an ECG to have baseline drift and noise in the signal and is very difficult to clinically diagnose. For proper diagnosis of ECG it is necessary to remove noise from the signal. A process of removing the baseline drift of a signal [12] is called as de-trending and a process of removing the noise [13] of a signal is called as de-noising. Both of these processes come under the preprocessing of an ECG signal. Once the signal is preprocessed then it can be used for further processing (extracting R-R interval). In the present study, an algorithm has been developed both to preprocess and to find RR-interval of ECG signal automatically by using Discrete Wavelet Transformation (DWT). The developed algorithm is implemented using MATLAB 7.3. In this study, in order to test the developed algorithm a Record No 101 of MIT-BIHArrhythmia database is selected.
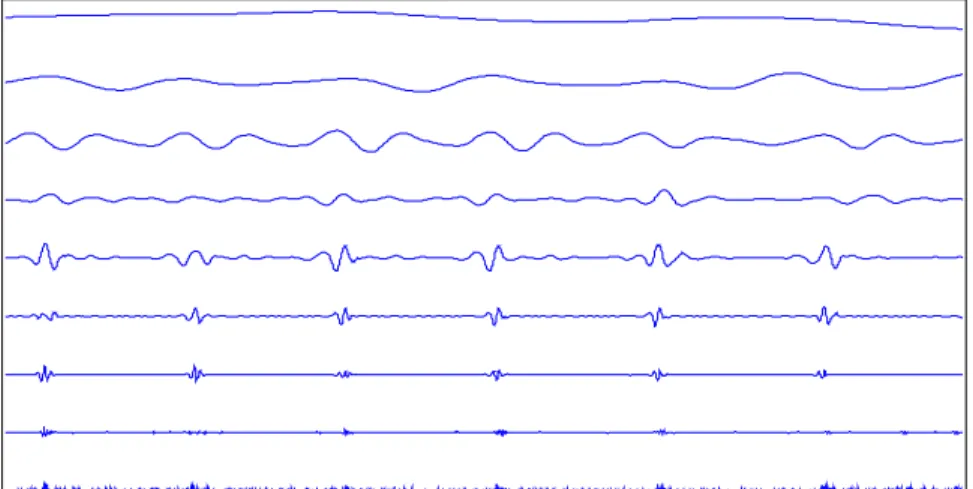
In order to perform all these operations, the developed algorithm initially decomposes the obtained original ECG signal into corresponding Approximation and Detail coefficients up to 8 levels using Discrete Waveletet Trasformation. The mother wavelet or basis function that is used in the decomposition is Dabachies6 (db6) [14]. The decomposed approximation and detail coefficients of the original signal are cA1, cA2 . . . , cA8 and cD1, cD2. . . ,cD8 . The decomposed signal is then reconstructed to get original ECG signal components by using Inverse Discrete Wavelet Transformation (IDWT). The reconstructed approximation and detail coefficients of the signal are A1, A2 . . . ., A8 and D1, D2, … D8. Among these components, the components A8 and D8 have the lowest frequencies, the components A1 and D1 have the highest frequencies and between of these components have from lower to higher frequencies. Now the obtained individual reconstructed ECG components are used for both preprocessing and for finding R-R interval automatically in the following way. The original ECG signal of length 800 samples are shown in shown in Fig. 5 and the reconstructed components of decomposed ECG signal of length 3600 samples are shown in Fig. 6.
Figure 4: Wavelet Families (a) Haar (b) Daubachies4 (c) Coiflet1 (d) Symlet2 (e) Mayer (f) Morlet (g) Mexican Hat
0 100 200 300 400 500 600 700 800 -0.6 -0.4 -0.2 0 0.2 0.4 0.6 0.8 1 1.2
A. ECG Baseline Drift Removal
Since the low frequency components cause the signal for baseline shifting, these components must be deducted to have a signal without baseline drift. In this study, the low frequency components of a decomposed signal are A8 and D8. Therefore, to remove the baseline Drift these components should be removed from the original ECG signal. i.e De-trended Signal (DS) = Original Signal - (A8+D8). Thus the problem of baseline shifting is solved. The de-trended ECG signal of length 800 samples is shown Fig. 7.
B. ECG De-noising
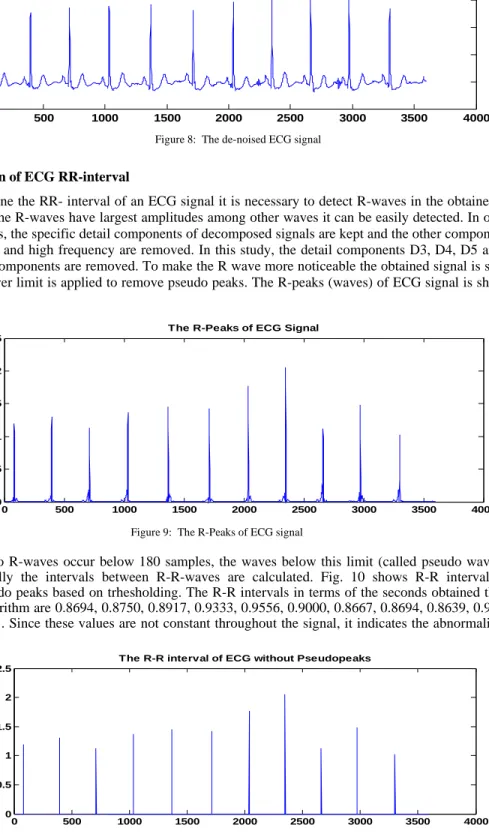
Though the low frequency components are removed from the original signal, still it may have noise due to high frequency components. In order to remove noise from the signal it is required to identify which components contain the noise and then these identified components are removed from the de-trended signal. When we decompose a signal by DWT, we note that successive approximations become less and less noisy as more and more high frequency information is filtered out of the signal. But, in discarding all the high frequency information, we may also lose many of the original signal’s sharpest features. Optimal de-noising requires a more subtle approach called thresholding [15]. This involves discarding only the portions of the details that exceed a certain limit. We use here global thresholding option, which is derived from Donoho-Johnstone fixed form thresholding strategy for an un-scaled white noise. In this study the identified high frequency components are D1, D2.These components must be filtered by applying a threshold. Then the thresholded components are removed from the de-trended signal. The de-noised ECG signal of length 3600 samples is shown in Fig. 8.
\ D7 D8 A8 D6 D5 D4 D3 D2 D1
Figure 6: The Reconstruction components of original ECG signal
0 100 200 300 400 500 600 700 800 -0.2 0 0.2 0.4 0.6 0.8 1 1.2 1.4
De trende d Original ECG Signal
C. Extraction of ECG RR-interval
To determine the RR- interval of an ECG signal it is necessary to detect R-waves in the obtained ECG signal. Since the R-waves have largest amplitudes among other waves it can be easily detected. In order to detect R-waves, the specific detail components of decomposed signals are kept and the other components of low frequency and high frequency are removed. In this study, the detail components D3, D4, D5 are kept and all other components are removed. To make the R wave more noticeable the obtained signal is squared and then a lower limit is applied to remove pseudo peaks. The R-peaks (waves) of ECG signal is shown in Fig. 9.
Because no two R-waves occur below 180 samples, the waves below this limit (called pseudo waves) are removed and finally the intervals between R-R-waves are calculated. Fig. 10 shows R-R intervals after removing the pseudo peaks based on trhesholding. The R-R intervals in terms of the seconds obtained through the developed algorithm are 0.8694, 0.8750, 0.8917, 0.9333, 0.9556, 0.9000, 0.8667, 0.8694, 0.8639, 0.9111for the Record No 101. Since these values are not constant throughout the signal, it indicates the abnormality of a heart. 0 500 1000 1500 2000 2500 3000 3500 4000 0 0.5 1 1.5 2 2.5
The R-Peaks of ECG Signal
Figure 9: The R-Peaks of ECG signal
0 500 1000 1500 2000 2500 3000 3500 4000 0 0.5 1 1.5 2 2.5
The R-R interval of ECG without Pseudopeaks
Figure 10: The R-R interval ECG signal without Pseudo Peaks
0 500 1000 1500 2000 2500 3000 3500 4000 -0.5 0 0.5 1 1.5 2 De-noised Signal
IV. CONCLUSION
As the irregularity of a heart beat can be determined based on the R-R interval of ECG signal, it is difficult for physicians to manually detect R waves and to calculate the R-R interval and is a time consuming process. Therefore the proposed algorithm can be used to automatically detect R-peaks and R-R interval of ECG signals which reduces the time and increases the accuracy. Thus the performance of the proposed system is increased. REFERENCES
[1] A.K.M Fazlul Haque, Md. Hanif Ali, M. Adman Kiber, M.dTanvir Hasan, “Detection of small variations of ECG features using Wavelets”, ARPN Journal of Engineering and Applied Sciences”, ISSN 1819-6608, Vol.4, No.6, pp. 27-30, Aug 2009.
[2] Dubois, pierre Maison-Blanche, Brigitte Quenet, Gerard Dreyfus “Automatic ECG wave extraction in long term recordings using Gaussian mesa function models and non-linear probability estimators”, Elsevier, Computer methods and programs in Biomedicine Vol. 88, pp. 217-233, 2007.
[3] C. Saritha, V. Sukanya, V.NArasimha Murthy,“ECG Signal Analysis using Wavelet Transforms”, Bulg.J.Physics, Vol. 35, pp.68-77, 2008.
[4] M.A. Khayer, M.A.Haque “ECG Peak Detection using Wavelet Transform”, 3rd
International Conference on Electrical Computer Engineering (ICECE 2004), ISBN 984-32-1804-4, 28-30, 2004, Dhaka, Bangladesh, pp. 518-521.
[5] A. Ghodrati, S. Marinello,“Statistical Analysis of RR interval Irregularities for Detection of Atrial Fibrillation”, IEEE Transactions on Computers in Cardiology, ISSN 0276-6574, Vol. 35, pp. 1057-1060, 2008.
[6] M G. Tsipouras, D I Fotiadis, D Sideris , “Arrhythmia Classification using the RR-interval Duration Signal”,IEEE Transactions on Computers in Cardiology, Vol. 29, 485-488, 2002.
[7] www.physionet.org/physiobank/database/mitdb/
[8] M. Llamedo Soria, JP Martinez, “An ECG Classification Model based as Multilead Wavelet Tranform Features”, IEEE Transactions on Computers in Cardiology, 2007, ISSN 0276-6574, Vol. 34, pp. 105-108.
[9] Abdel-Rahman AI-Qqwasmi, Khaled Daqrouq, “ECG Signal Enhancement using Wavelet Transformations”, WSEAS Transactions on Biology and BioMedicine, ISSN 1109-9518, Vol.7, No.2, April 2010.
[10] Mallat J, “A theory of multiresolution signal decomposition using the Wavelet Transformation”, IEEE Transactions on Pattern Analysis abd Machine Intellignece, Vol. 11, pp. 674-693, 1989.
[11] Vidur Arora, RAhul Chugh, Abhishek Garneja and K.A.Pujari, “Digital ECG and its Analysis”, proceedings of SPIT-IEEE Colloquium and International Conference, Mumbai, India, Vol.1, pp. 1-7.
[12] K.Daqrouq,“ECG Baseline Wandering Reduction using Discrete Wavelet Transformations”, Asian Journal of Information
Technology, Vol. 4, No. 11, pp. 989-995, 2005.
[13] Umamaheswara Reddy, M.Muralidhar, S. Varadarajan, “ECG Denoising using improved Thresholding based on Wavelet
Transformations”, International Journal of Computer Science and Network Security”, Vol. 9, No.9, sep-2009, pp. 221-225.
[14] S.Z.Mahmoodabbadi, A. Ahmadian, M.D.Abolhasani, “ECG Feature Extraction using Daubeches Wavelts”, Proceedings of the Fifth IASTED International Conference on VISUALIZATION, IMAGING, and IMAGE PROCEEDINGS, Sep 7-9, 2005, Benidorm, Spain. [15] Mikhled Alfaouri and Khaled Daqrouq, “ECG Signal Denoising by Wavelet Tranform Thresholding”, American Journal of Applied