First trimester maternal BMI is a positive predictor
of cord blood c-peptide levels while maternal visfatin
levels is a negative predictor of birth weight
Georgios Valsamakis,
1,4Dimitrios C. Papatheodorou,
1Alexandra Margeli,
2Vassilios Bakoulas,
1Efthymios Kapantais,
3Ioannis Papassotiriou,
2George Creatsas,
1Sudhesh Kumar,
4George Mastorakos
11Endocrine Unit, 2nd Department of Obstetrics and Gynecology, Aretaieion University Hospital, Athens Medical School; 2Department of Clinical Biochemistry, “Aghia Sophia” Children’s Hospital; 3Department of Diabetes Obesity and Metabolism, Metropolitan Hospital; Athens, Greece; 4Warwickshire Institute for the Study of Diabetes, Endocrinology and Metabolism (WISDEM), University Hospital Coventry and Warwick Medical School, Coventry, UK
AbstrAct
ObJEctIVE: the role of first trimester maternal body mass index (bMI) and adipocytokines in cord blood c-peptide and birth weight in pregnancy was investigated. DEsIGN: seventy non-diabetic pregnant caucasian women were recruited. Anthropometry and measurements of fasting adipocytokines (visfatin, leptin, adiponectin), insulin and glucose were performed in each of the three trimesters. At birth, birth weight and cord blood c-peptide, glucose, insulin, visfatin, leptin, adiponectin and IL6 in each neonate were measured. rEsULts: First trimester maternal bMI correlated positively with cord blood c-peptide (p=0.035, r=0.74) and negatively with cord blood visfatin (p=0.049, r=-0.67). First trimester HOMAr was negatively correlated with cord blood visfatin (p=0.037, r=-0.90) and negatively with cord blood leptin (p=0.031, r=0.90). First trimester maternal bMI was a positive predictor of cord blood c-peptide (p=0.007). First trimester maternal visfatin levels were negative predictors of birth weight (p=0.017). cONcLUsIONs: We conclude that first trimester maternal bMI and serum visfatin seem to be strongly associated with fetal insulin secretion and final birth weight, respectively, suggest-ing a role of early-pregnancy maternal adipose tissue in the pregnancy metabolic environment. Key words: Fetal growth, Maternaladiposity
Address for correspondence:
Dr. George Mastorakos, 3 Neofytou Vamva Str., 10674 Athens, Greece, e-mail: [email protected]
Received 27-06-2013, Accepted 17-10-2013
Research paper
IntroductIon
Fetal growth and metabolism depend on genetic predisposition as well as on the intrauterine
meta-bolic environment. Their effect is expressed by birth weight, a measure of growth.1,2 Fetal insulin secretion and growth are influenced by maternal glucose me-tabolism and adipose tissue deposition which, in their turn, influence the development of the “naturally” occurring insulin resistance during pregnancy.3-5 Often there are reports of large-for-gestational-age babies
without the presence of gestational diabetes. Pre-pregnancy maternal body mass index (BMI) affects birth weight and the risk of gestational diabetes.6,7
In pregnancy, adipose tissue markers such as adi-pocytokines (i.e. leptin, adiponectin, visfatin) affect adaptation to insulin resistance, thus playing a role in glucose homeostasis and pregnancy outcome.8,9 In the past, we and others have shown that 1st trimester maternal levels of visfatin, an insulinomimetic factor, are a positive predictor of insulin sensitivity in normal and gestational diabetes-complicated pregnancies.8,10 In addition, it is via fetal β-cell insulin secretion that the rate of glucose utilization is matched and, thus, the rate of fetal growth and final birth weight are influenced.11,12 Fetuses with intrauterine growth restriction (IUGR) exhibit β-cell dysfunction as well as adipose tissue dysfunction with affected secretion of adipocytokines.13-15
Recently, the large epidemiological HAPO study revealed strong and continuous associations of ma-ternal glucose levels during the oral glucose tolerance test (OGTT) performed at 24 to 32 weeks of gestation, below those diagnostic of diabetes, with increased birth weight and cord blood serum c-peptide levels.16 Another study showed that higher first-trimester fasting glucose levels, within a non-diabetic range, increase the risk of adverse pregnancy outcomes such as gestational diabetes and large-for-gestational-age neonates and/or macrosomia.17 First trimester mater-nal adiponectin and leptin levels are associated with insulin resistance during pregnancy as well as with birth weight.18,19 As early maternal adiposity seems to play a crucial role regarding pregnancy outcomes, such as insulin resistance and birth weight, the role of first trimester maternal weight and adipocytokines in fetal glucose and adipocytokine metabolism is of particular interest, albeit not as yet clear.
Detection of women from the first trimester at higher risk for adverse pregnancy and fetal outcomes is a target of clinical investigation. The primary objec-tive of this study was to examine the predicobjec-tive effect of first trimester maternal BMI and adipocytokines on birth weight and fetal β-cell insulin secretion (as reflected by cord blood c-peptide) in non-diabetic pregnant women. Also, as a secondary aim of the study the association of first trimester maternal BMI
with cord blood adipocytokines was investigated.
subjects and Methods
Patients
The study had the approval of the local ethics com-mittee and all study participants gave their written informed consent. Study participants were seventy-four (74) pregnant primigravidae Caucasian women with mean (+SD) BMI of 26.8 (3.1) kg/m2 (before pregnancy), aged 29.5 (4.5) years, with no history of type 2 diabetes mellitus, recruited during the 1st tri-mester of pregnancy from the 2nd University Depart-ment of Obstetrics and Gynecology outpatient clinic of Aretaieion University Hospital between January 2011 and September 2011. Exclusion criteria were as follows: non-Caucasian; BMI before pregnancy >35 kg/m2; history of type 1 or type 2 diabetes; multiple pregnancy; major vaginal bleeding; hypertension; preeclampsia; gestational diabetes; urinary tract infection; fever (>37.5°C); fetal/placental abnor-malities (i.e., congenital anomalies, placenta previae, placental abruption); remarkable previous medical, surgical or gynecological history; and current smoking or alcohol intake. To avoid bias, all available women who were valid according to the inclusion/exclusion criteriawere recruited on a random first visit basis. In order to study the role of 1st trimester maternal BMI and adipocytokines in fetal β-cell secretion and birth weight, we recruited randomly non-diabetic pregnant women with prepregnancy BMI <35kg/m2.
Protocol
The women were seen once during each of the three trimesters of their pregnancy during the 10th -12th, 24th-26th and 34th-36th weeks, respectively. All studied pregnant women received the standard di-etetic advice during pregnancy. Four of the women who were selected for study participation developed gestational diabetes during pregnancy and were sub-sequently excluded. At each visit, they were submit-ted to anthropometric measurements and a fasting blood sampling for measurement of adipocytokines (adiponectin, visfatin, leptin), insulin and glucose. At birth, neonates were weighed and cord blood was sampled for c-peptide, glucose, insulin, visfatin, adiponectin, IL-6 and leptin measurements.
Anthropometric measurements
All measurements were carried out by a single observer. For all women, weight before pregnancy was retrieved from their records and height was measured to the nearest mm using a stadiometer. At each visit, weight without shoes and with light clothing was measured in kilograms to the nearest 0.1 kg on a beam balance and BMI [weight/(height)2 in kg/m2] was calculated; maximum hip circumference in centimeters was taken in duplicate with a 6 mm wide flexible tape at the widest part of the trochant-ers with the women in a horizontal position, the feet kept 20-30 cm apart.
Blood chemistry and hormone assays
All determinations were performed in maternal and cord blood sera. Glucose measurements were performed with the Siemens Advia 1800 Clinical Chemistry System (Siemens Healthcare Diagnostics, Tarrytown, NY, USA), while insulin levels were measured with an electrochemiluminescence im-munoassay using the automated analyzer Cobas e411 and the Elecsys Insulin Kit (Roche Diagnostics, Basel, CH). The intra- and inter-assay coefficients of variation (CV) were 2.0% and 2.8%, respectively; the sensitivity limit was 0.2 mIU/L. High sensitivity IL-6 was determined with an ELISA (Quantikine, R&D Systems, Minneapolis, MN., USA): the sensitivity limit was 0.156 ng/L, while the inter- and intra-assay CVs at the level of 0.436 ng/L were 9.6% and 6.9%, respectively. Serum and cord blood leptin and adi-ponectin concentrations were measured with sensitive ELISAs from R&D Systems (Minneapolis, MN., USA) and B-Bridge International (Cupertino, CA., USA), respectively. Intra-assay CVs were 3%-3.3% for leptin and 3.3%-5.8% for adiponectin; inter-assay CVs were 3.5%-5.4% for leptin and 3.2%-7.3% for adiponectin. Serum visfatin levels were measured us-ing a commercial enzyme immunoassay kit (Visfatin C-Terminal [Human] EIA; Phoenix Pharmaceuticals, Belmont, CA. USA) according to the manufacturer’s instructions. The intra- and inter-assay CVs were 5% and 12%, respectively. The sensitivity limit was 0.1 ng/mL. C-peptide levels were determined with a solid phase two-site chemiluminescent immunometric assay, using the Immulite 2000 Chemiluminescence autoanalyzer (Siemens Healthcare Diagnostics, Los
Angeles, CA., USA) with intra- and inter-assay CVs at 3.5% and 6.2%, respectively, and sensitivity limit at 0.09 ng/mL.
Indices of carbohydrate metabolism
Insulin resistance was estimated by the homeostasis model assessment (HOMA-R; [insulin at baseline, pmol/L x glucose at baseline, mmol/L]/135).20-22 Statistical analysis
Data are described as mean ± SD or median and interquartile range (25th-75th percentile) for data not normally distributed. To test the change of each variable during pregnancy, the one-way repeated measures ANOVA and the non-parametric Fried-man ANOVA tests were used in the case of normally and non-normally distributed variables, respectively. To test whether changes differed between pairs of time points of special interest, a paired t-test was performed. To test the associations between different variables and to test correlations between differences, the Spearman correlation analysis was performed. Multiple regression analysis was undertaken to define 1st trimester predictors of neonatal birth weight and cord blood c-peptide levels. A p-value of <0.05 was considered to be significant. The SPSS statistical software was used for statistical analysis (SPSS Inc., Chicago, IL, USA).23
results
1. Description of maternal anthropometric variables, fasting adipocytokines and
carbohydrate metabolism parameters during pregnancy (Table 1), cord blood variables and birth weight (Table 2)
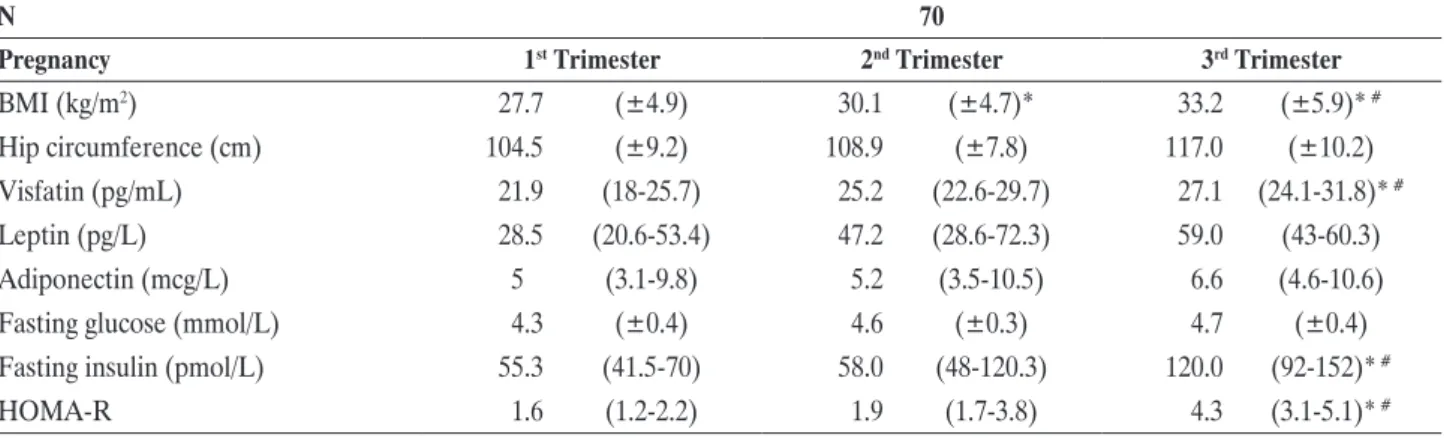
Maternal BMI increased significantly from the 1st to the 2nd and the 3rd trimesters (p=0.002). Serum visfatin levels increased significantly from the 2nd to the 3rd trimester (p=0.034) during pregnancy. There was a clear, although non-significant, upward trend in mean leptin concentrations, this probably due to high variation (SD). Fasting insulin levels (p=0.003) and HOMA-R (p=0.002) were significantly higher in the 3rd as compared to the 1st and the 2nd trimesters. Cord blood parameters are reported in Table 2. Neonatal birth weight was within normal values.
with 1st (r=0.74, p=0.035) (Figure 1) and 3rd trimes-ter (r=0.67, p=0.049) matrimes-ternal BMI. Cord blood visfatin was negatively correlated with 1st trimester
table 1. Maternal anthropometric variables, fasting adipocytokines and fasting carbohydrate metabolism parameters during pregnancy. Birth weight and fetal cord blood variables at delivery. Variables expressed as mean (±SD) or median (25th–75th interquartile range)
Ν 70
Pregnancy 1st Τrimester 2nd Τrimester 3rd Τrimester
BMI (kg/m2) 27.7 (±4.9) 30.1 (±4.7)* 33.2 (±5.9)* #
Hip circumference (cm) 104.5 (±9.2) 108.9 (±7.8) 117.0 (±10.2) Visfatin (pg/mL) 21.9 (18-25.7) 25.2 (22.6-29.7) 27.1 (24.1-31.8)* # Leptin (pg/L) 28.5 (20.6-53.4) 47.2 (28.6-72.3) 59.0 (43-60.3)
Adiponectin (mcg/L) 5 (3.1-9.8) 5.2 (3.5-10.5) 6.6 (4.6-10.6)
Fasting glucose (mmol/L) 4.3 (±0.4) 4.6 (±0.3) 4.7 (±0.4)
Fasting insulin (pmol/L) 55.3 (41.5-70) 58.0 (48-120.3) 120.0 (92-152)* #
HOMA-R 1.6 (1.2-2.2) 1.9 (1.7-3.8) 4.3 (3.1-5.1)* #
(*): statistically significant (P<0.05) change from 1st trimester, (#): statistically significant (P<0.05) change from 2nd trimester.
table 2. Birth weight and fetal cord blood variables at delivery. Variables expressed as mean (±SD) or median (25th–75th inter-quartile range)
Birth weight (g) 3185.0 (2732-3540) Cord glucose (mg/dL) 99.0 (±17.0) Cord insulin (mIU/mL) 9.9 (8-14.2) Cord c-peptide (ng/mL) 0.8 (0.5-1.0) Cord leptin (pg/mL) 32.5 (12.5-65.2) Cord adiponectin (mg/mL) 38.1 (33.1-47.7) Cord IL-6 (pg/mL) 1.4 (1.2-3.5) Cord visfatin (pg/mL) 8.2 (3.6-12.3)
table 3. Statistically significant correlations (p <0.05) of cord blood variables with, respectively, maternal anthropometric variables, fasting adipocytokines and HOMAR of the three trimesters of pregnancy
1st trimester
Variable 1 Maternal BMI Maternal HOMAR Maternal BMI Maternal leptin Maternal HOMAR Variable 2 Cord c-peptide Cord visfatin Cord visfatin Cord visfatin Cord leptin
r-Spearman 0.74 -0.90 -0.67 -0.99 0.90
p-value 0.035 0.037 0.049 <0.001 0.031
3rd trimester
Variable 1 Maternal BMI Maternal BMI Maternal visfatin Maternal adiponectin Variable 2 Cord c-peptide Cord glucose Cord IL6 Cord glucose
r-Spearman 0.67 0.69 -0.90 0.95
p-value 0.049 0.041 0.037 <0.001
2. Significant correlations of cord blood variables with maternal anthropometric variables, fasting adipocytokines and carbohydrate metabolism parameters of the three trimesters of pregnancy (Table 3)
Cord blood c-peptide was positively correlated
First trimester maternal BMI (kg/m2)
Figure 1. Correlation between 1st trimester maternal BMI and cord blood c-peptide (p=0.035, r=0.74).
HOMAR (r=-0.90, p=0.037), maternal BMI (r=-0.67, p=0.049) and maternal leptin (r=-0.99, p<0.001). Cord blood leptin was positively correlated with 1st trimester HOMAR (r=0.90, p=0.03). Cord blood IL6 was negatively correlated with 3rd trimester maternal visfatin (r=-0.90, p=0.037). Cord blood glucose was positively correlated with 3rd trimester maternal BMI (r=0.69, p=0.041) and adiponectin (r=0.95, p=0.015). Among cord blood variables only cord blood c-peptide was positively correlated with cord blood insulin (r=0.88, p<0.001).
3. Significant correlations of birth weight with maternal anthropometric variables, fasting adipocytokines and carbohydrate metabolism parameters of the three trimesters of pregnancy and with cord blood variables (Table 4)
Birth weight correlated positively with 1st trimester maternal hip circumference (p=0.026, r=0.52), 3rd trimester HOMAR (p=0.011, r=0.76) and maternal BMI (p=0.009, r=0.59) and negatively with 3rd tri-mester maternal visfatin levels (p=0.040, r=-0.72).
Birth weight was positively associated with cord blood c-peptide (p=0.041, r=0.77), cord blood glucose (p=0.012, r=0.89) and cord blood insulin (p=0.037, r=0.831). There was no statistically significant cor-relation between cord blood adipocytokines and birth weight (p>0.05).
4. First trimester predictors of cord blood c-peptide and birth weight
Multiple linear regression analysis revealed that 1st trimester maternal BMI was the best positive pre-dictor (p=0.007, beta=0.84) of cord blood c-peptide among 1st trimester maternal BMI and HOMAR, weight gain, age, gestational age of birth, sex and birth weight. Multiple linear regression analysis revealed
that 1st trimester maternal visfatin levels were the best negative predictor (p=0.017, beta=-1.23) of birth weight among 1st trimester maternal visfatin, adiponectin, leptin, HOMAR, weight gain, maternal age, gestational age of birth.
dIscussIon
We investigated first trimester maternal BMI and adipocytokine levels (leptin, adiponectin, visfatin) of non-diabetic pregnant women during the three tri-mesters of pregnancy in relation to cord blood insulin and adipocytokine (leptin, adiponectin, visfatin, IL6) levels as well as birth weight. As expected, insulin resistance increased during the studied pregnancies. Maternal visfatin levels increased significantly from the 2nd to the 3rd trimester along with an increasing trend of leptin levels, confirming our previous reports.8 In fact, we have recently postulated that this progressive increase of maternal visfatin levels, an insulinomimetic hormone, during pregnancy indicates an adaptive mechanism to pregnancy-related development of insulin resistance.8 In first trimester, maternal BMI and serum adipocytokines reflect maternal adipose tissue secretion, while cord blood adipocytokines reflect that of fetal adipose tissue.24,25
First trimester maternal BMI had the strongest positive correlation with cord blood c-peptide and was its only strong positive predictor among first trimester maternal BMI, HOMAR, maternal weight gain and age, gestational age of birth, sex and birth weight. The involvement of first trimester maternal BMI in pregnancy-related insulin resistance might explain its association with fetal insulin secretion. In addition, maternal HOMAR, a marker of ma-ternal insulin resistance, showed a positive correla-tion with birth weight in the third trimester only, a
table 4. Statistically significant (p<0.05) correlations of birth weight with maternal anthropometrics, maternal fasting adipocytokines, ma-ternal carbohydrate metabolism and cord blood variables at birth
Variable 1 Birth weight Birth weight Birth weight Birth weight Birth weight Birth weight Birth weight
Variable 2 1st trimester maternal hip circumference 3rd trimester maternal HOMAR 3rd trimester maternal BMI 3rd trimester maternal visfatin
Cord c-peptide Cord glucose Cord insulin
r-spearman 0.52 0.76 0.59 -0.72 0.77 0.89 0.83
period when maternal insulin resistance peaks, this indicating that insulin resistance affects birth weight mostly during the third trimester. In this study, cord blood c-peptide levels, a proxy for fetal pancreatic insulin secretion, correlated positively with birth weight, while others have shown a gradual increase of cord blood c-peptide concentrations in large-for-gestational age compared to average-weight and to small-for-gestational-age newborns.26,27 It seems that ethnicity might influence this positive correlation since higher c-peptide concentrations have been reported in North African origin neonates compared to those of Belgian origin.28
Furthermore, first trimester maternal BMI, lep-tin and HOMAR correlated negatively with cord blood visfatin levels, while first trimester maternal HOMAR correlated positively with cord blood leptin levels. Thus, it seems that a higher maternal BMI (accompanied by increased maternal insulin resist-ance) during the first trimester is associated with decreased fetal visfatin secretion, indicating blunting of this presumably adaptive fetal mechanism to the maternal weight-associated insulin resistance. In addition, first trimester maternal visfatin levels were the best negative predictor of birth weight among 1st trimester maternal visfatin, adiponectin, leptin, HOMAR, weight gain, maternal age and gestational age of birth. These associations might imply a role of maternal genetics, other than the environmental one, in fetal carbohydrate and adipose tissue metabo-lisms. Indeed, in the past we have shown that serum leptin levels are increased in maternal circulation and in the cord blood of IUGR fetuses compared to appropriate-for-gestational-age fetuses and their mothers, indicating a possible genetic predisposition for higher adipose tissue secretion of leptin.29 Simi-larly, maternal predisposition to reduced secretion of visfatin might contribute to increased birth weight and vice versa.
The suggested positive association of maternal adipose tissue with fetal insulin secretion and weight should be corroborated by reports about fetuses of obese mothers developing insulin resistance in utero.30 Others have shown that increased maternal BMI from the first antenatal visit is associated with increased adiposity in early adulthood.31 Thus, it was suggested that maternal obesity compromises the
offspring’s metabolism starting at birth.30 In this line, the biological significance of the present study links maternal obesity to fetal metabolism and adipose tissue as elements of what has been termed ‘a vi-cious cycle’.34 In the latter, the increased maternal fat mass creates for the mother-fetus entity an abnormal metabolic environment that results in insulin resist-ance and hyperinsulinemia. These pathophysiological alterations affect the fetus epigenetically, resulting in neonatal obesity and hyperinsulinemia, thereby leading to childhood and adulthood obesity.32,33 In these series of events, the role of maternal genet-ics should be stressed. The worldwide epidemic of adolescent and adult obesity is not only the result of modern lifestyle but it may also be propagated and enhanced at a much earlier stage in life because of an abnormal metabolic milieu in utero.34
In conclusion, first trimester maternal BMI is a positive predictor of fetal insulin secretion and first trimester maternal visfatin levels are the best negative predictors of birth weight as compared with maternal leptin and adiponectin. Of note, first trimester ma-ternal visfatin and leptin levels stand as markers of pre-pregnancy adipose tissue.8 The present prospec-tive study did not include women with morbid obesity (BMI >35) as they represent a high risk group with potential complications. These women need close clinical follow-up and dietetic intervention during pregnancy. In this study, dietetic intervention was minimal. The women studied were mostly overweight or obese with a diverse pre-pregnancy BMI (between approx. 23-33 kg/m2) and an average weight gain of 15 kilograms. More studies with larger cohorts would strengthen the above results. Furthermore, these findings have further clinical implications for pregnancies complicated by maternal pre-pregnancy obesity and gestational diabetes. Based on this study, such abnormal metabolic environments could produce even more prominent clinical effects in the fetus regarding hyperinsulinemia and increased adipose tissue deposition, thus programming it for obesity and diabetes mellitus later in adulthood. As strate-gies to tackle obesity and the type 2 diabetes mellitus epidemic during adulthood have not proven to be entirely successful, there is an increased need for strategies to reduce the impact of maternal adipose tissue effect on fetal growth and insulin secretion in
metabolic environments of gestational diabetes and/ or pre-pregnancy obesity through close follow-up of maternal weight before and during pregnancy.
In summary, in this study an association emerges between first trimester maternal BMI, fetal insulin secretion and birth weight. Of note, birth weight has been associated with metabolic diseases during adult-hood. Additional studies are needed in women with morbid obesity and/or pregnancies complicated by gestational diabetes to extend our knowledge of the pre-pregnancy and first trimester maternal adipose tissue effect on the pathophysiology of fetal pancreatic and adipose tissue thus contributing to the limitation of secretion. Such studies could thereby contribute to a reduction in the inheritance of metabolic diseases by the next generation through timely intervention at the early stage of the prenatal period.
acknowledgMents
Funding was received from the Athens University
Medical School (to G.M.). The funding sources played
no role in the study design, in the collection, analysis, and interpretation of data, in the writing of the report or in the decision to submit the report for publication.
conFlIct oF Interest
The authors have nothing to declare.
reFerences
1. Jansson N, Nilsfelt A, Gellerstedt M, et al, 2009 Maternal hormones linking maternal body mass index and dietary intake to birth weight. Am J Clin Nutr 87: 1743-1749. 2. Gonzalez DA, Nazmi A, Victora CG, et al, 2010 Growth
from birth to adulthood and abdominal obesity in a Bra-zilian birth control. int J of obes 34: 195-202.
3. Long NM, George LA, Uthlaut AB, et al, 2010 Maternal obesity and increased nutrient intake before and during gestation in the ewe results in altered growth, adiposity, and glucose tolerance in adult offspring. J Anim sci 88: 3546-3553.
4. Valsamakis G, Kumar s, Creatsas G, et al, 2010 The effects of adipose tissue and adipocytokines in human pregnancy. Ann N Y Acad sci 1205: 76-81.
5. Hay WW Jr, 2006 recent observations on the regulation of fetal metabolism by glucose. J Physiol 572: 17-25. 6. Deierlein AL, siega-riz AM, Adair Ls, et al, 2011
Ef-fects of pre-pregnancy body mass index and gestational weight gain on infant anthropometric outcomes. J Pediatr
158: 221-226.
7. Frederick io, Williams MA, sales AE, et al, 2008 Pre-pregnancy body mass index, gestational weight gain, and other maternal characteristics in relation to infant birth weight. Matern Child Health J 12: 557-567.
8. Mastorakos G, Valsamakis G, Papatheodorou DC, et al, 2007 The role of adipocytokines in insulin resistance in normal pregnancy: Visfatin concentrations in early pregnancy predict insulin sensitivity. Clin Chem 53: 1477-1483.
9. Mazaki-Tovi s, romero r, Kusanovic JP, et al, 2009 Visfatin in human pregnancy: maternal gestational dia-betes vis-à-vis neonatal birthweight. J Perinat Med 37: 218-231.
10. Fereira AF, rezende JC, Vaikousi E, et al, 2011 Maternal serum visfatin at 11-13 weeks of gestation in gestational diabetes mellitus. Clin Chem 57: 609-613.
11. Fowden AL, 1995 Endocrine regulation of fetal growth. reprod Fertil Dev 7: 351-363.
12. Fowden AL, Hill DJ, 2001 intra-uterine programming of the endocrine pancreas. Brit Med Bull 60: 123-142. 13. Nicolini U, Hubinont C, santolaya J, et al, 1990 Effects
of fetal intravenous glucose challenge in normal and growth retarded fetuses. Horm Metab res 22: 426-430. 14. Tzschoppe A, struwe E, rascher W, et al, 2011 intrau-terine growth restriction is associated with increased leptin synthesis and binding capability in neonates. Clin Endocrinol 74: 459-466.
15. Valsamakis G, Kanaka-Gantenbein C, Malamitsi-Puchner A, et al, 2006 Causes of intrauterine growth restriction and the postnatal development of the metabolic syndrome. Ann N Y Acad sci. 1092: 138-147.
16. Metzger BE, Lowe LP, Dyer Ar, et al, 2008 The HAPo study Cooperative research Group: Hyperglycemia and adverse pregnancy outcomes. N Engl J Med 358: 1991-2002.
17. riskin-Mashiah s, Younes G, Damti A, Auslender r, 2009 First-Trimester Fasting Hyperglycemia and Ad-verse Pregnancy outcomes. Diab Care 32: 1639-1643. 18. Williams MA, Qiu C, Muy-rivera M, et al, 2004 Plas-ma adiponectin concentrations in early pregnancy and subsequent risk of gestational diabetes mellitus. J Clin Endocrinol Metab 89: 2306-2311.
19. Papastefanou i, samolis s, Panagopoulos P, et al, 2010. Correlation between maternal first trimester plasma leptin levels and birth weight among normotensive and preeclamptic women. J Mat Fetal Neonat Med 23: 1435-1443.
20. Matthews Dr, Hosker JP, rudenski As, et al, 1985 Homeostasis model assessment: insulin resistance and β-cell function from fasting plasma glucose and insulin concentrations in man. Diabetol 28: 412-419.
21. Cohen o, Epstein Gs, Weisz B, Homko CJ, sivan E, 2006 Longitudinal assessment of insulin sensitivity in pregnancy. Validation of the homeostasis model
22. stumvoll M, Mitrakou A, Pimenta W, et al, 2000 Use of the oral glucose tolerance test to assess insulin release and insulin sensitivity. Diab Care 23: 295-301.
23. sPss. sPss for windows 10.0.5 ed Chicago inc 1999 24. Wang J, Wang sH, shang LX, et al, 2010 relationship
of adiponectin and resistin levels in umbilical and ma-ternal serum with fetal macrosomia. J obstet Gynaecol res 36: 533-537.
25. ortega-senovilla H, schaefer-Graf U, Meitzner K, et al, 2011 Gestational diabetes mellitus causes changes in the concentrations of adipocyte fatty acid-binding protein and other adipocytokines in cord blood. Diab Care 34: 2061-2066.
26. Verhaeghe J, VanBree r, Van Herck E, et al, 1993. C-peptide, insulin-like growth factors i and ii, and insulin-like growth factor binding protein-1 in umbilical cord serum: correlations with birth weight. Am J obstet Gynecol 169: 89-97.
27. regnault N, Botton J, Heude B, et al, 2011 EDEM Mother-Child Cohort study Group. Higher cord C-peptide concentrations are associated with slower growth rate in the 1st year of life in girls but not in boys. Diabetes
60: 2152-2159.
28. Delvaux T, Buekens P, Thoumsin H, Dramaix M, Col-lette J, 2003 Cord c-peptide and insulin like growth
factor-i, birth weight, and placenta weight among North African and Belgian neonates. Am J obstet Gynecol 189: 1779-1784.
29. Kyriakakou M, Malamitsi-Puchner A, Militsi H, et al, 2008 Leptin and adiponectin concentrations in intrauter-ine growth restricted and appropriate for gestational age fetuses, neonates, and their mothers. Eur J Endocrinol 158: 343-348.
30. Catalano PM, Presley L, Minium J, et al, 2009 Fetuses of obese mothers develop insulin resistance in utero. Diab Care 32: 1076-1080.
31. reynolds rM, osmond C, Phillips DiW, Godfrey KM, 2010 Maternal BMi, parity and pregnancy weight gain: influences on offspring adiposity in young adulthood. J Clin Endocrinol Metab 95: 5365-5369.
32. Houde ii, Hivert MF, Bouchard L, et al, 2013 Fetal epigenetic programming of adipocytokines. Adipocyte 2: 41-46.
33. Li CC, Young PE, Maloney CA, et al, 2013 Maternal obesity and diabetes induces latent metabolic defects and widespread epigenetic changes in isogenic mice. Epigenetics 8: 602-611.
34. Catalano PM, 2003 Editorial: obesity and pregnancy - The propagation of a viscous cycle? J Clin Endocrinol Metab 88: 3505-3506.