Research
Paper
Colon is located at the end of the digestive tract, between the cecum and the rectum. The key technique for producing successful oral colon-targeted drug delivery systems (OCTDDS) is to choose the right matrix carrier, which is capable of protecting the drug substance in the upper gastrointestinal tract (GIT), and directly carry the drug substance to the human ileocecum, to exert its therapeutic effect in the colon. OCTDDS can protect drug substances from being exposed to hydrolysis, and enzymatic degradation in the small intestine, due to the less intensity of digestive enzymes and less proteolytic activity of the colon mucosa, which produces higher systemic bioavailability of the drug. OCTDDS can also increase local concentration while reducing the systemic side effects that may occur due to the absorption of the drug in the upper GIT. Colon targeting can be achieved by using several approaches such as pH-triggered or time-dependent drug delivery systems by using natural and synthetic polymers[1].
Natural polysaccharide biodegradable polymers such as chitosan has been the focus of a large number of research studies, which reported its potential uses
in biomedical research applications. Chitosan is an abundant hetero-polysaccharide, which is structurally similar to glycosaminoglycans (main component of the bone extracellular matrix) and could be produced through deacetylation of chitin. It is mainly characterized for biocompatibility, biodegradability, cytocompatibility, and hemocompatibility[2]. Chitosan depolymerisation in the acidic medium is the main disadvantage for using it in formulating controlled drug delivery system. Chemical crosslinking of chitosan with glutaraldehyde could form a pH-sensitive matrix that swells and releases a drug through its porous structure[3].
Eudragit RS100is a synthetic methacrylate copolymer, which consists of 4.5 to 6.8 % of quaternary ammonium groups. These groups make the surface of the polymer positive leading to interactions with specifi c cells
Application of Central Composite Design for the
Development and Evaluation of Chitosan-based
Colon-targeted Microspheres and
in vitro
Characterization
M. A. KASSEM, K. M. EL SHABOURY AND A. I. MOHAMED*
Department of Pharmaceutics and Industrial Pharmacy, Faculty of Pharmacy, Cairo University, Egypt
Kassem et al.: Central Composite Design-based Development of Colon-targeted Drug Delivery Systems
pH-sensitive colon-targeted microspheres loaded with dicyclomine hydrochloride were prepared using both emulsion crosslinking and solvent evaporation techniques to retard the release of dicyclomine in the upper gastrointestinal tract and to deliver it directly to colon. Several factors were used to evaluate the product,
Eudragit RS100-coated chitosan-based microspheres, such as production yield, entrapment effi ciency, and
cumulative drug release. Three factorial central composite design was applied to examine the effect of the independent variables, concentrations of chitosan, Tween 80, and Eudragit RS100 on the physicochemical
properties of the microspheres. Design-Expert software was used to design fi fteen formulations during this
study and the quadratic model was best fi tted with the response data. In vitro dissolution studies proved that
the release of dicyclomine hydrochloride from the microspheres fi ts Korsmeyer-Peppas model. F1, F10 and
F12 exhibited best patterns of dicyclomine hydrochloride release with negligible drug release at pH 1.2, and maximum drug release at pH 7.4, indicating their ability to target the colon.
Key words: Colon-targeted drug delivery systems, dicyclomine HCl, chitosan, Eudragit RS100, response surface methodology, central composite design
*Address for correspondence
E-mail: [email protected]
This is an open access article distributed under the terms of the Creative Commons Attribution-NonCommercial-ShareAlike 3.0 License, which allows others to remix, tweak, and build upon the work non-commercially, as long as the author is credited and the new creations are licensed under the identical terms
conducted to identify the optimal formulation with the desired dicyclomine HCl release profi le.
MATERIALS AND METHODS
Dicyclomine HCl was received as a gift sample from Luna Co. for Industrial Investments, Egypt. Chitosan (medium molecular weight from crab shells) was purchased from Roth Company, Germany. Eudragit RS100 was received as a gift sample from Evonik Industries AG, Germany. Glutaraldehyde solution (50 %) was purchased from El Nasr Pharmaceutical Chemicals Co., Egypt. All chemical reagents used during analysis were of analytical grade.
Preparation of the controlled release chitosan microspheres:
Dicyclomine HCl-loaded polymeric microspheres were prepared by using chitosan as the matrix polymer, while using the single emulsion crosslinking technique. First, chitosan polymeric solutions were prepared with different concentrations by dissolving the accurately weighted chitosan powder in 100 ml of acetic acid (1 % v/v) on a magnetic stirrer. Second, 1 g of dicyclomine HCl was dispersed gradually in the chitosan aqueous solutions. Third, Tween 80 was used as a surfactant with varying ratios and it was homogenized in 150 ml of liquid paraffi n. Finally, the emulsion that was formed by addition of the aqueous phase (dicyclomine HCl dissolved in chitosan solution) to the oil phase (liquid paraffi n treated with Tween 80) while stirring at 800 rpm on a Branson mechanical stirrer model 250 for 3 h. Crosslinking was achieved by the addition of 0.5 ml of glutaraldehyde solution to the emulsion in the middle of the experiment. The produced dicyclomine HCl-loaded chitosan microspheres were collected by direct fi ltration, washed with petroleum ether and dried overnight at 40° in a hot air oven[9-12].
Eudragit RS100 coating of dicyclomine-loaded chitosan microspheres for pH-triggered delivery: To formulate colon-targeted dicyclomine HCl-loaded microspheres, the previously prepared microspheres had to be protected with pH-sensitive polymer, Eudragit RS100 using the solvent evaporation technique. Eudragit RS solution was prepared by dissolving varying concentration of the synthetic polymer in 10 ml of ethyl alcohol. The microspheres were then transferred to a solution of Eudragit RS100 in ethanol and emulsifi cation was achieved using 100 ml of liquid paraffi n treated with Tween 80 (1 %) on targeted tissues. This property increases the
cellular uptake of the drug-polymer conjugates to allow controlled and prolonged delivery of any drug substances to specifi c target sites[4]. Eudragit RS100 was chosen as a coating material because it can withstand the acidic pH 1-3.5 in lower GIT and pH 5-6.5 in the small intestine but at alkaline pH 7 in the colon it starts to dissolve[5].
Model drug candidates to be formulated as colon-targeted drug delivery systems include drug substances that treat colonic disorders such as ulcerative colitis, Crohn’s syndrome, and irritable bowel syndrome. Dicyclomine HCl, (1,1'-bicyclohexyl)-1-carboxylic acid, 2-(diethylamino)ethyl ester hydrochloride, is an antispasmodic and anticholinergic drug, classifi ed as BCS class I drug whose peak plasma concentration is attained after 60-90 min of its oral administration. It acts by relaxing the spasms and cramps of smooth muscles of GIT, biliary tract, and ureter. It is widely used for the treatment of intestinal hypermotility and irritable bowel syndrome. The conventional dose of dicyclomine HCl for treating irritable bowel syndrome is 20 mg, 4 times daily, which might cause several adverse effects such as constipation, nausea, dizziness and tachyarrhythmia. The formulation of dicyclomine HCl as a colon-targeted drug delivery system would be benefi cial due mainly to reduction of these systemic side effects, increasing patient compliance through reducing the frequency of dosing, and improving the therapeutic outcomes of dicyclomine HCl by localizing its effects at the colon, which is the main site of action for treating irritable bowel syndrome symptoms[6].
Response surface methodology (RSM) combined with central composite design (CCD) were used for designing this study, which can be defi ned as the collection of both statistical techniques and mathematical methods for building an experimental design model based on
fi tted polynomial equations with experimental data[7]. Different computer software applications are available for the processing of the experimental data such as Design-Expert® and Minitab, which can help in reducing the time needed for the experiment design, while increasing the accuracy of the design analysis[8]. The purpose of this study was to apply CCD for the formulation of polymeric microspheres prepared using crosslinked chitosan with or without Eudragit RS100 coating for colonic delivery of dicyclomine HCl.
as the oil phase while stirring at 800 rpm for 2 h using a Branson mechanical stirrer to allow the evaporation of ethanol. The Eudragit RS100-coated dicyclomine HCl microspheres were obtained by direct fi ltration, washed by using petroleum ether and dried at 40° for 4 h in a hot air oven[9,13,14].
Experimental design model for the preparation of the polymeric microspheres:
The design of experiment by means of RSM depends on using the quantitative experimental data from previous screening experiments, in order to fi t the Eqns. of regression models and to establish the optimum operating conditions. The optimization experiment of dicyclomine HCl microspheres were designed as a three-factorial CCD by using Design-Expert® software (version 11; Stat-Ease, USA). The three selected independent variables were; chitosan concentration (%), Tween 80 concentration (ml), and Eudragit RS100 concentration (mg), while the recorded responses were; particle size (μm), drug loading (%), entrapment effi ciency (%), and the percent released dicyclomine HCl at different pH values (%). A total of 15 experiments as described were performed. CCD made it possible to distinguish the effect of each variable on the selected response based on the following formula: Y = b0+b1 X1+b2 X2+b3 X3+b12 X1 X2+b23 X2 X3+b13 X1 X3+b11 X12+b
22 X22+b33 X32, where (Y) is the selected measured response, (bo) is the intercept, (b1-b33) are the linear regression coeffi cients of the factors, (X1, X2, X3) are the independent variables, (X1X2, X2X3, X1X3) are the interactions effects, and (X12, X
22, X32) are the quadratic effects[15,16].
Morphology of chitosan-based microspheres using scanning electron microscopy (SEM):
For examining the morphology of the produced microspheres, their external surfaces were photographed by scanning electron microscope. The microspheres samples were fi xed on an aluminium stub and then they were coated with gold by using gold sputter module under high vacuum. The samples were scanned by using Jeol scanning electron microscope, and the selected magnifi cation was appropriate for describing the morphology details of the microspheres[17-19].
Evaluation of the prepared microspheres, drug loading, entrapment effi ciency and yield:
Percent yield was determined by comparing the weight of the formed dicyclomine HCl microspheres against the total initial weight of the used polymer
and dicyclomine HCl according to the following Eqn., % yield = (mass of dicyclomine HCl microspheres formed)/(total initial mass of dicyclomine HCl and the polymer)×100.
For determining loading capacity of prepared microspheres, 50 mg of microspheres were accurately weighed and crushed inside a glass mortar and dispersed in 100 ml of hydrochloric acid buffer (pH 1.2). The mixture was then stored in a thermostatic water bath in which it was shaken for 12 h at 37±0.5° at 50 strokes/min speed. The resulting suspension was
fi ltered through 0.45 μm Millipore syringe fi lter and diluted appropriately. The concentration of dicyclomine HCl in each batch was estimated on a Shimadzu UV spectrophotometer at 213.90 nm with reference to the previously constructed calibration curves. Drug loading and entrapment effi ciency were calculated using the Eqns., drug loading (%) = (mass of dicyclomine HCl in microspheres)/(total mass of microspheres)×100; entrapment effi ciency (%) = (actual drug loading)/ (theoretical drug loading)×100.
Statistical analysis:
Statistical analysis of the data obtained was carried out using Design-Expert software. Independent variable effects were calculated by using analysis of variance (ANOVA). Variables having (p-value<0.05) were considered as statistically signifi cant[9,20-22].
In vitro release from the prepared formulations:
In vitro drug release studies on the chitosan-based
was added to the medium immediately after sample collection. The UV spectroscopy measurements for each sample was performed in triplicate[23-26].
Dicyclomine HCl release kinetics from chitosan microspheres:
In vitro dicyclomine HCl release data were analysed by using DDsolver (an Add-in software for Microsoft Excel 2016), and they were fi tted with different kinetic models: zero order model, fi rst order model, Higuchi model, and Korsemeyer-Peppas model. R2, the coeffi cient of determination, was used for the purpose of fi tting of dissolution profi le with mathematical Eqns.[27-29].
RESULTS AND DISSCUSION
The surface morphology of the prepared coated and uncoated microspheres was examined and imaged by SEM are illustrated in fi g. 1. The particle size of the microspheres ranged from 133.17 to 482.82 μm. The diameter of the microspheres increased with increasing the concentration of chitosan and with the application of the Eudragit Rs100 coating[9,14]. The CCD, a statistical approach for optimizing and planning experiments, was used. A total of 15 experiments were proposed for the three variables; chitosan concentration (X1), Tween 80 concentration (X2), and Eudragit RS100
concentration (X3). The recorded responses were particle size (Y1), drug loading (Y2), entrapment effi ciency (Y3), yield production (Y4), % dicyclomine HCl released at pH 1.2 (Y5), at pH 6.8 (Y6), at pH
A.
B.
30 KV 1400567 20 μm
30 KV 1400567 50 μm
Fig. 1: SEM images of dicyclomine HCl-loaded microspheres (A) F11, uncoated, (B) F12, coated
F. N.
Coded values of independent
variables
Actual values of independent
variables Response variables
X1 X2 X3 Chitosan Conc.
(%)
Tween 80 Conc.
(ml)
Eudragit RS100 Conc. (mg)
Y1
(μm) Y2 (%) Y3 (%) Y4 (%) Y5 (%) Y6 (%) Y7 (%) Y8 (%)
F1 0 0 1.414 1.5 0.5 250 421.77 26.92 74.05 83.03 0.35 20.62 61.79 82.76
F2 0 0 0 1.5 0.5 100 339.41 28.18 73.29 80.33 7.62 22.01 55.54 85.53
F3 1 1 -1 2 0.75 0 328.41 26.77 80.33 88.78 20.97 20.17 53.02 94.16
F4 1.414 0 0 2.25 0.5 100 465.47 24.85 83.25 91.67 2.15 18.05 60.79 80.99
F5 0 0 0 1.5 0.5 100 333.08 28.06 73.37 80.25 7.67 23.83 55.57 87.13
F6 0 0 0 1.5 0.5 100 340.24 28.21 73.48 79.9 7.49 21.98 55.43 84.9
F7 0 -1.414 0 1.5 0.15 100 310.19 27.65 72.03 76.75 8.9 26.95 53.25 89.1
F8 0 0 -1 1.5 0.5 0 256.23 29.02 72.55 76.43 24.75 21.34 49.09 95.18
F9 -1 0 0 1 0.5 100 201.02 36.56 69.47 74.35 11.7 28.9 57.36 97.88
F10 -1 1 1 1 0.75 200 299.07 32.65 71.85 77.46 0.85 25.41 64.49 90.75
F11 -1 -1 -1 1 0.25 0 133.17 34.9 69.8 75.05 26.23 27.9 44.87 98.91
F12 1 -1 1 2 0.25 200 482.82 24.84 79.5 87.05 0.65 20.75 60.19 81.59
F13 0 0 0 1.5 0.5 100 335.71 28.15 73.32 80.5 7.79 24.25 55.61 87.67
F14 0 1.414 0 1.5 0.85 100 372.31 28.94 75.25 85.39 6.57 20.36 55.96 82.89
F15 0 0 0 1.5 0.5 100 330.68 25.56 73.45 80.15 7.95 24.77 55.95 88.67
TABLE 1: EXPERIMENTAL DESIGN MATRIX OF THE CENTRAL COMPOSITE DESIGN WITH EXPERIMENTAL RESULTS
X1: coded value of chitosan concentration, X2: coded value of Tween 80 concentration, X3: coded value of Eudragit RS100 concentration.
Y1: particle size, Y2: drug loading, Y3: entrapment effi ciency, Y4: yield production, Y5: percent released of dicyclomine HCl at pH 1.2,
7.4 (Y7), and the cumulative percent released (Y8). The 15 runs with the investigated independent variables and the recorded responses are illustrated in Table 1. The Design-Expert® software provided the appropriate polynomial Eqns. involving the main factors after
fi tting the experimental data. Quadratic model was
fi tted with the response data. The effect of each of the tested factors (X1, X2, and X3) on each response was analysed, whereas the positive value indicated a synergistic effect on the response and the negative value suggested an antagonistic effect on it. The high values of the measured R-squared (R2>0.90) indicated the high correlation between observed and predicted experimental values in the resulting polynomial Eqns.[15,16,30].
For estimating the signifi cance of the fi tted model (quadratic model) for the effect of the tested factors (X1, X2, and X3) on the measured responses (Y1-Y8), ANOVA was conducted and the results were summarized in Table 2. Descriptive statistics were used to assess the results ad p-value was measured. All the resulted p-values resulting from the applied model were less than (0.05), indicating the signifi cance of quadratic model in predicting the measured responses (Y1-Y8) accurately.
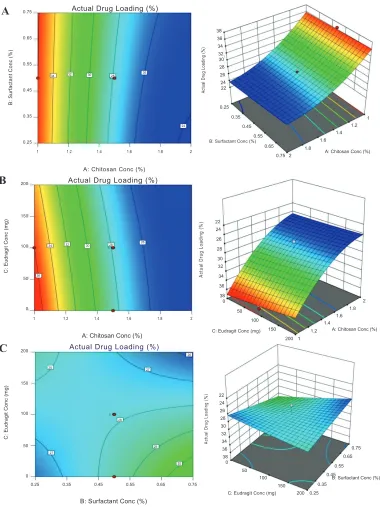
According to the CCD matrix produced from the Design-Expert software, a total of 15 experiments, containing 4 factorial points, 6 axial points, and 5 central points, were conducted. Figs. 2 to 4 depict the resulting three dimensional and contour response surface plots showing the effects of the tested factors (A, B and C) on the recorded responses, where the red colour represented the high values of the response and its values decrease by moving to blue colour on the plot[15].
Increasing the chitosan concentration and Eudragit RS100 concentration led to signifi cant increase in the particle size to reach 482.82 μm with 200 mg of Eudragit RS100 and using concentrated chitosan solution (2 %). There was a slight increase in the particle size with increasing the surfactant concentration, however the effect was still signifi cant on the resulting microspheres particle size. The 3 factors had a p-value less than 0.0001, which indicated statistical signifi cance[9,14,29]. Fig. 2 illustrates that the actual drug loading (Y2) decreased signifi cantly (p<0.0001) with increasing the concentration of chitosan, from 36 to 24 %. On the other hand, the actual drug loading increased with increasing the surfactant concentration, but it was not a signifi cant synergistic effect[10-12]. The effects on the entrapment effi ciency (Y3) are shown in fi g. 3. It was observed that the chitosan has a signifi cant positive effect on the entrapment effi ciency increasing it from (69 %) at the lowest chitosan concentration to (83 %) at the highest chitosan concentration. Tween 80 also had a mild positive effect on the entrapment effi ciency of the formulated microspheres[10-12]. The value of the % production yield (Y4) ranged from 74 to 91 % as shown in fi g. 4. The effects of increasing chitosan, Eudragit RS100 and Tween 80 concentrations were proven to be signifi cant on increasing the yield production of microspheres with a p-value less than 0.05[9-12].
Responses (Y5) to (Y8) were calculated using the in vitro
dissolution testing data of the prepared formulations. It is known that the release of dicyclomine HCl from the microspheres is related mainly to the matrix polymer and the coating materials. Microspheres coated with suffi cient concentration of Eudragit RS100 were protected and showed negligible release at the acidic
Factors P-Value
Y1 Y2 Y3 Y4 Y5 Y6 Y7 Y8
Chitosan Conc (X1) <0.0001 0.0006 <0.0001 <0.0001 <0.0001 0.0014 0.0646 0.0002
Tween 80 Conc (X2) <0.0001 0.4843 0.0033 0.0003 0.0021 0.0121 0.0016 0.0250
Eudragit RS100
Conc (X3)
<0.0001 0.3975 0.1527 0.0018 <0.0001 0.7101 <0.0001 0.0010
X1X2 0.0232 0.7440 0.6724 0.0069 0.0363 0.4620 0.0102 0.4672
X1X3 0.0007 0.5565 0.2201 0.0094 0.0827 0.1253 0.0002 0.0200
X2X3 0.0009 0.1244 0.5596 0.5080 0.0001 0.1222 0.1035 0.0087
X12 < 0.0001 0.0074 0.0008 0.0116 0.6332 0.1055 <0.0001 0.0061
X22 0.0838 0.9379 0.0855 0.0323 0.3852 0.5042 0.0024 0.4205
X32 0.0031 0.8407 0.4069 0.4664 <0.0001 0.0668 0.0004 0.0161
Model P value <0.0001 0.0069 <0.0001 <0.0001 <0.0001 0.0103 <0.0001 0.0011
Signifi cant Signifi cant Signifi cant Signifi cant Signifi cant Signifi cant Signifi cant Signifi cant
pH 1.2. It can be indicated that all the three tested variables had a signifi cant negative effect on Y5 having a p value ≤0.0021[9,12-14,29].
The release of dicyclomine HCl at a higher pH 6.8 ranged from 18 to 28 %. The release at pH 6.8 was signifi cantly decreased with increasing the concentrations of both A (chitosan) B (Tween 80), which can be considered as signifi cant in model terms. However, the mild negative effect of Eudragit RS100 was not signifi cant[9,13,14,29].
From the generated quadratic model, Tween 80 and Eudragit RS100 had signifi cant positive effects on the release at pH 7.4 (p-value less than 0.001). The main cause for increasing the drug release at pH 7.4 is that the microspheres with high Eudragit RS100 concentration were protected in the acidic pH, so the actual release of dicyclomine HCl content from the microspheres started to happen in the alkaline pH indicating a positive relation between Eudragit RS100 and response (Y7).
Actual Drug Loading (%)
Actual Drug Loading (%)
Actual Drug Loading (%)
Actual Drug Loading (%)
Actual Drug Loading (%)
Actual Drug Loading (%)
A: Chitosan Conc (%)
B: Surfactant Conc (%)
B: Surfactant Conc (%)
B: Surfactant Conc (%)
0.75 0.65 0.55 0.45 0.35 0.25 200 150 100 50 0 200 150 100 50 0
C: Eudragit Conc (mg)
C: Eudragit Conc (mg)
1 1.2 1.4 1.6 1.8 2
1 1.2 1.4 1.6 1.8 2
0.25 0.35 0.45 0.55 0.65 0.75
34 34 28 28 29 30 27 27 26 36 32 32 30 30 28 28 26 26 24 38 36 34 32 30 28 26 24 22 22 24 26 28 30 32 34 36 38 0 22 24 26 28 30 32 34 36 38 0 0.25 0.35 0.45 0.55 0.65 0.75 2 1.8 1.6 1.4 1.2 1
A: Chitosan Conc (%)
A: Chitosan Conc (%)
A: Chitosan Conc (%) C: Eudragit Conc (mg)
C: Eudragit Conc (mg)
B: Surfactant Conc (%) 50 50 100 100 150 150 200 200 0.25 0.35 0.45 0.55 0.65 0.75 1 1.2 1.4 1.6 1.8 2 A B C
Fig. 2: 3D and contour response surface plots of the recorded response drug loading (Y2)
The effect of chitosan was not signifi cant on Y7 with p-value higher than 0.05[9,13,14,29].
The cumulative % released of dicyclomine HCl from the prepared formulation was calculated as response (Y8). Chitosan, Tween 80, and Eudragit RS100 had antagonistic signifi cant effect on the total amount of dicyclomine HCl released during the in vitro dissolution testing. The total release ranged from 81 to 98 %, while the p-value resulting from the ANOVA analysis of the 3 independent variables was less than 0.05 indicating their signifi cant negative effect[9-11,13,14,29].
The in vitro release study of the Eudragit
RS100-coated dicyclomine HCl-loaded chitosan microspheres were conducted in gastrointestinal simulating fl uids at pH 1.2, 6.8 and 7.4 using dialysis bag attached to the paddle of USP type II dissolution apparatus at a speed 100 rpm, and the temperature at 37±0.5° for 10 h. Release profiles of various formulations performed at different pH values are shown in (fi g. 5). Uncoated formulations (F3, F8, and F11) released dicyclomine HCl from chitosan microspheres in the acidic medium pH 1.2 simulating the gastric fl uid,
Entrapment efficiency (%)
Entrapment efficiency (%)
Entrapment efficiency (%)
Entrapment ef
ficiency (%)
Entrapment ef
ficiency (%)
Entrapment ef
ficiency (%)
B: Surfactant Conc (%)
B: Surfactant
B: Surfactant Co
B: Surfactant Conc (%)
C: Eudragit
C: Eudragit Conc (mg) 0.75
0.65
0.55
0.45
0.35
0.25
200
150
100
50
0
200
150
100
50
0
C: Eudragit Conc (mg)
C: Eudragit Conc (mg)
65
70
75
80
85
65
70
75
80
85
85
80
75
70
65
0.25 0.35 0.45 0.55 0.65 0.75
0
50
100 150 200
A: Chitosan Conc (%)
A: Chitosan Conc (%)
A: Chitosan Conc (%)
A: Chitosan Conc (%)
A
B
C
1 1.2 1.4 1.6 1.8 2
1 1.2 1.4 1.6 1.8 2
1 1.2
1.4 1.6
1.8 2
1
200 150
100 50
0 0.25 0.35
0.45 0.55
0.65 0.75
1.2 1.4
1.6 1.8
2
0.25 0.35 0.45 0.55 0.65 0.75
70 70
72 74 76 78
80
72 74
74 75
73
76 78 80
Fig. 3: 3D and contour response surface plots of the recorded response entrapment effi ciency (Y3)
from 20.97-26.23 % in the fi rst 2 h depending on the chitosan concentration, which indicated the burst of the chitosan microspheres, because of the chitosan solubilisation in the acidic medium and the release of dicyclomine HCl. These patterns of drug release in acidic pH cannot be used for colon-targeted delivery systems, so it was necessary to use a coating polymer with a pH-dependent solubility with the threshold pH around 7.0±0.2 such as Eudragit RS100[9-11].
Coating the chitosan microspheres with 100 mg of Eudragit RS100 in formulations (F2, F4, F5, F6, F7, F9, F13, F14, and F15) helped in protecting the microspheres in the acidic medium and the release
of dicyclomine HCl in pH 1.2 ranged from 2.15-8.9 % relying on the used chitosan concentration. Increasing the concentration of Eudragit RS100 to 200 mg reduced the release of dicyclomine HCl in acidic medium to a negligible amount from 0.65-0.85 % in formulations (F12 and F10). Excess amounts of Eudragit RS100 (250 mg) in coating microspheres in formula (F1) resulted in a minor release around 0.35 % of dicyclomine HCl[9,13,14,29].
In the following 2 h in the dissolution study at pH 6.8, the Eudragit RS100 coating started to dissolve exposing the chitosan microspheres to the medium, which resulted in the bursting of chitosan matrix and
Fig. 4: 3D and contour response surface plots of the recorded response yield production (Y4)
respectively, while the total dicyclomine HCl release at pH 7.4 was 61.79, 64.49 and 60.19 %, respectively. So, these formulations could be chosen for further study as these exhibited minimum drug release in the acidic medium and maximum drug release in the alkaline medium which simulated the colon[9,13,14,29].
The in vitro dissolution data of the prepared
microspheres was applied to different release models, zero-order model, fi rst-order model, Higuchi model, Korsmeyer-Peppas model, and Hixson-Crowell model. Release kinetics results are summarized in Table 3. In accordance to value of R2 (determination coeffi cient) and Akaike Information Criterion (AIC) which is an estimator of the relative quality of statistical models for a given set of data, the in vitro release of dicyclomine HCl from the prepared microspheres can be fi tted with the Korsmeyer-Peppas model (highest R2 value with the least AIC). That model allows for the determination of the mode of kinetics by the the calculation of (n) value which is the diffusion exponent[28,31,32].
Formulations (F3, F8, F9, and F11) had a diffusion exponent in the range of (0.5<n<1) indicating an anomalous non-Fickian transport, which is a hybrid of both diffusion and erosion-controlled release mechanisms. While the remaining formulations had a diffusion exponent value (n>1) indicating a super case II transport, that means the drug release is controlled by polymer swelling and erosion[27,31,32]. Cross-linked chitosan microspheres with a single layer of Eudragit RS100 were found to be an effective approach for targeting the colon by using emulsifi cation-solvent evaporation techniques. RSM based on CCD was applied to assess and optimize the effects of different concentrations of chitosan, Tween 80, and Eudragit RS100 on the following responses, particle size, drug loading, entrapment effi ciency, and the percent released of dicyclomine HCl at different pH values. A pH-dependent delivery of dicyclomine HCl was achieved by using cross-linked chitosan coated with Eudragit RS100. Optimal formulations F1, F10, and F12 had an insignifi cant dicyclomine HCl release in acidic dissolution medium simulating the stomach, with a signifi cant release in alkaline dissolution medium simulating the colon; making it a promising technique for controlling irritable bowel syndrome symptoms. Further research can be conducted for in vivo evaluation of the optimal formulations on experimental animals.
the release of dicyclomine HCl. The release profi le of the prepared formulations ranged from 18.05-28.90 %. The dissolution continued in the alkaline medium for another 5 h at pH 7.4, where the release of dicyclomine HCl ranged from 44.87-64.49 %[9,13,14,29].
Release profi le of dicyclomine HCl from microspheres could be summarized as, fi rst, the Eudragit RS100 coating started to dissolve at pH 7.0±0.2. Second, the surrounding dissolution medium penetrated the exposed chitosan matrix. Finally, the chitosan microspheres did swell and released dicyclomine HCl from the chitosan gel that formed. Increasing the concentration of the core polymer led to increasing the distance the drug must pass to be released, in other words a reduction of the rate and extent of drug release. As well as increasing the thickness of the coating polymer would require a longer period for the coat to be dissolved, which means slower rate and reduced extent of drug release[9,29]. The criteria used for choosing the optimal formulations was based on the fact that colon targeting required minimal drug release in the stomach with maximum drug release in the colon. Formulations that fulfi lled these criteria were F1, F10 and F12, with dicyclomine HCl release at pH 1.2, was 0.35, 0.85 and 0.65 %,
0 20 40 60 80 100
0 2 4 6 8 10
C
u
m
u
lative
%
D
rug
Rel
ea
se
Time (h)
pH 1.2 pH 6.8 pH 7.4
0 20 40 60 80 100
0 2 4 6 8 10
Cum
u
lative
%
D
rug
Rel
ea
se
Time (h)
pH 1.2 pH 6.8 pH 7.4
0 20 40 60 80 100
0 2 4 6 8 10
Cum
u
lative
%
D
rug
Rel
ea
se
Time (h)
pH 1.2 pH 6.8 pH 7.4
Fig. 5: In vitro release profi les of formulations F1 to F15
F1; F2;
p
F3; F4; F5; F6;
F7; F8; F9; F10; F11;
Con
fl
ict of interest:
The authors declared that they have no confl ict of interest.
REFERENCES
1. Lawrie G, Keen I, Drew B, Chandler-temple A, Rintoul L, Fredericks P, et al. Interactions between Alginate and Chitosan Biopolymers Characterized Using FTIR and XPS. Biomacromolecules 2007;8(8):2533-41.
2. Kumar S, Koh J. Physiochemical, Optical and Biological Activity of Chitosan-Chromone Derivative for Biomedical Applications. Int J Mol Sci 2012;13(5):6102-16.
3. Rajput S, Agrawal P, Pathak A, Shrivasatava N, Baghel SS, Singh BR. A review on microspheres: methods of preparation and evaluation. World J Pharm Pharm Sci 2012;1(1):422-38. 4. Cao J, Wu Y, Jin Y, Yilihan P, Huang W. Response surface
methodology approach for optimization of the removal of chromium(VI) by NH2-MCM-41. J Taiwan Inst Chem Eng 2014;45(3):860-8.
5. Bezerra MA, Santelli RE, Oliveira EP, Villar LS, Escaleira LA. Response surface methodology (RSM) as a tool for optimization in analytical chemistry. Talanta 2008;76(5):965-77.
6. Ahmed N, Hasan I, Saifuddin M, Ahmed Chowdhury J, Selim Reza M. Formulation and Optimization of Carbamazepine Microspheres by 2 Factor 2 Level Central Composite Design. Bangladesh Pharm J 2016;19(2):152-60.
7. Rakić T, Kasagić-Vujanović I, Jovanović M, Jančić-Stojanović
B, Ivanović D. Comparison of Full Factorial Design, Central Composite Design, and Box-Behnken Design in Chromatographic Method Development for the Determination
of Fluconazole and Its Impurities. Anal Lett 2014;47(8):1334-47.
8. Zhou YZ, Alany RG, Chuang V, Wen J. Optimization of PLGA nanoparticles formulation containing L-DOPA by applying the central composite design. Drug Dev Ind Pharm 2013;39(2):321-30.
9. Asadollahzadeh M, Tavakoli H, Torab-Mostaedi M, Hosseini G, Hemmati A. Response surface methodology based on central composite design as a chemometric tool for optimization of dispersive-solidification liquid-liquid microextraction for speciation of inorganic arsenic in environmental water samples. Talanta 2014;123:25-31.
10. Deshmukh RK, Naik JB. The impact of preparation parameters on sustained release aceclofenac microspheres: A design of experiments. Adv Powder Technol 2015;26(1):244-52. 11. Bhaskar R, Bhaskar R, Sagar MK, Saini V. Multivariate
chemometric assisted analysis of metformin hydrochloride, gliclazide and pioglitazone hydrochloride in bulk drug and dosage forms. Adv Pharm Bull 2013;3(1):79-84.
12. Ranade VV, Hollinger MA. Drug delivery system. 2nd ed. Boca Raton, Florida, USA: CRC Press LLC; 2004.
13. Philip AK, Philip B. Colon Targeted Drug Delivery Systems: A Review on Primary and Novel Approaches. Oman Med J 2010 2010;25(2):79-87.
14. Chourasia MK, Jain SK. Pharmaceutical approaches to colon targeted drug delivery systems. J Pharm Pharm Sci 2003;6(1):33-66.
15. Bhatt P, Khatri N, Kumar M, Baradia D, Misra A. Microbeads mediated oral plasmid DNA delivery using polymethacrylate vectors: an effectual groundwork for colorectal cancer. Drug Deliv 2015;22(6):849-61.
16. Santoki RD, Road A, Road K. Development and validation of analytical methods for simultaneous estimation of diclofenac
Model F1 F2 F3 F4 F5 F6 F7 F8 F9 F10 F11 F12 F13 F14 F15
Zero R2 0.945 0.981 0.9746 0.952 0.9802 0.981 0.9768 0.9445 0.9653 0.9518 0.919 0.9491 0.9808 0.9787 0.981
Order k0 7.853 8.696 10.26 7.525 8.937 8.634 9.53 10.822 10.701 8.918 11.447 7.756 9.031 8.294 9.155
AIC 78.77 66.00 70.503 76.025 67.496 66.223 70.428 80.356 77.61 79.888 85.951 77.543 67.27 67.021 67.405
First R2 0.867 0.922 0.9648 0.875 0.9203 0.9228 0.9246 0.9711 0.9159 0.8665 0.9708 0.8727 0.921 0.916 0.9203
Order k1 0.11 0.132 0.183 0.104 0.138 0.131 0.154 0.208 0.19 0.133 0.237 0.108 0.14 0.122 0.143
AIC 89.46 83.20 74.416 87.51 84.213 83.061 84.564 72.521 88.214 92.118 73.694 88.548 84.259 83.475 84.611
Higuchi
R2 0.729 0.815 0.92 0.7343 0.8162 0.8137 0.8345 0.9403 0.8492 0.7496 0.9464 0.7339 0.8195 0.7988 0.8217
kH 19.63 22.16 26.816 18.822 22.791 21.998 24.441 28.495 27.604 22.418 30.268 19.402 23.05 21.053 23.379
AIC 98.00 93.65 84.257 96.557 94.243 93.632 93.997 81.225 95.226 99.664 81.008 97.395 94.179 93.963 94.273
Hixson-Crowell
R2 0.895 0.948 0.9849 0.9019 0.9468 0.948 0.9516 0.9879 0.9473 0.8984 0.9883 0.9001 0.9478 0.9414 0.9476
kHC 0.033 0.039 0.051 0.031 0.04 0.038 0.045 0.057 0.054 0.039 0.065 0.033 0.041 0.036 0.042
AIC 86.62 78.39 64.228 84.596 79.363 78.315 79.236 62.11 82.607 88.846 62.768 85.643 79.297 79.168 79.572
Kors- meyer-Peppas
R2 0.981 0.985 0.9911 0.991 0.9837 0.9855 0.977 0.9854 0.9664 0.9737 0.9793 0.9836 0.9837 0.9878 0.983
kKP 3.493 6.865 14.932 3.144 7.228 6.772 9.053 18.627 11.897 4.904 21.445 3.493 7.455 5.768 7.667
n 1.399 1.117 0.813 1.429 1.105 1.12 1.026 0.728 0.947 1.295 0.686 1.393 1.095 1.18 1.088
AIC 68.14 64.90 59.868 57.878 67.185 65.031 70.308 66.298 76.224 74.628 71.564 65.956 67.022 62.322 67.034
TABLE 3 RELEASE KINETIC ANALYSES OF THE PREPARED FORMULATIONS (F1-F15)
K0, K1, KH, KHC, KKP are respectively: Zero order, First order, Higuchi, Hixon-Crowell, and Krosmeyer-Peppas kinetic constants. n is the
sodium and dicyclomine hydrochloride in injection dosage. World J Pharm Pharm Sci 2017;6(7):1737-51.
17. Wu GY. Pocket Handbook of GI Pharmaco- therapeutics. Switzerland: Springer International Publishing; 2016. 18. Joshi K, Dhole S, Doltode A. Formulation and in vitro
evaluation of sustained release matrix tablet of dicyclomine hydrochloride by using hydrophilic polymers. Int J Pharm Sci Res 2014;5(4):1331-8.
19. Sareen R, Jain N, Rajkumari A, Dhar KL. pH triggered delivery of curcumin from Eudragit-coated chitosan microspheres for inflammatory bowel disease: Characterization and pharmacodynamic evaluation. Drug Deliv 2016;23(1):55-62. 20. Ofokansi KC, Kenechukwu FC, Isah AB, Okigbo EL.
Formulation and evaluation of glutaraldehyde-crosslinked chitosan microparticles for the delivery of ibuprofen. Trop J Pharm Res 2013;12(1):19-25.
21. Kotsaeng N, Karnchanajindanun J, Baimark Y. Chitosan microparticles prepared by the simple emulsifi cation-diffusion method. Part Sci Technol 2010;28(4):369-78.
22. Kulkarni VH, Kulkarni PV, Keshavayya J. Glutaraldehyde-crosslinked chitosan beads for controlled release of diclofenac sodium. J Appl Polym Sci 2007;103(1):211-7.
23. Moustafi ne RI, Margulis EB, Sibgatullina LF, Kemenova VA, Van den Mooter G. Comparative evaluation of interpolyelectrolyte complexes of chitosan with Eudragit®L100 and Eudragit®L100-55 as potential carriers for oral controlled drug delivery. Eur J Pharm Biopharm 2008;70(1):215-25.
24. Thakral NK, Ray AR, Majumdar DK. Eudragit S-100 entrapped chitosan microspheres of valdecoxib for colon cancer. J Mater Sci Mater Med 2010;21(9):2691-9.
25. Zhang C, Tang J, Liu D, Li X, Cheng L, Tang X. Design and evaluation of an innovative fl oating and bioadhesive multiparticulate drug delivery system based on hollow structure. Int J Pharm 2016;503(1-2):41-55.
26. Hao J, Fang X, Zhou Y, Wang J, Guo F, Li F, et al. Development and optimization of solid lipid nanoparticle formulation for ophthalmic delivery of chloramphenicol using a Box-Behnken design. Int J Nanomedicine 2011;6:683-92.
27. Francis L, Meng D, Knowles J, Keshavarz T, Boccaccini AR, Roy I. Controlled delivery of gentamicin using poly(3-hydroxybutyrate) microspheres. Int J Mol Sci 2011;12(7):4294-314.
28. Asfaram A, Ghaedi M, Agarwal S, Tyagi I, Gupta VK. Removal of basic dye Auramine-O by ZnS:Cu nanoparticles loaded on activated carbon: optimization of parameters using response surface methodology with central composite design. RSC Adv 2015;5(24):18438-50.
29. Sarrai AE, Hanini S, Merzouk NK, Tassalit D, Szabó T, Hernádi K, et al. Using central composite experimental design to optimize the degradation of Tylosin from aqueous solution by Photo-Fenton reaction. Materials (Basel) 2016;9(6):428. 30. Hooda A, Nanda A, Jain M, Kumar V, Rathee P. Optimization
and evaluation of gastroretentive ranitidine HCl microspheres by using design expert software. Int J Biol Macromol 2012;51(5):691-700.
31. Pal M, Bajaj A, Kadu P. Microspheres of Glycopyrronium Bromide for Sustained Drug Delivery. World J Pharm Pharm Sci 2014;3(9):764-83.