Emperor International Journal of Finance and Management Research [EIJFMR] Page 178
A STUDY ON CUSTOMER’S
EXPECTATIONS IN HOTEL INDUSTRY
IN TRICHY DISTRICTS
R.SANKAR
PH.D Full Time Research Scholar P. G & Research Department of Commerce
National College (Autonomous) Tiruchirappalli - 620 001.
Dr. M. SHARMILA Assistant Professor
P. G & Research Department of Commerce National College (Autonomous)
Tiruchirappalli - 620 001.
ABSTRACT
The aim of this paper was to examine the Customer’s expectations in the hotel industry in
Trichy district. Descriptive statistics and regression analysis were employed for the test of the hypotheses. The findings revealed that customer expectation has a significant effect on both customer satisfaction and customer loyalty. In addition, clear statistic revealed that increased services such as babysitter and internet reserving system are highly expected by customers. Collected data was analyzed according to the objectives of the present research and result of the statistical analysis to compile the result. Hence it is suggested that customers should proactively monitor hotels’ preferences with regard to the service
charges; delivering of doorsteps of the food promptly and issue of new taste and recipe due to loss of modernization in order to retain their customers.
Keywords: Hotel Industry, Expectations,
Preferences, etc.
I. INTRODUCTION
Customer expectations refer to the perceived value or benefits that the customers seek when purchasing a good or availing a service. They are the result of the ‘learning’ process and can be formed very quickly because even first impressions matter a lot. Once established, these expectations can hold significant influence in decision-making processes and can be very hard to change. For example, branded items are often associated with quality. Most
customers expect that well-known brands are higher quality and thus evaluate their performance higher than that of an identical product from a little-known brand. This is one of the reasons new brands find it difficult to make it to the consideration set even when they have superior products than current brands.
Model of Customer Expectation
Emperor International Journal of Finance and Management Research [EIJFMR] Page 179 became popular and the impact of the industrial
revolution in England spread widely that led to the change from social or governmental travel to business travel. The need for quick and clean service all the time emerged.
Importance of the Study
The significance of customer satisfaction has become a vital business issue as organizations have realized the major outcomes achieve when providing effective customer service. For hospitality and tourism, satisfaction has always been important. With regard to other industries, different researchers and institutions have undertaken a lot of scientific and detailed studies. But, Indian hotel business with reference to customer satisfaction has not been able to draw the attention of researcher to any noticeable extent. Hence, this study examines and analyses the level of customer’s expectations with reference to "Trichy district hotels". The study would help firms to employ the outcome to develop appropriate customer expectations policies.
II. REVIEW OF LITERATURE
This study attempts to review different kinds of literature on customer satisfaction and expectations with reference to the hotel industry and presents various studies made regarding the issues related to the hotel industry and customer satisfaction.
Gabbie et al (1996) have conducted a study to investigate the relationship between quality service and customer expectations in the Northern Ireland hotel industry. The study was conducted in two hotels in Northern Ireland using the SERVQUAL. More specifically the paper tries to identify the service
gaps. Two hotels with different management were selected for the research study. Questions for data collection were based on the service quality gap model.
Peter Jones and Andrew Lockwood (2002) provide a simple definition for the hotel as, "an operation that provides accommodation and ancillary services to people away from home."
Paul S. Goldner (2006) defines, "...a customer is any organization or individual with which you have done business over the past twelve months".
Grigoroudis, E and Siskos, Y (2009) provide definition for 'customer' upon two approaches: With reference to loyalty, "A customer is the person that assesses the quality of the offered products and services" and on process-oriented approach, "the customer is the person or group that receives the work output" (p.9).
III. OBJECTIVES OF THE STUDY
The study intends to practice the following specific objectives with reference to "Trichy district hotel industry".
1. To identify the level of customer expectations towards various hotel attributes in Trichy district hotels.
2. To seek out the customers' order of preference towards the various hotel attributes.
3. To understand customers' gourmet and suggest various strategies to be implemented in order to make customer-oriented surfeit.
IV. RESEARCH METHODOLOGY
Emperor International Journal of Finance and Management Research [EIJFMR] Page 180 V. LIMITATIONS OF THE STUDY
• The study was confined only to the selected 10 different branches of Hotels in and around Trichy district.
• Hence the customer sample does not reflect all segments of the population.
• Since the study was conducted during a particular period, the outcome may not reflect the dynamic nature of the level of satisfaction and the sample size was also limited.
• All the findings and observations made in this study are purely based on the respondents' opinion and therefore there is a possibility of personal bias.
VI. DATA ANALYSIS AND INTERPRETATION
This chapter deals with the analysis and interpretation. Primary data collection was done through a scientifically prepared questionnaire to measure the tangible and intangible attributes of the hotel industry. Totally 300 questionnaires were distributed to the customers who had visited the target group of hotel branches at least five times, based on the recommendation from the Supervisor and Waiters of the Hotels.
Table Showing The Respondents (Age)
Frequency Percent Valid Percent Cumulative Percent Valid up to 20 years 61 20.4 20.4 20.4
21-30 years 98 32.8 32.8 53.2
31-40 years 67 22.4 22.4 75.6
41-50 years 32 10.4 10.4 86.0
above 50 years 42 14.0 14.0 100.0
Total 300 100.0 100.0
Educational Qualification
Frequency Percent Valid Percent Cumulative Percent
Valid School level 110 36.8 36.8 36.8
Graduation 125 41.5 41.5 78.3
Post Graduation 65 21.7 21.7 100.0
Total 300 100.0 100.0
Respondents’ Gender
Frequency Percent Valid Percent Cumulative Percent Valid
Male 192 64.2 64.2 64.2
Female 108 35.8 35.8 100.0
Total 300 100.0 100.0
Occupation
Frequency Percent Valid Percent Cumulative Percent
Valid Salaried 94 31.1 31.1 31.1
Self-employed 133 44.5 44.5 75.6
Professional 37 12.4 12.4 88.0
Student 36 12.0 12.0 100.0
Emperor International Journal of Finance and Management Research [EIJFMR] Page 181 Family Size
Frequency Percent Valid Percent Cumulative Percent Valid Up to 3 members 102 34.1 34.1 34.1
3-6 members 131 43.5 43.5 77.6
7 - 9 members 39 13.0 13.0 90.6
Above 9 members 28 9.4 9.4 100.0
Total 300 100.0 100.0
Reasons For Outside Food
Frequency Percent Valid Percent Cumulative Percent
Valid
Tasty food 82 27.4 27.4 27.4
Bachelor 111 37.1 37.1 64.5
Student 107 35.5 35.5 100.0
Total 300 100.0 100.0
Annual Income
Frequency Percent Valid Percent Cumulative Percent
Valid Below 1 lakh 59 19.7 19.7 19.7
1 - 2 lakhs 72 24.1 24.1 43.8
2 - 3 lakhs 51 16.7 16.7 60.5
Above 3 lakhs 66 22.1 22.1 82.6
Not Responded 52 17.4 17.4 100.0
Total 300 100.0 100.0
Respondents' Favourite Breakfast Items
Frequency Percent Valid Percent Cumulative Percent Valid Idli sambar 147 49.2 49.2 49.2
Dosa 45 14.7 14.7 63.9
Roast 60 20.1 20.1 83.9
Puri 14 4.7 4.7 88.6
Pongal 34 11.4 11.4 100.0
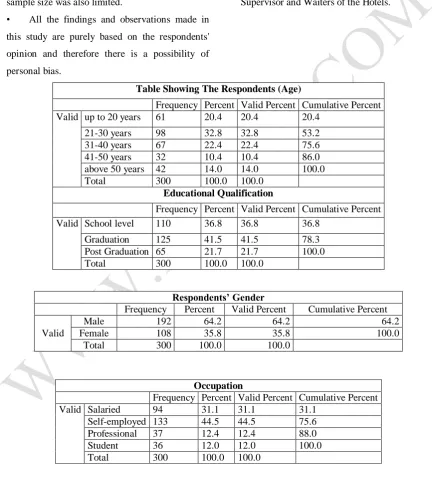
Emperor International Journal of Finance and Management Research [EIJFMR] Page 182 • From the above table it is clear that 36.8% of
the employees fall under the age, group of 21 - 30 years, followed by 22.9% of employees under the age group of 31 - 40 years, and the very next 20 % were under the age group of up to 20 years, 41-50 years age group were only 10%, and finally 10.4% of respondents were above 50 years of Age.
• The above analysis shows the respondent's educational qualification; where 43.9 % of the respondents had completed their graduation, 33.9% had completed their schooling and the remaining 22.1% have done their post-graduation
• From the above analysis, it is inferred that 64.6% of the respondents were male and the remaining 35.4% were female.
• The above table shows the respondents' occupation. 36.8% of the respondents were self-employed, 33.2% were salaried and the remaining 15% of respondents were under the category professional and students.
• The above table interprets the respondent's family size, where 39.6% of the respondents have a family size of 3-6 members, 38.6% were in the category of up to 3 members, 13.6% of respondents' family size lies between 7-9 members and the remaining 8.2% of the respondents' family size was above 9 members.
• The above table analyses the reason to have food in hotels .55% of the respondents had food in the hotel because of its taste, 17.9% being bachelors, 17.5% through parties and other functions and 9.6% of the students used to have food in the hotel.
• The above table illustrates the distribution of annual income of the respondents. 46.8% of the
respondents' annual income was less than 1 lakh, 20 % of the respondents' annual income lies between 2-3 lakhs, 11.8 of the respondents' annual income was more than 3 lakhs, 9.3 % of the respondents' annual income was between 1 to 2 lakhs, and the remaining 12.1% of the respondents' did not disclose their the annual income.
• The above table displays the respondents' favorite Breakfast item. 44.3% of the respondents have opined that Idli Sambar as their favorite breakfast item, more or less the same number of respondents i.e. 19.6% and 19.3% like Roast and Dosa, followed by 11.4% prefer Pongal and 5.4% of the respondents favorite were Puri. South Indians' most preferred and favorite breakfast item was Idli, Dosa, and Vada.
• The above table depicts the frequency of food intake in hotels. 27.1% of the respondents take food in hotels twice a week, 20.4% of the respondents had once in a week and another 20.4% had once in a month and 17.9% of the respondents used to take rarely in the hotels and the least 14.3%of the respondent's frequency was once in two weeks.
Reasons for Outside Food
Frequency Percent Valid Percent Cumulative Percent
Valid Tasty food 82 27.4 27.4 27.4
Bachelor 111 37.1 37.1 64.5
Student 107 35.5 35.5 100.0
Emperor International Journal of Finance and Management Research [EIJFMR] Page 183 Chi-Square Analysis
Hypothesis:
The relationship between Gender and Age group of the visited the hotel.
Relationship Between Gender and Age
Total
up to 20 years 21-30 years 31-40 years 41-50 years above 50 years
Male Count 40 58 47 18 29 192
Expected Count 39.2 62.9 43.0 19.9 28.0 193.0
Female Count 21 40 20 13 13 107
Expected Count 21.8 35.1 24.0 11.1 15.0 107.0
Total Count 62 98 67 31 42 300
Expected Count 61.0 98.0 67.0 31.0 42.0 300.0
Chi-Square Tests
Value of Asymp. Sig. (2-sided) Pearson Chi-Square 3.092a 4 .542
Likelihood Ratio 3.100 4 .541 Linear-by-Linear Association .254 1 .615
N of Valid Cases 300
Since Sig (p) <0.05, the level of significance, the N. hypothesis is rejected. From the table, it is understood that majority of the Male respondents used to visit the hotels and 31-40 age group people are preferably hotels. This is due to the paucity of the time to have food at home, dual income and the need of the day.
Annual Income and Visit The Hotel
Total Once Twice More than Twice
Below 1 lakh Count 17 24 18 59
Expected Count 18.0 20.1 20.9 59.0
1 - 2 lakhs Count 23 20 29 73
Expected Count 21.9 24.6 25.5 72.0
2 - 3 lakhs Count 16 16 18 50
Expected Count 15.2 17.1 17.7 50.0
Above 3 lakhs Count 18 23 25 66
Expected Count 20.1 22.5 23.4 66.0
Not Responded
Count 17 19 16 52
Expected Count 15.8 17.7 18.4 52.0
Total Count 91 102 107 300
Expected Count 91.0 102.0 107.0 300.0
Chi-Square Tests
Value df Asymp. Sig. (2-sided)
Pearson Chi-Square 3.522a 8 .897
Likelihood Ratio 3.554 8 .895
Fisher's Exact Test 3.585
Linear-by-Linear Association .010 1 .919
Emperor International Journal of Finance and Management Research [EIJFMR] Page 184 Since Sig (p) <0.05, the level of significance, the
N. hypothesis is accepted. So, there is no relationship between income and Number of visit the hotel.
VII. FINDINGS AND SUGGESTIONS AND
CONCLUSION
Findings
The above table it is clear that 36.8% of the employees fall under the age, group of 21 - 30 years, followed by 22.9% of employees under the age group of 31 - 40 years, and the very next 20 % were under the age group of up to 20 years, 41-50 years age group were only 10%, and finally 10.4% of respondents were above 50 years of Age. The above analysis shows the
respondent's educational qualification; where 43.9 % of the respondents had completed their graduation, 33.9% had completed their schooling and the remaining 22.1% have done their post-graduation The above analysis it is inferred that
64.6% of the respondents were male and the remaining 35.4% were female.
The above table shows the respondents' occupation. 36.8% of the respondents were self-employed, 33.2% were salaried and the remaining 15% of respondents were under the category professional and students. The above table interprets the
respondent's family size, where 39.6% of the respondents have a family size of 3-6 members, 38.6% were in the category of up to 3 members, 13.6% of respondents' family size lies between 7-9 members and the remaining 8.2% of the respondents' family size was above 9 members.
The above table analyses the reason to have food in hotels .55% of the respondents had food in the hotel because of its taste,
17.9% being bachelors, 17.5% through parties and other functions and 9.6% of the students used to have food in the hotel. The above table illustrates the
distribution of annual income of the respondents. 46.8% of the respondents' annual income was less than 1 lakh, 20 % of the respondents' annual income lies between 2-3 lakhs, 11.8 of the respondents' annual income was more than 3 lakhs, 9.3 % of the respondents' annual income was between 1 to 2 lakhs, and the remaining 12.1% of the respondents' did not disclose their the annual income.
The above table displays the respondents' favorite Breakfast item. 44.3% of the respondents have opined that Idli Sambar as their favorite breakfast item, more or less the same number of respondents i.e. 19.6% and 19.3% like Roast and Dosa, followed by 11.4% prefer Pongal and 5.4% of the respondents favorite were Puri. South Indians' most preferred and favorite breakfast item was Idli, Dosa, and Vada.
The above table depicts the frequency of food intake in hotels. 27.1% of the respondents take food in hotels twice a week, 20.4% of the respondents had once in a week and another 20.4% had once in a month and 17.9% of the respondents used to take rarely in the hotels and the least 14.3%of the respondent's frequency was once in two weeks.
Emperor International Journal of Finance and Management Research [EIJFMR] Page 185 of the time to have food at home, dual
income and the need of the day. Since Sig (p) <0.05, the level of
significance, the N. hypothesis is accepted. So, there is no relationship between income and Number of visit the hotel.
Suggestions
The hotel may consider giving menu cards to all the customers, as most of the branches had the practice to list their items only through the waiters.
Regarding the parking facilities, the hotel has to increase the parking space, as it was not adequate in some of its hotels. Interior decoration can be improved in
all the hotels, which in turn will create a good atmosphere for the customer.
Customers always need privacy in every situation, especially during dining times. The partition can be made for the convenience of the consumers.
The hotel administration may opt for comparatively less price structure. This would attract more regular customers. An increased satisfied customer means more profit.
The restaurant can introduce the self-service system so that the consumers can be benefited by saving their waiting time. Door delivery system can be introduced
to bring in more customers, who may not be able to come to the hotels for some reasons. Conclusion
The purpose of this study is to identify the needs and perceptions of hotel customers based on their level of their satisfaction with reference to Trichy district hotels. Various differences and similarities in the satisfaction level of the respondent customers have been discussed. Overall, the data analysis showed that the results were reliable and indicated a
good measure of sampling adequacy. Whether the hotel attributes exceeded customers' expectations is the key to success for hoteliers. Effective marketing strategies need to be planned by hoteliers to attract and retain more and more customers, by satisfying them during their first visit and then developing customer loyalty for all Trichy district hotels.
VIII. REFERENCE
1) Adee Athiyaman (2004). "Antecedents and Consequences of Student Satisfaction with University Services: A Longitudinal Analysis", Academy of Marketing Studies Journal, January. 2) Adopted from Yc Youjic "A Critical Review
of Customer Satisfaction" in Zothumt, Valore "Review of Marketing 1989, Chicago, American Marketing Association, 1991. Cited in Terry G. Vavra (1997). Improving Your Measurement of Customer Satisfaction: A Guide to Creating, Conducting, Analyzing, and Reporting Customer Satisfaction Measurement Programs. Americal Society for Quality. p.46.
3) Agarwal, H.S. (2007) "Achievements and Possibilities of Tourism in India: Important Facts, Pratiogita Darpan, Nov. 2007, SVol.2: 17.p. 4) Akan, P. (1995). dimensions of Service
Quality: A Study in Istanbul. Managing Service Quality. 5(6): pp. 39-43.