1806
Modified Ant Colony Optimization With Modified
Adaptive Network Based Fuzzy Inference System
For Thyroid Nodule Classification
S.Sathyapriya DR.D.Anitha
Abstract : Computer Aided Diagnosis (CAD) has a significant part to play in the classification of thyroid nodules. CAD is employed in the form of as an objective relevance; this is owing to the high degree subjectivity in the physician’s understanding of ultrasound images, which can result in difference in results of scanning. The earlier system developed an Improved Local Binary Pattern (ILBP) with Anarchic Society Optimization (ASO) for classifying the nodules present in thyroid images. But, it does not render the satisfying performance with regard to segmentation and classification accuracy. In order to deal with this issue, the proposed system developed a Modified Ant Colony Optimization (MACO) with Modified Adaptive Network-based Fuzzy Inference System (MANFIS) scheme for thyroid nodule classification. In this novel research work, thyroid images are considered in the form of input and then preprocessed with the help of Dynamically Weighted Median Filter (DWMF). Using Region based Active Contour scheme, the segmentation of the preprocessed image is done. The Improved Local Binary Pattern (ILBP), Grey Level Co-occurrence Matrix (GLCM) and Gray-Level Run Length Matrix (GLRLM) features are then extracted from the image that is preprocessed. Subsequently, the optimal features are chosen with the help of Modified Ant Colony Optimization (MACO) algorithm. Finally, the Modified Adaptive Network-based Fuzzy Inference System (MANFIS) algorithm is utilized for classifying the cystic nodule from solid nodule. The experimental analysis is carried out in the mat lab simulation environment for both pre-available and proposed research techniques. The results obtained from experiments reveal that the novel system attains better performance in comparison with available system in terms of accuracy, precision, recall and f-measure.
Keywords: Improved Local Binary Pattern (ILBP), Modified Ant Colony Optimization (MACO), segmentation —————————— ——————————
1.
INTRODUCTION
Thyroid nodules are present to a huge extent while thyroid cancer is a considerably uncommon entity. When thyroid nodules are found on clinical examination carried out in 3-7% of the adult population, the presence of detectable nodules on Ultrasound (US) ranges between 30% to 70% and increases with age. Thyroid gland generates chemicals (hormones), which aid the body in controlling the metabolism. Thyroid hormone is commonly generated as a response to another hormone, which is discharged by the pituitary gland [1-3]. There are four important kinds of thyroid disease -hyperthyroidism (overmuch thyroid hormone), hypothyroidism (very less thyroid hormone), and benign (noncancerous) thyroid disease and thyroid cancer (malignant). The signs and symptoms of hypothyroidism are tiredness, mental blur and forgetfulness, feeling extremely cold, constipation, dry skin, fluid retention, unspecific aches and stiffness felt in muscles and joints, extreme or extended menstrual bleeding (menorrhagia), and depression. Hyperthyroidism is intimated by several signs and symptoms. People affected with mild hyperthyroidism or those who are more than 70 years of age generally do not experience any symptoms. The general symptoms of hyperthyroidism are extreme sweating, intolerance to heat, increased bowel movements, tremor (generally a slight shake), nervousness; agitation, high speed heart rate, weight loss, fatigue, reduce concentration, and uneven and very less menstrual flow. Thyroid nodules are solid or cystic lumps produced in the thyroid gland and may result due to several thyroid ailments. There has been an increase in the rate of detection of thyroid nodules and carcinomas due to
the improved ultrasonography (US) usage. Ultrasonography refers to the imaging modality of preference for thyroid nodules. High-resolution machines can help in detecting nodules as tiny as 1–3 mm having a sensitivity of nearly 95%. Every patient who are surmised of being affected with a thyroid nodule or nodular goiter or in whom a nodule has been co-incidentally detected on another imaging modality needs to be advised for ultrasonography of the neck and thyroid. It is suggested that the thyroid nodule does not get imaged in an isolated environment on ultrasonography.Few researches for the classification of the thyroid nodule have been performed, among others in [4], and are helpful in histogram equalization for preprocessing. GLCM for feature extraction and classifier uses support vector machine (SVM), k-nearest neighbor (KNN), and Bayesian techniques. It is noticed that the SVM provides much superior accuracy compared to KNN and Bayesian. In [5], the extraction Discrete Wavelet Transform (DWT) and GLCM were extracted, and for the classification process, KNN, Probabilistic Neural Network (PNN), and Decision Tree (DT) were used. The result indicate that the fusion of DWT and texture features in the KNN classifier provides excellent performance.
2.
LITERATURE SURVEY
Nugroho et al (2017) developed a novel approach for the classification of thyroid nodule on the basis of shape feature analysis into two categories, i.e. round to oval and irregular classes. The novel system begins with the filtering of image in the form of the preprocessing step. Then the process of segmentation is carried out with the help of active contour and morphological operation. Shape analysis is conducted through the extraction of seven geometric features and 14 moment features. Then these features are chosen with the help of Correlation based Feature Selection (CFS). The features selected are classified employing linear Support Vector Machine (SVM). The level of accuracy, ————————————————
S.Sathya Priya Research Scholar, Sri Ramakrishna College of Arts and Science forwomen ,India, PH-9944398724. E-mail:[email protected]
1807 sensitivity and specificity achieved as seen from the
classification results is 91.52%, 91.80% and 91.35% correspondingly [6] .Ma et al (2017) developed a Convolutional Neural Networks (CNN) for ultrasound image-based thyroid nodule automated segmentation. The CNN-based technique expresses a thyroid nodule segmentation problem to be a task of patch classification, in which the association among patches is neglected. Especially, the CNN utilized image patches obtained from images of common thyroids and thyroid nodules in the form of inputs and then the segmentation probability generated is mapped as outputs. A multi-view mechanism is helpful in improving the CNN based model’s performance. The CNN can be desirable for tackling with the inherently noisy behavior of ultrasound images owing to its good noise resilience [7]. Nugroho et al (2019) formulated a computer aided diagnosis for thyroid cancer system on the basis of intrinsic and extrinsic features. First, a pre-processing step was used for eliminating the label and reducing the speckle noise by using the adaptive median filter, which is then followed by bilateral filter. Next, active contour and morphology operation were used for the segmentation of the nodules. In the later step, the extraction of geometric and texture features were done. In the last step, multilayer perceptron was utilized for classifying the internal features when support vector machine was utilized for the classification of external features. The result shows that the system is robust in satisfying the demands of radiologist similar to a second opinion towards objective diagnosis of the thyroid cancer [8].Gireeshaet al. (2014) employ edanisotropic diffusion filter for preprocessing, watershed algorithm for nodule region the segmentation, Artificial Neural Network (ANN) and Support Vector Machine (SVM) classifier are used for the classification purposes and Grey Level Co-occurrence Matrix (GLCM) for feature extraction respectively. The results of classification are assessed in terms of accuracy, sensitivity and specificity. It is found that SVM classifier renders superior result compared to ANN in differentiating benign and malignant nodules [9].Keramidaset al. (2010) explained about the different feature extraction techniques used for thyroid ultrasound image analysis including gray level histogram, Muzzolinis features, co-occurrence matrix, radon transform and local binary patterns and classifier employing Support Vector Machine (SVM) and k-Nearest Neighbour (KNN). The SVM is a popular classifier, and found to be efficient with regard to pattern recognition, machine learning and data mining, however, the average distance between the hyperplane and the nearest training points on both the sides has to be maximum [10].
3.
PROPOSED METHODOLOGY
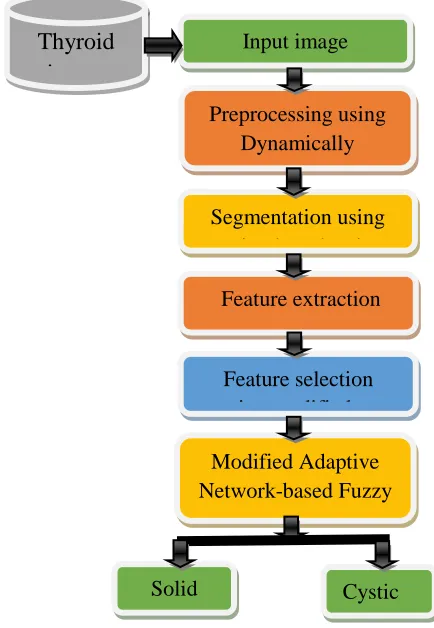
In this proposed technical work, thyroid images are taken as input. The preprocessing of the input image is done with Dynamically Weighted Median Filter (DWMF). The preprocessed image is then segmented employing Localized Region based Active Contour. The Improved Local Binary Pattern (ILBP), Grey Level Co-occurrence Matrix (GLCM) and Gray-Level Run Length Matrix (GLRLM) features are obtained from the segmented image .Afterwards, the optimal features are chosen with Modified Ant Colony Optimization (MACO) algorithm. At last, Modified Adaptive Network-based Fuzzy Inference
System (MANFIS) algorithm is utilized for classifying the cystic nodule from the solid nodule.
Figure 1: Flow diagram of the proposed work
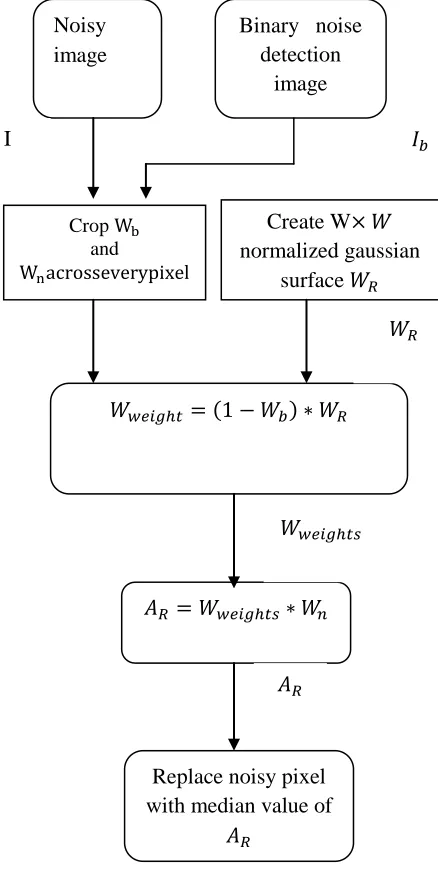
3.1 Preprocessing using Dynamically Weighted Median Filter (DWMF)
In this proposed technical work, Dynamically Weighted Median Filter (DWMF) is utilized for preprocessing purposes. A novel Dynamically Weighted Median Filter helps in assigning the weightage of 0 to those positions in a W*W window, which are identified to be noisy pixels. In this proposed research work, weightage window can be automatically selected with 2D Gaussian surface. Gaussian function exhibits the characteristic that its intensity improves as it shifts towards the center.Binary image I b and noisy
image I form the input of DWMF. Binary image I b can be
acquired with the help ofthe novel noise detection algorithm. W*W patches, W n and W b , are chosen across
every identified noisy pixels in both noisy image I and binary image I b correspondingly. Weight age
window Wweightsof size W*W is computed, but those
locations of W weights are eliminated where W b contain the
values of 1 (if all entries of W b have the value of
1, W weights is substituted by W b to bypass exception). In this
way, the identified noisy pixels acquires the weightage of 0. The weights assigned in W weights are moved if gaps are
found in W weights owing to elimination of elements at noisy
positions. For instance, when all elements, which correlate with the weightage of 4 are identified as noisy pixels, the weightage of 4 is eliminated from Wweights. Therefore, there
is a shift of 2 that is noticed while jumping from weightage of 3 to 5 in W weights. In such condition, the weights get
Thyroid
image
dataset
Input image
Preprocessing using
Dynamically
Weighted Median
Filter
Segmentation using
region based active
contour
Feature extraction
Feature selection
using modifiedant
co
lonyoptimization
algorithm
Modified Adaptive
Network-based Fuzzy
Inference
System based
classification
Solid
nodule
1808 reassigned to reduce redundancy. The modified window is
added, and weight of one among the highest weights is increased if the sum is even. The criteria of odd sum is enforced with the aim ofnot having the averaged value of two pixels to be a result of DWMF. The last weightage window W R is generated once the odd sum of repeated
window is confirmed to generate the repetition array AR .The median value of AR replaces the noisy pixel.
Figure 2: Flowchart of the proposed DWMF
3.2 SEGMENTATION USING REGION BASED ACTIVE
CONTOUR
Region based active contour scheme is used for segmenting the preprocessed image. The proposed system developed a segmentation technique that depends on region based active contour model employing level set scheme so that it can be helpful in the classification of thyroid nodule. In this system, the initial mask is first formed. The initial curve can be located in any place on the images and the interior contours are automatically identified. This technique comprises of two important steps, which include curve evolution and segmentation process.
Curve evolution is carried out with the help of level set technique and active contour model performs the segmentation of the region. The advantages of this algorithm can be summarized in: automatically identifying the interior contours, reliable with regard to noise, capability of detecting and representing the complicated boundaries.
Figure 3: Flow diagram of the region based segmentation method
Level Set Formulation of the Model
Figure 4. Curve C propagating in normal direction
Where, C = the boundary of an evolving curve. In the level set technique, C is denoted by the zero level set of a Lipschitz function φ: , such that
{
*( ) ( ) + ( ) * ( ) ( ) + ( ) ̅ (( ) ( )
} (1)
Step-1.Actual image is represented by and the maximum iteration is defined manually.
Step-2. Generate the initial mask at the region of interest. Step-3. Initialize from the initial mask at n=0.
Step-4. Compute ( ) by (1) if ∫ H ( (x,y)) dxdy > 0 (i.e. if the curve depicts a nonempty interior in ) and ( ) by (2) if ∫ (1-H( (x,y))) dxdy) > 0 (i.e. if the curve depicts a nonempty exterior in )
( ) ∫ ∫ ( ( ( )) )( ) ( ( )) (2)
Noisy
image
Binary noise
detection
image
Crop and
Create W
normalized gaussian
surface
(
)
Replace noisy pixel
with median value of
I
Preprocessed thyroid images
Initial mask
1809 ( ) ∫ ∫ . ( ( ))/ ( )( ( ( ))) (3)
( ) { } Where,
= average intensity of internal to C = average intensity of external to C = input image
H (φ) = Heaviside function
Step-5. Solve the Partial Differential Equation (PDE) in φ by (3) to get by (4)
= ( ) 0 .
| |/ ( ) ( ) 1
(4)
( ) ( ) ( ) ⁄ ( ) Fix λ=1, v=0 and
Where,
δ (φ) = one dimensional Dirac measure , λ = positive parameters
ν = a force moving the curve towards the object. The iterative equation;
= ( ),h (
√
h . / ( h)
,h (
√
h . / ( h)
-v-( ( )) ( ( )) (5)
The finite differences are expressed as;
, ,
Step-6. Re-initialize φ to the signed distance function to the curve by (6),
( ) ( ) ( )
G= {√ ( ) ( ) ( ) √ ( ) ( ) ( ) }
(6)
a= ( ) ( )h ; b = ( ) ( )h ; c= ( ) ( )h ; d = ( ) ( )h ; Fix T=1 and h=1
Where,
a and c refer to backward differences b and d stand for the forward differences. h = the step space
T = time to reach final segmentation
Step-7. Check if the final contour gets to 100 iterations. If not, n = n+1 and repeat.
Region based active contour model for segmentation This model involves the minimization performed on energy based segmentation. The image is created by two regions of nearly piecewise-static intensities, of unique values and . The object to be identified is denoted by the region having the value . Let represent its boundary
by . Now internal to the object and external to the object. The energy fitting term of this model (7),
( ) ( )
∫ | ( ) | dxdy+∫ | ( ) | dxdy (7) Where, C refers to any other variable curve and the constants and are the averages of internal to C and external to C.
Relation with the Mumford-Shah Active Contour Model The Mumford-Shah functional for segmentation is expressed by (8).
( ) h( )
∫ | ( ) ( )| dxdy+∫ | ( )| dxdy (8)
Where, C , R
and λ stand for positive parameters. u = average inside C and outside C
The case of minimal partition problem can be devised and resolved with level set technique.
3.3 FEATURE EXTRACTION METHODS
3.3.1 IMPROVED LOCAL BINARY PATTERN(ILBP)
FOR FEATURE EXTRACTION
In this research work, Improved Local Binary Patterns (ILBP) is presented that is an efficient gray-scale texture descriptor. It exhibits invariance to changes in illumination as it is specified by the association of a pixel with its neighbors, and therefore can detect the microstructures present in an image with success. The fundamental LBP is expressed for a pixel as
( ) ∑ ( ( ) ( ))
(9)
Where I(p) represents the intensity of a pixel , and indicates the overall number of pixels present in the selected neighborhood of the center pixel . The function l is an ordinary thresholding function in the form given as
1810 technique but in the descriptor algorithm, and due to this, it
is known as ALBPS. In addition, a 1×1 matching approach is brought into use. This is a great benefit for attaining most valuable features from the thyroids image. The standard deviation is computedwiththe equation given below
√∑ ∑ ( ( ) ( ) ) ( ) (11)
Where N and M refer to the numbers of rows and columns correspondingly ( )stand for the centre pixel at position ( ) ( )indicates the neighborhood of ( )present along the orientation with the radius and indicates the oriented mean computedwith the below equation:
∑ ∑ | ( ) ( )| ( ) (12) The entropy is computed for the measurement of the most useful features from the thyroid images provided. It is expressed as
∑ ( ) ( ) (13) The difference between the overall image feature extraction information obtained from n occurrences and the Entropy equation is the only thing, which has varied in the place of n. Hence, entropy is the average amount of information present in a particular event. The thyroid image entropy in a neighborhood of one location ( ) ( ) ( ) where i I and b B refer to the respective locations in I, B, correspondingly. As B is generally noise, the entropy H(b) refers to the classical entropy. The local entropy present in the ideal image is a ridge entropy: it actually measures the torsion and continuity of ridges. Therefore, the ILBP is utilized for completely representing the image feature extraction information of the images.
∑ ( ) (14) Where refers to gray values of pixels uniformlylocated on circle and gc indicates the gray value of the center pixel by neighborhood size P and the radius R. It is increased by
The ILBP one matches the pairs of the respective minutiae in ridges and valleys, thereby also getting their exact location. Minutiae matched in this manner are known to be validated. Invalid minutiae are then reanalyzed during a third recursion: they can either be removed considering spurious minutiae or provide some helpful additional information.
3.3.2 Grey Level Co-occurrence Matrix (GLCM) based feature extraction
In this research work, GLCM is recommended to be the efficient texture analysis method. The GLCM feature extraction technique is a matrix, which defines the occurrence frequency of two pixels with particular intensities at distance d and angular orientation θ within an image. GLCM feature extraction is performed in 4 angular directions, each one of them has a 45° interval; 0°, 45°, 90°, 135° [11-13]. Features extraction using texture analysis is carried out considering grayscale features of an object, which distinguish it from other objects. These extracted features are contrast, correlation, energy, and homogeneity.
1.
ContrastContrast features are helpful in the computation of the level of difference in grayness present in an image. The more the difference of grayness, the greater will be the contrast. Contradictorily, the less subtle is the difference of grayness
between two pixels, the less will be the contrast. Contrast is expressed as:
Contrast = ∑ ∑ ( ) ( ) (15) Where p(i, j) refers to the GLCM matrix
2.
CorrelationCorrelation defines how much correlation does a reference pixel has with its neighbor over an image. Correlation is formulated as:
Correlation = ∑ ∑ ( ) ) (16)
Where and refer to the mean and standard deviations of probability matrix GLCM along row wise x and column wise y.
3.
EnergyEnergy value defines the level of distribution of grayness in an image. Energy is expressed as:
Energy = ∑ ∑ ( ) (17)
4.
Homogeneity
Homogeneity features compute the degree of homogeneity of grayness in an image. Homogeneity value is greater in images having nearly the same degree of grayness. Homogeneity is expressed as:
Homogeneity= ∑ ∑ ( ) | |) (18)
3.3.3. Gray-Level Run Length Matrix (GLRLM)
Run length refers to the number of neighborhood pixels having the grey intensity similar in a specific direction. Gray-level run-length matrix is a two-dimensional matrix where every element is the number of elements j having the intensity i, in the direction θ [14-15].Therefore, with a direction given, the run-length matrix provides the measure for every permitted gray level value how many times there are runs of, for instance, 2 sequential pixels having the same value. Next the same is performed for 3 sequential pixels, then for 4, 5 and this continues. It is to be noted that several different run-length matrices may be generated for a single image, one for every direction selected. The GLRLM depends on computing the number of gray level runs of different lengths. A gray level run is a set of sequential and collinear pixel points with the same gray level value. The length of the run refers to the number of pixel points present in the run. The gray level run length matrix is expressed as below.
( ) ( ( )| ) i , 0 (19)
Where Ng refers to the maximum gray level and Rmaxindicates the maximum length. Along with the 0º
1811 Gray-Level Run Length Matrix (GLRLM) Features
S.no Features Formulas
1 Short Run Emphasis
(SRE) ∑
( )
2
Long Run Emphasis
(LRE) ∑
( )
3
Grey Level
Non-uniformity ∑ (∑ ( ))
4
Run Length
Non-uniformity ∑ (∑ ( ))
5 Run Percentage (RP) ∑ ( )
6
Low Grey Level Run
Emphasis (LGRE) ∑ ( )
7
High Grey Level Run
Emphasis (HGRE) ∑
( )
p(i, j) refers to the pixel values with respect to the images with ―i‖ rows and ―j‖ columns.
3.4 FEATURE SELECTION USING MODIFIED ANT
COLONY OPTIMIZATION ALGORITHM
The ACO is a collaborative search approach,which resembles the foraging behavior of ant colonies of real life. The ant algorithms imitate the methods used by actual ants for quickly establishing the shortest route from the food source to their nest and vice versa. It is attained by using the foraging behavior of ants to get a shortest path from the food to the nest, using a trace known as pheromone, which allow them to communicate with one another [16-17]. As the pheromone will get evaporated over time, the path having a higher level of pheromone is the most probable shorter one towards the food source. By using path planning technique that depends on ant colony algorithm, ants choose the path as per the level of pheromone on it. The concentration of pheromone on a path is related to the number of the ants that pass through the path, making the algorithm easily trapped into local optimum. With the aim of preventing this disadvantage, an ant colony comprising of common ants and exploratory ants is used in this research work. For improving the convergence speed of the ant colony algorithm, the pheromone update strategy is enriched. Provided a feature set n, the FS problem is about getting an optimal feature s (s < n) when still retaining a desirably superior accuracy in the representation of the actual features. The process starts with the generation of a number of ants, k, which are then positioned in random on the graph. The pheromone value ( ) corresponding to each feature is assigned to a constant at first. Depending on the ant’s solution, which is a chosen feature, the solution quality in terms of classification accuracy is assessed through the classification of the training data sets employing the chosen features. Initialization Initialization of the ACO comprises of two parts: first one includes chiefly the initialization of the pheromone trail. Second one comprises of a number of ants, which are randomly located on the nodes selected arbitrarily. Then each one of the distributed ants will conduct a tour on the graph by building a path as per the node transition rule. Schedule Construction Stage After
every move, an ant leaves a pheromone trail over the connecting path to be gathered by other ants for computing the transition probabilities. Beginning from the initial session i, an explorer ant mselects probabilistically session j to find next with the help of the transition rule below:
( )=
{
[ ( )] 0( )1
∑ ( ) ,( )- 0( )1
( )
h }
(20)
Where,
(i,j) : the intensity measure of the pheromone left by
every ant on the path (i,j). The intensity varies during the run of the program.
: The intensity control parameter.
(i,j) : the visibility measure of the quality of the path
(i,j). This visibility, which stays consistent during the run of the program, is decided by (i,j)=1/l(ij), where l(ij)refers to the
cost of move from session i to the session j. : The visibility control parameter.
Sm (i): the set of sessions, which are remaining to
be found by ant m placed at session i.
Equation 20 indicates that the quality of the path (i,j) is in proportion to its shortness and to the highest concentration of pheromone deposited on it (i.e., the selection probability is in proportion to path quality).
During every iteration, the ants that have got the shortest path in the iteration are marked as elite ants.The path selection technique of ant colony algorithm is realized by common ants. The path selection expression of exploratory ants is given as below
(t) =
{
( ) ( )
∑ ( )
( )
h }
(21)
Where k allowed refers to the set of the remaining practical states of the k-th exploratory ant.
The indicates the local heuristic function of visibility. b). Pheromone Updating Stage
The pheromone update mechanism of elite ants is expressed as:
(t+n) =(1- ) (t) + (t)+ ( ) (22) Where,
: The trail evaporation parameter.
(i,j)(t)-pheromone increment of common ants that
are deposited on the path in the current iteration ( ) Indicates pheromone increment of elite ants thatis deposited on the path in the current iteration.
- Pheromone alpha factor of elite ant
The amount of deposited pheromone is the technique using which ants communicate for sharing information on good paths. In this condition, ants keep building the same schedule repetitively and the exploration of the search terminates.
Algorithm 1: Modified Ant Colony Optimization (MACO) algorithm
1. begin
2. Initialize Number of features
1812 5. Position every ant in a starting node
6. repeat
7. for each ant do
8. if (The ant is a common ant) 9. Chose next node by Eq
(t) = {
( ) ( )
∑
( ) ( )
h
}
10. end if
11. if (The ant is an exploratory ant) 12. Select next node by Eq
(t) =
{
( ) ( )
∑ ( ) ( )
h }
13. end if 14. end for
15. until (Every ant has constructed a solution ) 16. if (The ant is superior compared to an elite ant) 17. Replace the elite ant with the ant
18. end if
19. Update the pheromone by Eq
(t+n) =(1- ) (t) + (t)+ ( ) 20. Update best solution (optimal feature set) 21. end while
22. end
The optimal feature set is computed with Modified Ant Colony Optimization (MACO) Algorithm.
3.5 Modified Adaptive Network-based Fuzzy Inference System based classification
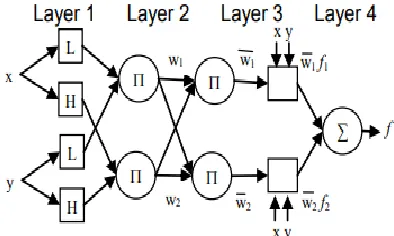
In this novel research work, the modified Adaptive Network-based Fuzzy Inference System is used for the classification of thyroid nodules. The chosen features are provided to the MANFIS in the form of an input. The ANFIS network is one kind of neural network and it is designed on the basis of the neuro fuzzy network [18]. Since the ANFIS is an adaptive network, the element of its nodes are adaptive in nature, which means with the purpose of their outputs based on the parameters fit in to these nodes. In this novel work, Modified ANFIS, premise parameters and output parameters are improved on the basis of the resultant error. The ANFIS representation is shown in Figure 5, and the node function in each layer is specified as follows.
Figure 5: Architecture of Adaptive Neuro Fuzzy Inference System (ANFIS)
Layer 1. This layer forms the layer of membership functions with the objective of using of adaptive nodes with node functions specified as below,
( ) (23)
Where 𝑥 and 𝑦 represent the input nodes, and 𝐵 represent the linguistic labels, (𝑥) and (𝑦) denote the membership functions that often take up a bell shape in terms of the highest and lowest values equal to 1 and 0, respectively
( )= (
)
(24)
Where , , and refer to the set of premise parameters.
Layer 2: This layer comprises of the nodes that are labeled that multiplies the incoming data and outputs the product. For example,
( ) ( ) (25)
The output represents the firing strength of a rule. The results of each node stand for the firing strength of a rule Layer 3: In this layer, the nodes marked get the ratio of the th rule’s firing power towards the sum of the notice strengths of the entire rules,
(26)
The results obtained of this layer are called as the normalized firing strengths.
Layer 4: This layer’s nodes are made adaptive using the subsequent node functions,
( ) (27 )
Where represents the output of layer 3, and * +stands for as the parameter set. These parameters are called as the resultant parameters.
Layer 5: This layer’s specific fixed node, which is labeled ∑, gets the final results to be the outline of the entire incoming data that is defined below,
∑ ∑ ∑ (28)
As a result, an adaptive network with the objective is functionally associated with a Sugeno first-order fuzzy inference system. The ANFIS optimization is done by varying the antecedent parameters and the consequent parameters resulting due to use of a specific objective function are reduced. With the aim of decreasing the error and improving the accuracy results, efficient training of ANFIS is required.
Training algorithm of modified ANFIS The sets of premise parameters and resultant parameters are represented as and correspondingly. Let J denote the number of training data. stands for the expected overall output of ANFIS and The output error for every training data is
(29) The training objective is to decide all of the parameter sets
and by reducing the value of Er .The Modified Adaptive
Network-based Fuzzy Inference System is helpful in the classification of cystic nodule from solid nodule.
1813
5.
EXPERIMENTAL
RESULTS
AND
DISCUSSION
The experimental analysis is carried out in the matlab simulation environment for the both the available and proposed research techniques. In this research work, thyroid images are collected from http://cimalab.intec.co/applications/thyroid/ This system has been mainly used for thyroid nodules that are ≥1 cm. In this research work, the available techniques including histogram, MultiLayer Perceptron (MLP) and Improved Local Binary Pattern with Anarchic Society Optimization (ILBP-ASO) and proposed Modified Ant Colony Optimization with Modified Adaptive Network-based Fuzzy Inference System (MACO-MANFIS) technique are evaluated for the thyroid image dataset provided. The simulation results of the proposed research technique are illustrated in the figure 6 to 12 given below.
Figure 6: Main menu
Figure 7: Input images
Figure 6 illustrates the main menu function of the proposed technical work. The collection of database images is given in figure 7.
Figure 8: Preprocessed images (training)
Figure 9: Segmentation results (training)
Figure 8 shows the preprocessing of the input images employing Dynamically Weighted Median Filter (DWMF). The segmentation of the preprocessed image is done with the Localized Region based Active Contour. The segmented result is illustrated in figure 9.
Figure 10: Input images (testing)
1814 Figure 11: segmentation (testing)
With the help of Localized Region based Active Contour model, the segmentation is performed on the input images. The segmented images are shown in figure 11.
Figure 12: Test result
The segmented images are classified by using Modified Adaptive Network-based Fuzzy Inference System (MANFIS). The result images are shown in figure 12. The test input is classified as thyroid nodule (abnormal).
Performance evaluation
1. Prediction accuracy
Accuracy is defined to be the overall correctness of the model and is assessed to be the total actual classification parameters ( ) divided by the sum of the classification parameters ( ) The accuracy is computed as:
( )
(30)
TP - True Positive
Tn- True Negative
Fp-False Positive
Fn-False Negative
Where TP is called as the amount of right predictions that
an instance is negative, Tn indicates the amount of wrong
predictions that an instance is positive, Fp refers to the
amount of wrong predictions that an instance negative, and Fn refers to the amount of right predictions that an instance
is positive.
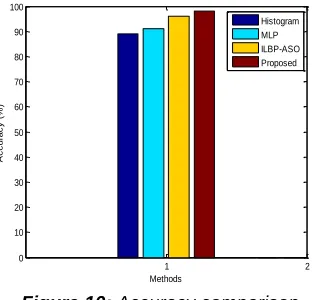
Figure 10: Accuracy comparison
Figure 10 illustrates the performance of the available Histogram, MLP and ILBP-ASO based classification and proposed Modified Ant Colony Optimization with Modified Adaptive Network-based Fuzzy Inference System (MACO-MANFIS) based classification in terms of accuracy metric. The proposed and the available techniques are plotted along the x-axis and accuracy is plotted along the y-axis. In this proposed technical work, different features including Improved Local Binary Pattern (ILBP), Grey Level Co-occurrence Matrix (GLCM) and Gray-Level Run Length Matrix (GLRLM) get extracted from the preprocessed image. For achieving better classification accuracy, optimal features are chosen with the aid of MACO algorithm. Depending on the features selected, the MANFIS scheme classifies the thyroid nodules with more accuracy. The experimental results reveal that the newly introduced system attains much better accuracy in comparison with the available techniques.
2. Precision
Precision is defined as the ratio of rightly predicted positive observations divided by the overall positive observations that are predicted.
Precision (P) = (31)
Figure 11: Precision comparison
The performance of the newly introduced Modified Ant Colony Optimization with Modified Adaptive Network-based Fuzzy Inference System (MACO-MANFIS) scheme is compared with the available Histogram, MLP and ILBP-ASO based classification techniques in terms of precision. The techniques are plotted along the x-axis and precision is plotted along the y-axis. The MANFIS scheme is used for the classification of the thyroid nodules with the features Input Image Initialization
100 Iterations Active contour-Based Segmentation
1 2
0 10 20 30 40 50 60 70 80 90 100
Methods
A
c
c
u
ra
c
y
(
%
)
Histogram MLP ILBP-ASO Proposed
1 2
0 10 20 30 40 50 60 70 80 90 100
Methods
P
re
c
is
io
n
(
%
)
1815 chosen. In Modified ANFIS, premise parameters and
resultant parameters are enriched on the basis of the resultant error. It increases the recall rate. As observed from the results, it can be finally reported that the novel MACO-MANFIS based classification approach attains better precision performance in comparison with the available system.
3. Recall
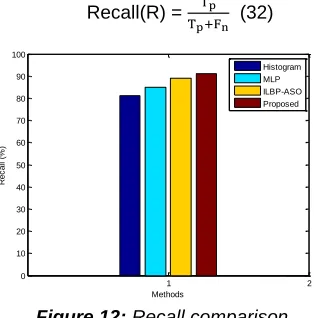
Recall refers to the ratio of rightly predicted positive observations divided bythe total of all observations in the real class.
Recall(R) = (32)
Figure 12: Recall comparison
Figure 12 shows the comparison analysis of recall performance of the proposed Modified Ant Colony Optimization with Modified Adaptive Network-based Fuzzy Inference System (MACO-MANFIS) and the available Histogram, MLP and ILBP-ASO based classification methods. The existing and proposed techniques are plotted along the x-axis and recall is plotted along the y-axis. The results obtained from the experiments reveal that the newly introduced MACO-MANFIS based classification scheme attains much better recall in comparison with the earlier techniques.
4. F-measure
F1 Score is defined as the weighted average of Precision and Recall. Hence, this score considers both false positives and false negatives.
F1 Score = (( ) ) (33)
Figure 13: F-measure comparison
The comparison analysis of the performance of the proposed Modified Ant Colony Optimization with Modified
Adaptive Network-based Fuzzy Inference System (MACO-MANFIS) approach is done with the available Histogram, MLP and ILBP-ASO based classification techniques in terms of f-measure metric. The proposed and existing techniques are plotted along the x-axis and f-measure is plotted along the y-axis. As observed from the experimental results, it can be reported that the proposed MACO-MANFIS based classification approach yields superior f-measure performance in comparison with the available system.
CONCLUSION
In this newly introduced research work, the Modified Ant Colony Optimization (MACO) with Modified Adaptive Network-based Fuzzy Inference System (MANFIS) scheme is used for effective classification of thyroid nodules. Once segmentation is completed, different texture feature extraction processes like Improved Local Binary Pattern (ILBP), Grey Level Co-occurrence Matrix (GLCM) and Gray-Level Run Length Matrix (GLRLM) schemes are brought into use. For achieving an optimal feature selection, Modified Ant Colony Optimization (MACO) algorithm is brought into use. At last, the Modified Adaptive Network-based Fuzzy Inference System (MANFIS) algorithm is used for classifying the cystic nodule from solid nodule. As observed from the experimental results, it can be shown that the proposed system attains much better accuracy, precision, recall and f-measure in comparison with the available system.
REFERENCES
[1] Ding, J., Cheng, H. D., Huang, J., Zhang, Y., &Ning, C. (2011, October). A novel quantitative measurement for thyroid cancer detection based on elastography. In 2011 4th International Congress on Image and Signal Processing (Vol. 4, pp. 1801-1804). IEEE. [2] Mahmood, N. H., &Rusli, A. H. (2011). Segmentation
and area measurement for thyroid ultrasound image. International Journal of Scientific & Engineering Research, 2(12), 1-8.
[3] Choi, J. S., Kim, J., Kwak, J. Y., Kim, M. J., Chang, H. S., & Kim, E. K. (2009). Preoperative staging of papillary thyroid carcinoma: comparison of ultrasound imaging and CT. American Journal of Roentgenology, 193(3), 871-878.
[4] N. Singh and A. Jindal, ―Ultra sonogram Images for Thyroid Segmentation and Texture Classification in Diagnosis of Malignant ( Cancerous ) or Benign ( Non-Cancerous ) Nodules,‖ vol. 1, no. 5, pp. 202–206, 2012. [5] U. R. Acharya, V. S. S, F. Molinari, R. Garberoglio, J. S. Suri, and F. Aimbe, ―Automated Benign & Malignant Thyroid Lesion Characterization and Classification in 3D Contrast-Enhanced Ultrasound,‖ pp. 452–455, 2012.
[6] Nugroho, H. A., Nugroho, A., Frannita, E. L., &Ardiyanto, I. (2017, August). Classification of thyroid ultrasound images based on shape features analysis. In 2017 10th Biomedical Engineering International Conference (BMEiCON) (pp. 1-5). IEEE.
[7] Ma, J., Wu, F., Zhao, Q., & Kong, D. (2017). Ultrasound image-based thyroid nodule automatic segmentation using convolutional neural networks. International
1 2
0 10 20 30 40 50 60 70 80 90 100
Methods
R
e
c
a
ll
(%
)
Histogram MLP ILBP-ASO Proposed
1 2
0 10 20 30 40 50 60 70 80 90 100
Methods
F
-M
e
a
s
u
re
(
%
)
1816 journal of computer assisted radiology and
surgery, 12(11), 1895-1910.
[8] Nugroho, H. A., Frannita, E. L., Ardiyanto, I., &Choridah, L. (2019). Computer aided diagnosis for thyroid cancer system based on internal and external characteristics. Journal of King Saud University-Computer and Information Sciences‖.
[9] H. M. Gireesha and S. Nanda, ―Thyroid Nodule Segmentation and Classification in Ultrasound Images,‖ vol. 3, no. 5, pp. 2252–2256, 2014.
[10]E. G. Keramidas and D. Maroulis, ―Τ ND : A Thyroid Nodule Detection System for Analysis of Ultrasound Images and Videos,‖ no. Cm, 2010.
[11]Gao, C. C., &Hui, X. W. (2010). GLCM-based texture feature extraction. Computer Systems & Applications, 6, 048.
[12]Mohanaiah, P., Sathyanarayana, P., &GuruKumar, L. (2013). Image texture feature extraction using GLCM approach. International journal of scientific and research publications, 3(5), 1.
[13]Zulpe, N., &Pawar, V. (2012). GLCM textural features for brain tumor classification. International Journal of Computer Science Issues (IJCSI), 9(3), 354.
[14]Dash, S., &Senapati, M. R. (2018). Gray level run length matrix based on various illumination normalization techniques for texture classification. Evolutionary Intelligence, 1-10.
[15]Mishra, S., Majhi, B., &Sa, P. K. (2018). GLRLM-Based Feature Extraction for Acute Lymphoblastic Leukemia (ALL) Detection. In Recent Findings in Intelligent Computing Techniques (pp. 399-407). Springer, Singapore.
[16]Dorigo, M., &Stützle, T. (2019). Ant colony optimization: overview and recent advances. In Handbook of metaheuristics(pp. 311-351). Springer, Cham.
[17]Tabakhi, S., &Moradi, P. (2015). Relevance– redundancy feature selection based on ant colony optimization. Pattern recognition, 48(9), 2798-2811. [18]Dadaneh, B. Z., Markid, H. Y., &Zakerolhosseini, A.