JIEM, 2014 – 7(3): 589-604 – Online ISSN: 2013-0953 – Print ISSN: 2013-8423 http://dx.doi.org/10.3926/jiem.1075
Study on Multi-objective Flexible Job-shop Scheduling Problem
considering Energy Consumption
Zengqiang Jiang, Le Zuo, Mingcheng E
School of Mechanical, Electronic & Control Engineering, Beijing Jiaotong University (China)
, [email protected], [email protected]
Received: January 2014 Accepted: May 2014
Abstract:
Purpose:
Build a multi-objective Flexible Job-shop Scheduling Problem(FJSP) optimization
model, in which the makespan, processing cost, energy consumption and cost-weighted
processing quality are considered, then Design a Modified Non-dominated Sorting Genetic
Algorithm (NSGA-II) based on blood variation for above scheduling model.
Design/methodology/approach:
A multi-objective optimization theory based on Pareto
optimal method is used in carrying out the optimization model. NSGA-II is used to solve the
model.
Findings:
By analyzing the research status and insufficiency of multi-objective FJSP, Find that
the difference in scheduling will also have an effect on energy consumption in machining
process and environmental emissions. Therefore, job-shop scheduling requires not only
guaranteeing the processing quality, time and cost, but also optimizing operation plan of
machines and minimizing energy consumption.
optimized and the prematurity of population is overcome. Finally, the performance of the
proposed model and algorithm is evaluated through a case study, and the results proved the
efficiency and feasibility of the proposed model and algorithm.
Keywords:
multi-objective scheduling, flexible job-shop scheduling, NSGA-II, energy consumption,
blood variation
1. Introduction
With the continuous development of productivity, on the one hand, human life is improving constantly, but on the other hand, which leads to tremendous damages to natural environment. So it’s important to minimize the destruction to natural environment when making efforts to improve production efficiency. Energy consumption is one of important aspects. In actual production processes, scheduling is one of the key factors that influence production efficiency, quality and cost (Zhang, Dong, Wang, Li & Liu, 2010). In addition, the difference in scheduling will also have an effect on resource consumption and emissions (He, Liu, Cao & Liu, 2007). Therefore, job-shop scheduling requires not only guaranteeing the processing quality, time and cost, but also optimizing operation plan of machines to minimize energy consumption (Fang, Uhana, Zhao & Sutherland, 2011; Luo, Du, Huang, Chen & Li, 2013; Dai, Tang, Giret, Salido & Li, 2013).
FJSP is an extension to traditional Job-Shop Scheduling Problem (Liu, Yang, Cheng, Xing, Lu, Zhao et al., 2012). It usually has multiple optimization objectives. S o a multi-objective optimization result is often not a single optimal solution, but a set of Pareto optimal solutions (Zheng, 2010).
In this paper, taking into account the energy consumption and according to an actual production environment, a multi-objective optimization scheduling model is developed. In this model, energy consumption, makespan, processing cost and cost-weighted processing quality are optimized; and an NSGA-II with blood variation is designed by optimizing crossover and mutation strategy of NSGA-II in order to overcome the prematurity of population.
2. Problem Description
A multi-objective Flexible Job-Shop Scheduling Problem can be described as following:
Suppose that there is m machines and n workpieces, each work consists of several operations; workpiece i includes qi procedures; each procedure can be processed by several
machines;
a
ijk represents that procedure j of workpiece i is processed on machine k or notand it's value is 1 or 0; the processing cost, time, quality is relying on the performance of the
machine; k
ij
S is beginning time of procedure j of processing workpiece i on machine k; k ij T
is the duration of procedure j of processing workpiece i on machine k;
F
ijk is finishing timeof procedure j of processing workpiece i on machine k,
F
ijk
S
ijk
T
ijk. The scheduling goalis to determine processing sequence and processing machines, and to make each scheduling objective achieve optimal when satisfying the below constraints (Liu, Zhang, Jiang, Ge & Zhang, 2008):
(1) Each machine can only process one workpiece at a time;
(2) All the machines are available at beginning time;
(3) Processing can’t be interrupted;
(4) A processing plan has been determined, and all workpieces have the same priority;
(5) procedure j can be started only after the finish of procedure j-1 for a workpiece.
3. Scheduling Model
1) Time
The processing time can be represented as make-span:
max(
)
max(
k)
ij k ij k
ij
S
T
F
T
2) Cost
The processing cost includes the cost of materials and production; the production cost is directly related to production scheduling (Liu et al., 2008).
Cost of raw materials:
n i im
c
MC
1, where mci denotes the cost of raw materials of work i.
Process cost:
n i k q j k ij k ijT
p
c
O
PC
i1 1
, where pck stands for the process cost of machine k per unit time, in
this cost the personnel cost is included.
Therefore, the final processing cost is
n i k q j k ij k ij n ii
O
T
pc
mc
PC
MC
C
i 1 1 1 . 3) QualityDefective rate can be used to measure the processing quality of a procedure on an machine. Besides, as more and more processes of a workpiece have been done, the associated cost increases. If processing defects appear in the later stage of production processing, the loss of
cost will be higher. So, the cost-weighted processing quality instability index
L
ijk is used torepresent processing quality.
k H j k ij k ij H
i
O
T
p
c
PC
1
, where the process cost of first H steps of the workpiece i.
k ij j i i k
ij mc PC q
L ( ) ,
q
ijk is the defective rate of procedure j of workpiece i on machine k.j
i i PC
mc is the cost-weighted quality instability index, indicating that when a workpiece costs more, its quality is more important.
n i q j k ij k ij iL
O
Q
1 1calculates the cost-weighted processing quality instability index of
4) Energy Consumption
The energy consumption to complete the same process on different machines is different. Therefore, energy consumption should be represented as total energy consumption E,
n
i
k q
j
k ij k ij
T
e
O
E
i1 1
.
4. Scheduling algorithm of BVNSGA-II
NSGA-II has a better rate of convergence, so it is widely used. But it lacks population diversity. A new NSGA-II algorithm is developed, which is named Blood-Variation-based NSGA-II(BVNSGA-II) and its crossover and mutation strategy is improved. In BVNSGA-II, the mutation rate is determined by calculating chromosome blood relationship. This new algorithm can avoid early convergence to local optimal solution.
4.1. Encoding and decoding
FJSP should get the sequence of a procedure and the proper machine for every procedure.
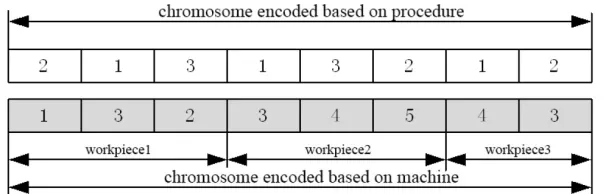
Figure 1. 2-level integer encoding based on procedure and machine
As shown in Figure1, the encoding consists of two parts. The first part is encoding based on process, which can determine the sequence of working procedure. The other part is encoding based on machine, which can choose the machine for each procedure. Therefore, a chromosome in Figure 2 shows 3 workpieces, which consists of 8 procedures, and will be processed on 5 different machines. The processing sequence of this chromosome can be
represented as
O
213 ,O
111 , O314 , 3 12O
, O323 , 4 22O
, O132 ,5 23
O represents that the jth
procedure of the ith workpiece will be processed on the kth machine. For example, 3 21
O
means4.2. Select operation
Compared to a single objective optimization problem, the select operation of a multi-objective optimization problem is more complex, which generally contains the ranking of individuals and selection strategy of non-dominated solutions with the same rank.
4.2.1. Ranking of individuals
At present, two kinds of Pareto sorting methods are widely used: the recursion sorting method (Jensen, 2003) and the modified quick sorting method (Zheng, 2010). Research shows that the second method has better computational performance when there are only two objectives (Zheng, 2010). So in this paper, the modified quick sorting algorithm will be used.
4.2.2. Selection strategy of non-dominated solution with the same rank
The individuals will have different ranks after non-dominated sorting, and individuals with low rank will be chosen to participate in the evolution. When the choosing individuals with the same rank, some strategies should be taken to make sure the diversity of colony in the evolution. At present some strategies are commonly used, which include niche technology, information entropy, density based clustering, grid, and classification etc. In this paper, the strategy of density based clustering is adopted. Although it has slightly higher computational complexity, it can capture the diversity and distribution of population macroscopically, and can also characterize the relationship among individuals with capability of controlling the colony in the evolution process (Zheng, 2010). Set P[i]dis as the crowding distance of individual i, and
P[i]k as the function value of individual i in subgoal k. So in normal circumstance, when there are r subgoals, the crowding distance of individual i will be
P
[
i
]
dis=
∑
k=1r
(
P
[
i
+
1
]
k−
P
[
i
−
1
]
k)
(1)As shown in Figure 2, if there are only 2 subgoals, the crowding distance of individual i is the sum of the length and width of the Solid rectangle in Figure 2.
In order to maintain the diversity of population, the individuals with larger crowding distances have higher probability to take part in reproduction and evolution.
4.3. Crossover and Mutation Operation
BVNSGA-II improves the crossover and mutation strategy of NSGA-II. It calculates the blood relationship of two chromosomes before genes crossover. Then, according to the calculation, it computes mutation rates of new chromosomes. At last, it will perform mutation operation to the crossed genes according to the mutation rate, which can avoid the prematurity of the algorithm.
4.3.1. Calculation method of genetic relative index and mutation probability
A consanguineous crossover will easily result in premature convergence of the algorithm, so according to different blood relationship of child chromosomes, different mutation rates to be used to operate mutation. Assume that the gene set of two chromosomes to be crossed is P1 and P2, s is consanguineous relative index and v is the variation index, and V is the initial mutation rate. s and v is calculated by the follow program.
float Founction(int p1[], int p2[]) { float s,v;
constant float V=0.5; float t=0;
for(int i=0;i<n;i++) { if(p1[i]==p2[i]) t++;
}
s=t/n();
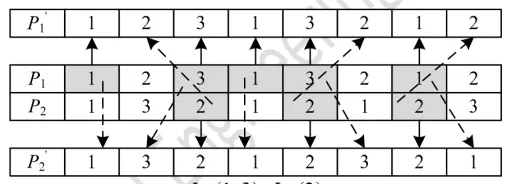
4.3.2. Crossover Strategy of Processing Sequence
The cross process of processing sequence gene segments is shown as Figure 3. P1 and P2 are two parent chromosomes, P1' and P2' are the progenies after crossover. The steps of crossover are following.
Step 1: Divide the workpieces into two sets, J1 and J2, and assume that the result is J1={1, 3},
J2={2}.
Step 2: Copy the workpieces included in the J1 and P1 to P1'; copy the workpieces included in the J2 and P2 to P2'; do not change the gene location of these workpieces at the same time.
Step 3: Copy the workpieces included in the J2 and P2 to P1'; copy the workpieces included in the J1 and in P1 to P2'; do not change the gene sequence of these workpieces at the same time.
Figure 3. Crossover of processing sequence
4.3.3. Crossover Strategy of Machine Allocation
Figure 4 shows the crossover operation of machine allocation. Assume that P1 and P2 cross and get P1' and P2'. The specific steps of crossover are as follow.
Step 1: Make a set R, which consists of 0 and 1, with the same length of a chromosome. Assume that R={0,1,0,1,1,0,1,0}.
Step 2: Select the procedures whose location are the same to element 1 in R from P1 and P2. As shown in the grey part in Figure 4.
Figure 4. Crossover strategy of machine allocation
4.3.4. Mutation Operation
The mutation operation used in this paper consists of two parts.
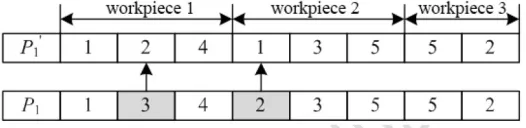
1) The mutation operation of gene segments of processing sequence: as shown in Figure 5, firstly choose a processing gene from one workpiece (assuming it is the grey 2 in Figure5), and then insert it into a random location.
Figure 5. Mutation operation of processing sequence
2) The mutation operation of gene segments of machine allocation: as shown in Figure 6, firstly choose a machine gene randomly in machine gene segments, and then choose the other machines in machine set that apply to this gene to replace the old one.
Figure 6. Mutation operation based on machine encoding
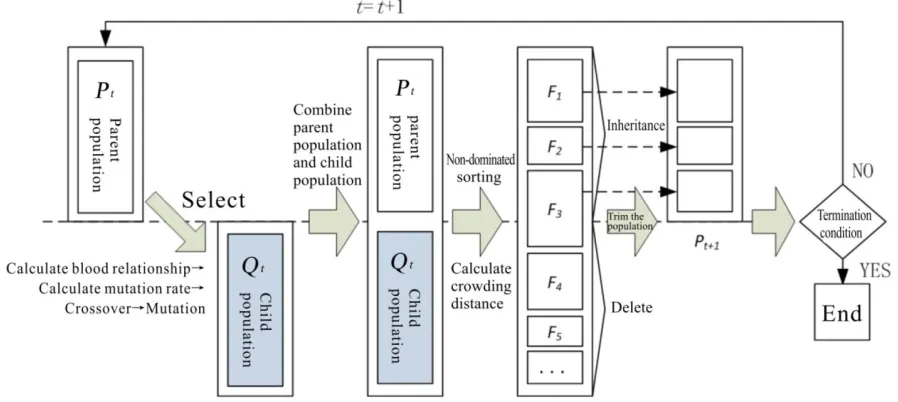
4.4. Algorithm Flowchart
The algorithm flowchart of BVNSGA-II is shown in Figure 7. Firstly, choose randomly some pairs of individuals from the parent population Pt, and calculate the blood relationship of this
crossover. After that, mutate these individuals according their mutation rates, and get the child population Qt. Combine the parent population Pt and the child population Qt. Compute the
individual rank in population by non-dominated sorting and the calculation of crowding distance, and trim the population to a new population Pt+1 according to the ranking. Repeat the
above operations until the termination condition of the algorithm is achieved.
Figure 7. Process of NSGA-II based on blood variation
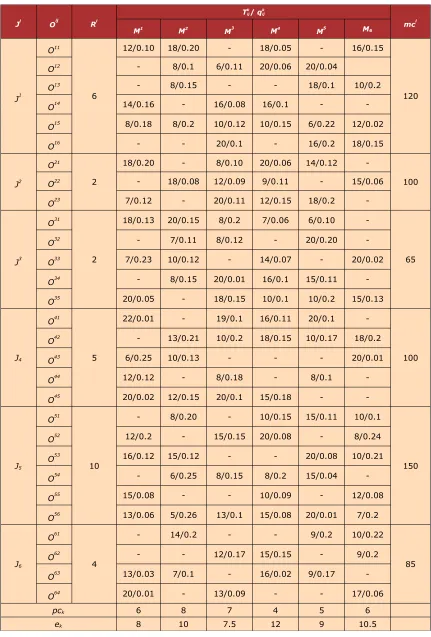
5. Case Study
Table 1 shows these data of a FJSP instance of mechanical workshop: the arrival time of the workpieces, the processing time of each procedure, the processing quality, the cost of raw materials, the processing cost of machine in unit time and energy consumption of machine in unit time. The relevant parameters of the algorithm are: the population size is 50, evolution generation is 100, crossover rate is 100%, and initial mutation rate is 10%.
Ji Oij Ri
Tkij/ qk ij
mci
M1 M2 M3
M4 M5 M6
J1
O11
6
12/0.10 18/0.20 - 18/0.05 - 16/0.15
120
O12 - 8/0.1 6/0.11 20/0.06 20/0.04
O13 - 8/0.15 - - 18/0.1 10/0.2
O14 14/0.16 - 16/0.08 16/0.1 -
-O15 8/0.18 8/0.2 10/0.12 10/0.15 6/0.22 12/0.02
O16 - - 20/0.1 - 16/0.2 18/0.15
J2
O21
2
18/0.20 - 8/0.10 20/0.06 14/0.12
-100
O22 - 18/0.08 12/0.09 9/0.11 - 15/0.06
O23 7/0.12 - 20/0.11 12/0.15 18/0.2
-J3
O31
2
18/0.13 20/0.15 8/0.2 7/0.06 6/0.10
-65
O32 - 7/0.11 8/0.12 - 20/0.20
-O33 7/0.23 10/0.12 - 14/0.07 - 20/0.02 O34 - 8/0.15 20/0.01 16/0.1 15/0.11
-O35 20/0.05 - 18/0.15 10/0.1 10/0.2 15/0.13
J4
O41
5
22/0.01 - 19/0.1 16/0.11 20/0.1
-100
O42 - 13/0.21 10/0.2 18/0.15 10/0.17 18/0.2 O43 6/0.25 10/0.13 - - - 20/0.01
O44 12/0.12 - 8/0.18 - 8/0.1
-O45 20/0.02 12/0.15 20/0.1 15/0.18 -
-J5
O51
10
- 8/0.20 - 10/0.15 15/0.11 10/0.1
150
O52 12/0.2 - 15/0.15 20/0.08 - 8/0.24
O53 16/0.12 15/0.12 - - 20/0.08 10/0.21 O54 - 6/0.25 8/0.15 8/0.2 15/0.04
-O55 15/0.08 - - 10/0.09 - 12/0.08 O56 13/0.06 5/0.26 13/0.1 15/0.08 20/0.01 7/0.2
J6
O61
4
- 14/0.2 - - 9/0.2 10/0.22
85
O62 - - 12/0.17 15/0.15 - 9/0.2
O63 13/0.03 7/0.1 - 16/0.02 9/0.17
-O64 20/0.01 - 13/0.09 - - 17/0.06
pck 6 8 7 4 5 6
ek 8 10 7.5 12 9 10.5
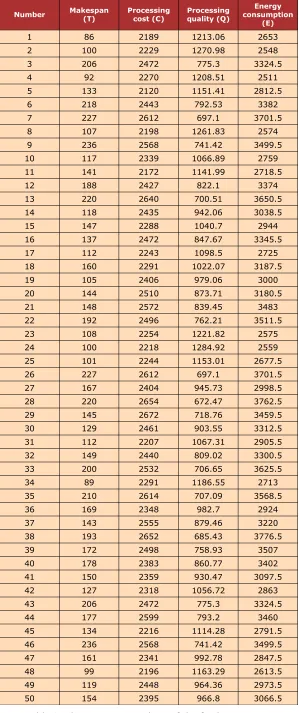
Number Makespan(T) Processingcost (C) Processingquality (Q) consumptionEnergy (E)
1 86 2189 1213.06 2653
2 100 2229 1270.98 2548
3 206 2472 775.3 3324.5
4 92 2270 1208.51 2511
5 133 2120 1151.41 2812.5
6 218 2443 792.53 3382
7 227 2612 697.1 3701.5
8 107 2198 1261.83 2574
9 236 2568 741.42 3499.5
10 117 2339 1066.89 2759
11 141 2172 1141.99 2718.5
12 188 2427 822.1 3374
13 220 2640 700.51 3650.5 14 118 2435 942.06 3038.5
15 147 2288 1040.7 2944
16 137 2472 847.67 3345.5
17 112 2243 1098.5 2725
18 160 2291 1022.07 3187.5
19 105 2406 979.06 3000
20 144 2510 873.71 3180.5
21 148 2572 839.45 3483
22 192 2496 762.21 3511.5
23 108 2254 1221.82 2575
24 100 2218 1284.92 2559
25 101 2244 1153.01 2677.5
26 227 2612 697.1 3701.5
27 167 2404 945.73 2998.5 28 220 2654 672.47 3762.5 29 145 2672 718.76 3459.5 30 129 2461 903.55 3312.5 31 112 2207 1067.31 2905.5 32 149 2440 809.02 3300.5 33 200 2532 706.65 3625.5
34 89 2291 1186.55 2713
35 210 2614 707.09 3568.5
36 169 2348 982.7 2924
37 143 2555 879.46 3220
38 193 2652 685.43 3776.5
39 172 2498 758.93 3507
40 178 2383 860.77 3402
41 150 2359 930.47 3097.5
42 127 2318 1056.72 2863
43 206 2472 775.3 3324.5
44 177 2599 793.2 3460
45 134 2216 1114.28 2791.5 46 236 2568 741.42 3499.5 47 161 2341 992.78 2847.5 48 99 2196 1163.29 2613.5 49 119 2448 964.36 2973.5
50 154 2395 966.8 3066.5
The final result is a set of Pareto optimal solution which includes lots of individuals, and it provides a series of feasible optimal solutions. In production processing, decision makers can determine the weights of different objectives by AHP (Analytic Hierarchy Process) according to the actual production situation. Assume the weights of T, C, Q and E are 0.5, 0.3, 0.1 and 0.1. then calculate the different Obji of each optimal solution in the set of the Pareto optimal
solution by using the following formula.
min max max min max max min max max min max max
E
E
E
E
w
Q
Q
Q
Q
w
C
C
C
C
w
T
T
T
T
w
Obj
i E i Q i C i T i
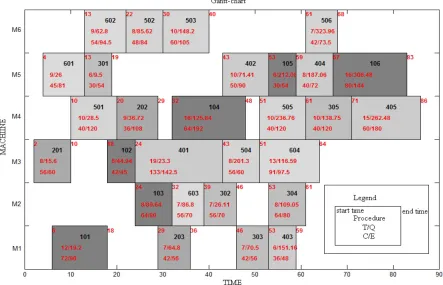
Sort the results and the 29th solution is optimal, its Gantt-chart is shown in figure 8.
Figure 8. Gantt chart of The optimal solution
6. Conclusion
Then a method based on BVNSGA-II is proposed, in which, the chromosome mutation rate is determined after calculating the blood relationship between the two cross chromosomes, crossover and mutation strategy of NSGA-II is optimized and the prematurity of population is overcome, so the calculating speed and quality of above model is improved.
Finally, the performance of the proposed model and algorithm is evaluated through a case study, and the result proved the efficiency and feasibility of the proposed.
Though we have achieved some positive results, there are still some shortcomings in our research that need to be improved. For example, the states of a processing machine can be divided into stop, start-up, no-load, processing, and different states have different energy consumption, so I will try to find out the energy consumption features in different states by experiments, then to build a more precise scheduling model and find a more appropriated scheduling plan.
Acknowledgment
This work is supported by the Fundamental Research Funds for the Central Universities of China (Grant No.2012JBM090).
References
Corne, D.W. (2000). The Pareto envelope based selection algorithm for multi-objective optimization. Lecture Notes in Computer Science, 839-848. http://dx.doi.org/10.1007/3-540-45356-3_82
Dai, M., Tang, D.B., Giret, A., Salido, M.A. & Li, W.D. (2013). Energy-efficient scheduling for a flexible flow shop using an improved genetic-simulated annealing algorithm. Robotics and
Computer-Integrated Manufacturing. 29(5), 418-429. http://dx.doi.org/10.1016/j.rcim.2013.04.001
Deb, K., Pratap, A., Agarwal, S., & Meyarivan, T. (2002). A fast and elitist multi-objective genetic algorithm: NSGA-II. IEEE Transactions on Evolutionary Computation, 6(2): 182-197. http://dx.doi.org/10.1109/4235.996017
Fang, K., Uhana, N., Zhao, F., & Sutherland, J.W. (2011). A new approach to scheduling in manufacturing for power consumption and carbon footprint reduction. Journal of
Manufacturing Systems, 30, 234-240. http://dx.doi.org/10.1016/j.jmsy.2011.08.004
Fonseca, C.M., & Fleming, P.J. (1993). Genetic algorithms for multiobjective optimization: Formulation, discussion and generalization. Proceedings of the Fifth International Conference
Ghasem, M., & Mehdi, M. (2011). A Pareto approach to multi-objective flexible job-shop scheduling problem using particle swarm optimization and local search. International Journal
of Production Economics, 129(1), 14-22. http://dx.doi.org/10.1016/j.ijpe.2010.08.004
He, Y., Liu, F., Cao, H.J., & Liu, C. (2007). Job Scheduling Model of Machining System for Green Manufacturing. Journal of Mechanical Engineering, 43(4), 27-33.
http://dx.doi.org/10.3901/JME.2007.04.027
Horn, J., Nafpliotis, N., & Goldberg, D.E. (1994). A niched Pareto genetic algorithm for multi-objective optimization. Proceedings of the 1st IEEE Congress on Evolutionary
Computation. Piscataway: IEEE, 82-87. http://dx.doi.org/10.1109/ICEC.1994.350037
Jensen, M.T. (2003). Reducing the run-time complexity of multiobjective EAs: The NSGA-II and other algorithms. IEEE Transactions on Evolutionary Computation, 7(5), 503-515. http://dx.doi.org/10.1109/TEVC.2003.817234
Knowles, J., & Corne, D. (1999). The Pareto archived evolution strategy: a new baseline algorithm for multi-objective optimization. Proceedings of the 1999 Congress on Evolutionary
Computation. Piscataway, NJ: IEEE Press, 98-105. http://dx.doi.org/10.1109/CEC.1999.781913
Li, J.Q., Pan, Q.K., & Wang, Y.T. (2010). Hybrid Pareto-Based Tabu Search Algorithm for Solving the Multi-Objective Flexible Job Shop Scheduling Problem. Computer Integrated
Manufacturing Systems, 16(7), 1419-1426.
Liu, A.J., Yang, Y., Cheng, W.M., Xing, Q.S., Lu, H., Zhao, X.H. et al. (2012). Improved NSGA for Complex Manufacturing Environment. Computer Integrated Manufacturing Systems,
18(11), 2447-2458.
Liu, M.Z., Zhang, M.W., Jiang, Z.Q., Ge, M.G., & Zhang, M.X. (2008). Multi-objective and Flexible Job-Shop Problems Study Based on Hybrid Particle Swarm Optimization. Transactions
of The Chinese Society For Agricultural Machinery, 39(5), 122-127.
Luo, H., Du, B., Huang, G.Q., Chen, H. & Li, X. (2013). Hybrid flow shop scheduling considering machine electricity consumption cost. International Journal of Production
Economics. 146(2), 423-439. http://dx.doi.org/10.1016/j.ijpe.2013.01.028
Srinivas, N., & Deb, K. (1995). Multi-objective function optimization using non-dominated sorting genetic algorithm. Evolutionary Computation, 2(3), 221-248.
http://dx.doi.org/10.1162/evco.1994.2.3.221
Xu, X.L., Ying, S.Y., Wang, W.L. (2010). Fuzzy Flexible Job-Shop Scheduling Method Based on Multi-Agent Immune Algorithm. Control and Decision, 25(2), 171-184. (in Chinese).
Zhang, C.Y., Dong, X., Wang, X.J., Li, X.Y., & Liu, Q. (2010). Improved NSGA-II for the Multi-objective Flexible Job-shop Scheduling Problem. Journal of Mechanical Engineering,
46(11), 156-164. http://dx.doi.org/10.3901/JME.2010.11.156
Zhang, G.H., Shao, X.Y., Li, P.G., Gao, L. (2009). An effective hybrid particles warm optimization algorithm for multi-objective flexible job shop scheduling problem. Computers &
Industrial Engineering, 56(2), 1309-1318. http://dx.doi.org/10.1016/j.cie.2008.07.021
Zheng, J.H. (2010). Multi-objective Evolutionary Algorithm and Application. Beijing: Science press.
Zitzler, E., & Thile, L. (1999). Multi-objective evolutionary algorithm: A comparative case study and the strength Pareto approach. IEEE Transactions on Evolutionary Computation, 3(4), 257-271. http://dx.doi.org/10.1109/4235.797969
Zeng, S.Y., Li, H., Ding, L.X., & Yao, S.Z. (2004). A Fast Algorithm for Finding Non-Dominated Set Based on Sorting. Journal Of Computer Research And Development, 41(9), 1565-1571.
Journal of Industrial Engineering and Management, 2014 (www.jiem.org)
Article's contents are provided on a Attribution-Non Commercial 3.0 Creative commons license. Readers are allowed to copy, distribute and communicate article's contents, provided the author's and Journal of Industrial Engineering and Management's names are included.