1914
PERFORMANCE ANALYSIS ON THE ARDUINO UNO
MICROCONTROLLER-BASED WEIGHT MEASUREMENT
SYSTEM FOR TODDLER
1KURNIAWAN TEGUH MARTONO, 2EKO DIDIK WIDIANTO, 3YUSUF BAHCTIAR 1Computer Engineering Department, Engineering Faculty, Universitas Diponegoro, Indonesia 2Computer Engineering Department, Engineering Faculty, Universitas Diponegoro, Indonesia 3Computer Engineering Department, Engineering Faculty, Universitas Diponegoro, Indonesia E-mail: 1[email protected], 2[email protected], 3[email protected]
ABSTRACT
Error in reading the data or in processing the data input frequently occurs. It might be caused by the user negligence, the condition of the device used, or the unstandardized system and this, later on, leads to the problem in terms of data accuracy. The computer technology development today makes it possible to help human in coping with the problems mentioned above. In measuring the weight of the under-five-year-old children, the errors in reading and inputting data can occur. This is in relation to various abilities of each cadre. Also, the use of the device to measure the weight is not in accordance with the standard – some might use the electronic weighing scale and other might use the mechanical one. This unstandardized device can emerge a problem - particularly in reading the data. The weighing measurement system using Arduino is one of the ways to control the growth of the under-five-year-old children and this can minimize the error level in reading and inputting data. The development of this system uses the sequential development method and the application of this model can result in the best result. The test of the system was conducted through two phases: phase 1 related to the test conducted in laboratory and phase 2 related to the test conducted in Posyandu (maternal and child health centre). The results of the tests showed the error percentage of 0.067% and the percentage of accuracy of 99.93%. The result for the time taken in sending the data from the system to the mobile communication device was at 1.97 seconds at distance of 1 meter and 2.24 seconds at the distance of five meters.
Keywords:Measurement, Arduino, Performance, Data, Weight
1. INTRODUCTION
The advance of computer technology has brought a significant change in human life. Many computerized systems have been developed to assist human in problem solving. One of the problems faced by human is the one related to health - particularly in the period of growth and development of under-five-year-old children. The most of under five years old is the most crucial period for growth and one of the activities done during this period is weight measurement. Weight refers to one of indicators used in determining the growth and development of a child. The weight measurement needs to be gradually done purposely to observe to what extent the condition of the growth and development of children. Growth and development is a process consisting of 2 occurrences: growth and development. The
growing process is one of processes that can be qualitatively measured, meaning that it can be measured directly with the measurement device and with a measurement unit. Meanwhile, development refers to the changing process in the function of human organs for improvement.
1915 The activities done in this community are those related to the health condition of mothers and children, nutrition control, planned family program and handling of diarrhoea.
On the basis of the crucial role of posyandu in Indonesia, it is deemed essential to build a system that can support in taking the data. The problem faced by most of posyandu until 2018 was in the accuracy in taking the data and in the process in inputting the data. This occurred due to various competences of the staff in Posyandu. The various uses of the measurement device in posyandu has also contributed to a typical problem in reading the data. In its use, a manual weight measurement system requires a special treatment as the device needs a recalibration process. Another problem arising is related to the error in reading the result shown by a measurement device. The position of the angle of eyes and the indicator of result will highly influence the results. Any errors in reading the data mostly occurs in the weight measurement device with the result indicator by means of a needle. In addition to the errors in reading the data, an error that can occur is related to the errors in inputting the data among the staff. This might be determined by the level of workload such as the high number of under five-year-old children that need to be weighed in which it, later on, can affect the work performance among the staff of Posyandu. Hence, it is deemed important to create a weight measurement system for the under five-year-old children that can optimally operate either regarding the measurement or regarding the data input. This aims to minimize the level of errors that can be made by the staff of posyandu.
This paper purposely is to discuss about the work performance of Arduino microcontroller-based weight measurement system for the under five-year-old children that, in turn, can be used in the process of posyandu activities. The use of this system will be helpful in minimizing the error level made by the staff of posyandu. Performance testing is intended to determine the ability of the system when operated. Tests include sensor load cell capabilities and HC-05 module capabilities. The testing process is carried out in a laboratory environment and tested directly at POSYANDU.
2. RELATED WORK
A number of previous researches have become a reference in this research. The first research was about the weight measurement system and the height of elder people. The result obtained in this research was a measurement device that could
provide the information of the weight and height by applying the measurement of Body Mass Index (BMI). The result of the test showed that, overall, the system resulted in a valid output [3]. Other research is on the information system of mother and children health. In this research, the information system was used to do a process of monitoring the health of mother and children started from prenatal, neonatal, to baby. The results obtained from this research was a system that could provide a complete information to the users; thus, in making decision it can be more accurate [4].
Based on studies from previous studies, this study has the aim of how to build a system that can be used to measure toddlers' weight connected to a smartphone device. Data generated by the system is data obtained directly from the system and there is no direct role from the user in entering data. Thus the potential for errors in entering data can be reduced so that the data becomes valid. With the valid data, the relevant parties are able to make an analysis and an accurate decision.
3. METHOD 3.1 Research Phase
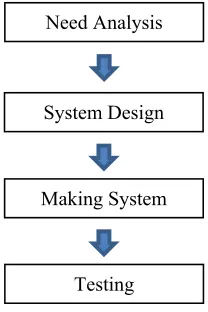
[image:2.612.375.479.514.670.2]To obtain the research results as expected, some steps or phases of the research are highly required. This research involved 4 phases. Figure 1 presents the phases in the process of designing the weight measurement system. Each of phase was conducted in sequence purposely to result in a system highly suitable with the plan as well as the needs.
Figure 1: Steps of designing the system The explanation of each phase is presented as follows.
1. Need Analysis Phase Need Analysis
System Design
Making System
1916 It is an initial phase conducted in the process of designing a system. The need analysis process was conducted through an interview with the candidate of system user. The function of the need analysis was to observe the needs of the system covering the functional system from the system and the needs for the non-functional need of the system.
2. Design Phase
It is a phase of translating the result from the need analysis. This phase was conducted to result in a guidance in making system. The activities in this phase was by designing the system flow and system circuit.
3. Phase of Making System
It is a translating process of the design phase. In this phase, the original form of circuit was realized by referencing to the design that has been made.
4. Testing Phase
It is the final phase of the system development process. The test was conducted to observe the level of readiness of system whether it has been ready to be used.
3.2 Functional Need
The functional need from the weight measurement system in the under five-year-old children refers to that the system can do the process of measuring the weight of the under five-year-old children in two states: standing position and laying position. The data obtained were then sent to the application that has been installed on the android-based mobile communication device.
3.3 Non Functional Need
Non-functional need in this system refers to the need related to the device or components that would be used. The need of components included the Load Cell Sensor, HX711 module as the module to convert the analogue signal to the digital signal, HC-05 module as the wireless communication module between the system and android-based mobile communication mobile, Liquid Cristal Display (LCD) and arduino uno as its controller.
Load cell is the sensor used to measure the change of value for load. The weight measurement system of under five-year-old children used two units of sensor load cells, each of which had the capacity of 20 kg (total capacity of two units was 40 Kg). However, the maximum load that could be read by the system was 30kg. The maximum load was made lower by
10 kg of the load that could be measured by the sensor. It aimed to give a protection to the sensor from any damages due to the load exceeding the capacity that could be measured by the sensor.
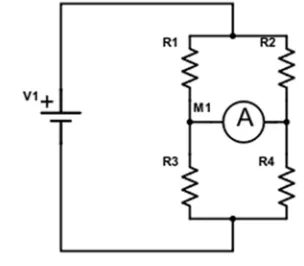
[image:3.612.344.496.215.348.2]Load cell sensor has a work principle by referring to the circuit of the Wheatstone bridge, a circuit that can be used to measure the value of resistance, voltage, current and strain of a material. Figure 2 depicts the scheme of circuit from the Wheatstone bridge in the loadless state.
Figure 2: The Scheme Of Loadless Wheatstone Bridge Circuit
When the value R1 = R2 and R3 = R4, then there would be no electricity flowing to A. Such condition is called the balanced condition. If the condition of value R1 is converted to be equal to R4 and value R2 would be equal to R4, then there would be the potential difference; thus, on the point A there would be electrical current. With this potential difference, the state of the Wheatstone bridge is unbalanced, so this potential difference value would be the output value of the system. Figure 3 portrays the physical form of sensor load cell.
Figure 3: Sensor Load Cell
[image:3.612.327.532.510.648.2]1917 Table 1 shows the Interface of the Load Cell and HX711
Table 1: Load Cell Interface With HX711
No Load Cell Pin Interface
HX711 pin interface
1 Red Cable E+ (Power Supply 5V)
2 Black Cable E- (Power Supply)/GND 3 White Cable A Channel - 4 Blue/Green Cable A Channel + Signal conditioning circuit was required in the design of weight measuring system. This circuit functioned to adjust the output signal from the sensor to be forwarded onto a microcontroller. Here, the signal conditioning module used in this system was HX711 module, a 24-bit analogue module to digital converter. This module functioned to convert the output from the load cell sensor into the digital value. HX711 module had a high sensitivity enabling it to detect a very little change from the sensor [5][6]. Figure 4 depicts the structure of HX711 pin.
Figure 4: The Structure Of HX711pin [6]
Data communication was required in this system as the data obtained from the system would be sent to the mobile communication device. Here, Bluetooth was used in the data communication process. The data communication module was by using the Bluetooth HC-05 module, a wireless communication module using the Bluetooth working at the frequency of 2.4GHz with the choice of two connectivity modes. Mode 1 was used as a slave mode functioned as the data receiver, and mode 2 functioned as the master; thus making it possible to send the data simultaneously [7]. Having these two modes, then the HC-05 module could be very flexible in its
[image:4.612.311.529.106.580.2]implementation. The range of this module was in 10 meters. Figure 5 portrays the HC-05 module.
Figure 5 : Hc-05 Module [8]
[image:4.612.96.286.382.549.2]Description of each pin is shown in Table 2.
Table 2: Pin Configuration [8]
No Pin Name Description
1 Enable / Key This pin is used to toggle between Data Mode (set low) and AT command mode (set high). By default it is in Data mode
2 Vcc Powers the module. Connect
to +5V Supply voltage
3 Ground Ground pin of module,
connect to system ground.
4 TX –
Transmitter
Transmits Serial Data. Everything received via Bluetooth will be given out by this pin as serial data.
5 RX – Receiver Receive Serial Data. Every serial data given to this pin will be broadcasted via Bluetooth
6 State The state pin is connected to on board LED, it can be used as a feedback to check if Bluetooth is working properly.
1918 digitalRead() functions. They operate at 5 volts. Each pin can provide or receive a maximum of 40 mA, and has an internal pull-up resistor (disconnected by default) of 20–50 kOhms[10]. Figure 6 shows the Arduino Uno R3 device.
Figure 6: Arduino Uno R3
[image:5.612.91.300.380.454.2]In making a program that would be used in Arduino device, an Integrated Development Environment (IDE) was specifically required. The program that has been developed in the IDE was then downloaded onto the Arduino device by means of a USB connection. Figure 7 illustrates the program download scheme that has been developed on IDE onto the Arduino device.
Figure 7: Program Download Scheme
3.4 System Design
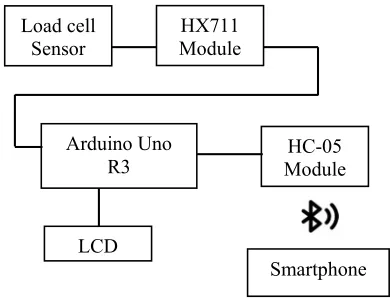
The design phase refers to the phase of system design by referring to the previous stage (i.e. needs analysis phase). This weight measurement system in the under five-year-old children used a load cell sensor used to detect the weight of the object to be measured. Subsequently, the ADC HX711 module would process the conversion of the resistance value as released from the sensor load cell. HX711module also became the opamp from the output of load cell sensor in relation to that the signal coming out was still too weak to be read by Arduino Uno. Furthermore, Arduino device would process the data that have been sent and would then be displayed through LCD. At the same time, the data also would be sent to the mobile device through the communication with the Bluetooth. The component that acted in this communication was HC-05 module. Figure 8 shows the diagram block of weight measurement
system design for the under five-year-old children.
Figure 7: System Block Diagram
[image:5.612.333.514.391.505.2]The subsequent design phase was to do the process of designing the hardware. It aimed to obtain the full description purposely to prevent any problems when doing the schematic design process. Figure 8 shows the design of the hardware.
Figure 8: Hardware Design
[image:5.612.324.531.587.703.2]The schematic diagram was the next design phase. This schematic circuit contained the symbol of components and circuit path. Figure 9 shows the schematic circuit from the hardware of weight measurement system.
Figure 9: The Hardware Schematic Circuit Of Mass And Height Scale
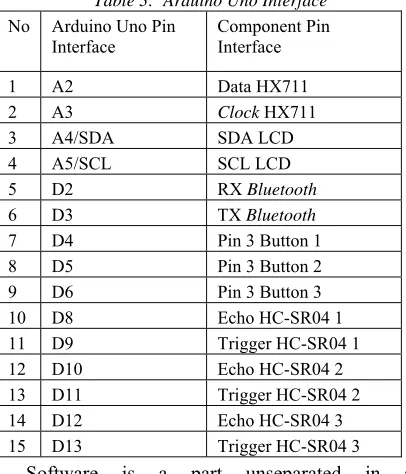
The design of the Arduino pin interface with the component is shown in Table 3.
Load cell Sensor
HX711 Module
Arduino Uno
R3 Module HC-05
1919
Table 3: Arduino Uno Interface
No Arduino Uno Pin Interface
Component Pin Interface
1 A2 Data HX711
2 A3 Clock HX711
3 A4/SDA SDA LCD
4 A5/SCL SCL LCD
5 D2 RX Bluetooth
6 D3 TX Bluetooth
7 D4 Pin 3 Button 1
8 D5 Pin 3 Button 2
9 D6 Pin 3 Button 3
10 D8 Echo HC-SR04 1
11 D9 Trigger HC-SR04 1
12 D10 Echo HC-SR04 2
13 D11 Trigger HC-SR04 2
14 D12 Echo HC-SR04 3
15 D13 Trigger HC-SR04 3
Software is a part unseparated in a microcontroller system. In this research, the software built was used to control the system from the sensor to the part of the microcontroller. The design of the software began at the stage of making a system flow diagram. Figure 10 shows the software flow.
Figure 10. Flowchart Of System Software
[image:6.612.370.469.258.652.2]As shown in the flowchart in Figure 10, the initial process to be done was to call the library that would be needed in the system. The library included the load cell, Bluetooth and 16x2 LCD. The subsequent step was to define some variables and Constanta that would be used in the system program. The next process was the function setup() in which its commands were processed once only. The final process was the loop function () containing the command that would be repetitively processed. Figure 11 presents the flow chart for the initialization system.
Figure 11: Flowchart Initialization System Void Setup
1920 Bluetooth communication with the rate of 19200bps. HX711 module and load cell sensor would be activated prior to do the initialization process in each pin that has been connected to sensor, signal conditioning module, and communication module. The last phase was to activate the LCD function. The next flowchart is about the flowchart system of the running system void loop. In this part, the phase to be done was the load cell to read the load change from the input and then the data were displayed on LCD. Further, it was sent by HC-05 module to the mobile communication device. Figure 12 shows the flowchart running system void loop.
Figure 12: Flowchart Running System Void Loop
3.5 System Making
The phase of making system is the phase to translate the design process into the real form. In this phase, the system was made into two parts: in the hardware part and in the software part. For the
hardware, the initial phase was to change the schematic image into work image that later on would be printed into PCB (Printed Circuits Board). Meanwhile, in the software part, it was to build a command to run the system using IDE Arduino.
3.6 Testing
Performance is one of the parameters used in determining the ability of a system. In this study the testing process is carried out in stages, namely by testing the system functionality which includes the function of the sensor load cell and the HC-05 module. This functional test aims to find out the components of the system, the load cell sensor and the HC-05 module can operate or not. The test on load cell was conducted by comparing the results between the manual measurement and system measurement. The test on HC-05 module was to test the number of time required in sending the data from the system to the mobile communication devices. The testing process was done by testing the system functionality including the function of the load cell sensor and the HC-05 module. The next step is to test the performance of the system carried out at the POSYANDU location. At this stage the test was carried out using a sample of 9 children taken randomly.
4. RESULT 4.1 Implementation
The implementation in hardware consists of
the system hardware design. This system used
[image:7.612.319.530.543.654.2]the Arduino Uno board with the ATMega328P microcontroller as the control central of the system. Other hardware used in this system was sensor Load Cell, HX711 module, Bluetooth and LCD. Figure 13 shows the circuit of weight measurement system for the under five-year-old children.
Figure 13: The Circuit of Weight Measurement System
1921 five-year-old that are able to stand; while, the second position is in the laying position designed for those that are not able to stand yet.
(a)
(b)
Figure 14: (a) Measurement with standing position, (b) Measurement with laying position
The implementation on the software is a process of making the software used in the system. The process of implementation used Arduino IDE using language C. The program was made into some parts: declaration, void Setup(), void loop() and other methods. The parts of the program for the declaration part are presented as follows.
#include "HX711.h" #include <Wire.h>
#include <LiquidCrystal_I2C.h> #include <SoftwareSerial.h> #define idx_BERAT 1
#define idx_LCD 4 #define idx_BT 5
In this declaration, the calling process was from the library in the components of HX711, LCD, and Bluetooth and index series. To obtain the weight value that could be read by load cell
sensor, it required a method in the form of getWeight method. The parts of the program in the getWeight method are shown as follows.
float getWeight (){
weight = (1.001 * scale.get_units()) + 0;
return bodymass; }
The value of 1.001 referred to the correction value as read by load cell sensor. The variable of scale.get_units() contained the calibration factor that has been initially declared and initialized on the void setup with the command of scale.set_scale(99550) containing the value of -99550 as the result of the calibration experiment. The value of the experiment was saved in the variable of body mass that also contained the value of the equation calculation to calculate the final result of sensor output.
4.2 System Testing
It was conducted at the laboratory and the maternal and child health centre. The initial test was aimed to observe the difference of value produced by the system in comparison to the measuring tool used as the reference. The testing method included:
1. Testing on the function of load sensor 2. Testing on the data communication using
Bluetooth
4.1 Testing the Load Cell function
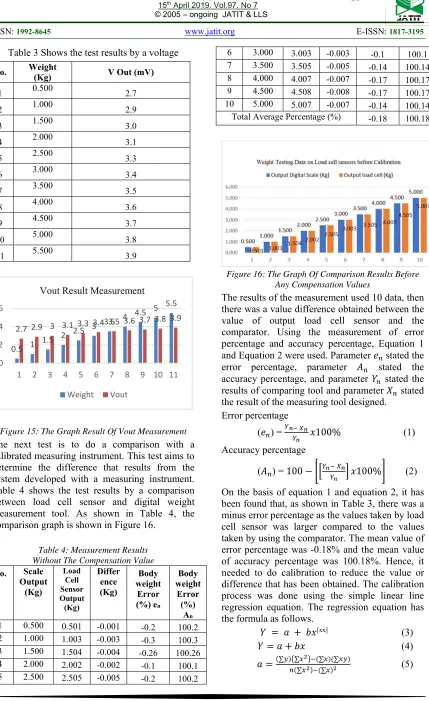
[image:8.612.90.299.142.470.2]1922 Table 3 Shows the test results by a voltage
Figure 15: The Graph Result Of Vout Measurement
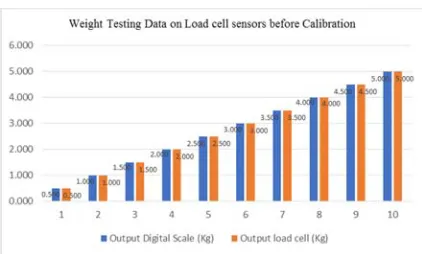
The next test is to do a comparison with a calibrated measuring instrument. This test aims to determine the difference that results from the system developed with a measuring instrument. Table 4 shows the test results by a comparison between load cell sensor and digital weight measurement tool. As shown in Table 4, the comparison graph is shown in Figure 16.
Table 4: Measurement Results Without The Compensation Value
No. Scale Output (Kg)
Load Cell Sensor Output (Kg)
Differ ence (Kg)
Body weight
Error (%) en
Body weight
Error (%)
An
1 0.500 0.501 -0.001 -0.2 100.2
2 1.000 1.003 -0.003 -0.3 100.3
3 1.500 1.504 -0.004 -0.26 100.26
4 2.000 2.002 -0.002 -0.1 100.1
5 2.500 2.505 -0.005 -0.2 100.2
6 3.000 3.003 -0.003 -0.1 100.1
7 3.500 3.505 -0.005 -0.14 100.14
8 4.000 4.007 -0.007 -0.17 100.17
9 4.500 4.508 -0.008 -0.17 100.17
10 5.000 5.007 -0.007 -0.14 100.14
Total Average Percentage (%) -0.18 100.18
Figure 16: The Graph Of Comparison Results Before Any Compensation Values
The results of the measurement used 10 data, then there was a value difference obtained between the value of output load cell sensor and the comparator. Using the measurement of error percentage and accuracy percentage, Equation 1 and Equation 2 were used. Parameter 𝑒 stated the error percentage, parameter 𝐴 stated the accuracy percentage, and parameter 𝑌 stated the results of comparing tool and parameter 𝑋 stated the result of the measuring tool designed.
Error percentage
(𝑒 ) = 𝑥100% (1) Accuracy percentage
(𝐴 ) = 100 𝑥100% (2)
On the basis of equation 1 and equation 2, it has been found that, as shown in Table 3, there was a minus error percentage as the values taken by load cell sensor was larger compared to the values taken by using the comparator. The mean value of error percentage was -0.18% and the mean value of accuracy percentage was 100.18%. Hence, it needed to do calibration to reduce the value or difference that has been obtained. The calibration process was done using the simple linear line regression equation. The regression equation has the formula as follows.
𝑌 𝑎 𝑏𝑥[xx] (3)
𝑌 𝑎 𝑏𝑥 (4)
𝑎 ∑ ∑∑ ∑∑ ∑ (5)
0.5 1 1.5
2 2.5 3
3.5 4 4.5
5 5.5
2.7 2.9 3 3.1 3.3 3.4 3.5 3.6 3.7 3.8 3.9
0 2 4 6
1 2 3 4 5 6 7 8 9 10 11
Vout Result Measurement
Weight Vout
No. Weight (Kg) V Out (mV)
1 0.500 2.7
2 1.000 2.9
3 1.500 3.0
4 2.000 3.1
5 2.500 3.3
6 3.000 3.4
7 3.500 3.5
8 4.000 3.6
9 4.500 3.7
10 5.000 3.8
[image:9.612.85.292.102.458.2]1923
𝑏 ∑∑ ∑∑ ∑ (6) Based upon the equation 5 and equation 6, then, the value obtained was at 0.8 and value b was at 1.001. Thus, the result of regression equation was:
Y = 0.8 + 1.001x.
Based on the measurement result, the result for the value of loadless load cell sensor was 0.8 kg. With this result, then compensation was 0.8 to make the loadless load cell became 0 kg. Thus, the regression equation for the weight measurement system was Y = 0 + 1.001x. Table 5 shows the result of the load measurement compared to a scale that was similar in the previous phase.
Table 5: Measurement Results Using The Compensation Values No. Scale
Output (Kg) Load Cell Sensor Output (Kg) Differ ence (Kg) Bodywe ight Errors (%) en
Body weight Errors (%)
An
1 0.500 0.500 0 0 100
2 1.000 1.000 0 0 100
3 1.500 1.500 0 0 100
4 2.000 2.000 0 0 100
5 2.500 2.500 0 0 100
6 3.000 3.000 0 0 100
7 3.500 3.500 0 0 100
8 4.000 4.000 0 0 100
9 4.500 4.500 0 0 100
10 5.000 5.000 0 0 100
Total Average Percentage (%) 0 100
Figure 17 shows the graph of the measurement result using the compensation value. For this, there would be no difference to the load cell sensor
Figure 17: Graph Of The Result For The Comparison With The Compensation Value
4.2 Data Communication Test
It aims to observe the performance of the HC-05 module. This test was conducted using 2 parameters: the changed distance and the use of mobile communication device. The initial phase of test was by making a connection between the weight measurement system and the communication device. Table 6 shows the result of the connection test between HC-05 and the mobile communication device.
Table 6: Testing On The Connection Of HC-05 And The Mobile Communication Device
No Mobile Devices
Range (m)
Trial 1 2 3 4 5 1 Mobile
device 1 1 2 3 4 5 1 1 1 1 1 1 1 1 1 1 1 1 1 1 1 1 1 1 1 1 1 1 1 1 1 2 Mobile
device 2 1 2 3 4 5 1 1 1 1 1 1 1 1 1 1 1 1 1 1 1 1 1 1 1 1 1 1 1 1 1 3 Mobile
device 3 1 2 3 4 5 1 1 1 1 1 1 1 1 1 1 1 1 1 1 1 1 1 1 1 1 1 1 1 1 1 Value 1 shows the success of connection with testing performed 5 times for each type of mobile communication device and distance. Based on the results of the connection testing as shown in Table 5, then the type of mobile device used can be connected with a weight measuring system to under five-year-old children.
[image:10.612.90.301.548.675.2]1924
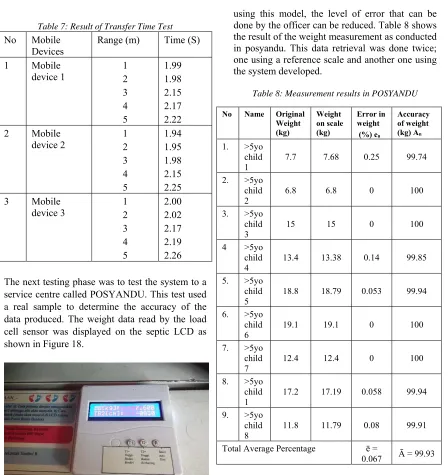
Table 7: Result of Transfer Time Test
No Mobile Devices
Range (m) Time (S)
1 Mobile
device 1 1 2 3 4 5
1.99 1.98 2.15 2.17 2.22 2 Mobile
device 2 1 2 3 4 5
1.94 1.95 1.98 2.15 2.25 3 Mobile
device 3
1 2 3 4 5
2.00 2.02 2.17 2.19 2.26
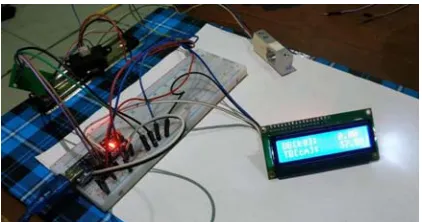
The next testing phase was to test the system to a service centre called POSYANDU. This test used a real sample to determine the accuracy of the data produced. The weight data read by the load cell sensor was displayed on the septic LCD as shown in Figure 18.
Figure 18. The display of LCD when doing the weight measurement of under five-year-old children directly on
the system
Data obtained in the system will then be sent to mobile communication devices that have been installed by the application. The next data is automatically saved when it is stored on the application server. In this test system users in this case were POSYANDU officers who were greatly helped in the data input process. The POSYANDU officer does not need to enter data manually anymore, because the system will automatically enter data into the database when the clerk clicks on the menu in the application. By
[image:11.612.86.534.86.561.2]using this model, the level of error that can be done by the officer can be reduced. Table 8 shows the result of the weight measurement as conducted in posyandu. This data retrieval was done twice; one using a reference scale and another one using the system developed.
Table 8: Measurement results in POSYANDU
As shown in Table 8, the results of weight in under five-year-old children using the developed system had a difference though in the laboratory testing the difference had been given a compensation value. However, the difference resulted from this system was not too far from the reference scales. This developed system had the average value of error percentage of 0.067% and the average value of accuracy of 99.93%.
No Name Original Weight (kg)
Weight on scale (kg)
Error in weight (%) en
Accuracy of weight (kg) An
1. >5yo child
1 7.7 7.68 0.25 99.74
2. >5yo child
2 6.8 6.8 0 100
3. >5yo child 3
15 15 0 100
4 >5yo child
4 13.4 13.38 0.14 99.85
5. >5yo child 5
18.8 18.79 0.053 99.94
6. >5yo child 6
19.1 19.1 0 100
7. >5yo child
7 12.4 12.4 0 100
8. >5yo child
1 17.2 17.19 0.058 99.94
9. >5yo child 8
11.8 11.79 0.08 99.91
Total Average Percentage ē =
1925
5. LIMITATIONS
The limitation of this study is that the sample used in the test is to use one sample in one POSYANDU group. Testing is emphasized on the performance side of the system that is on the performance side of the sensor load cell. The ability of sensors to detect weight and the speed of data transmission has become the main focus of this study.
6. CONCLUSION
From this research, it can be concluded that the weight measurement system using Arduino Uno had a maximum capacity of the load cell sensor of 40kg. The testing results on load cell and HC-05 module showed that the system performance was suitable with the referred measuring instrument and the time required for sending data was quite rapid (at a distance of 1 meter, the average time needed was 1.97 seconds and at a distance of 5 meters, the time required was 2.24 seconds). In direct testing as a whole, the device using a comparison scale obtained the results with the accuracy value of 99.93% and an error percentage of 0.067%.
The next research is that it can be done to improve system design so that the results of 100% accuracy can be obtained when measuring weight.
ACKNOWLEDGMENTS
This research has been funded by DRPM, Directorate General of Strengthening for Research and Development Ministry of Research, Technology, and Higher Education, Budget Year of 2018
REFERENCES
[1] A. Supriyanto, ‘The role of information technology for posyandu cadres in KIA data collection activities’, Pros. Semnasvoktek, pp. 360–365, 2017. [2] H. Andriani, C. Y. Liao, and H. W. Kuo,
‘Association of maternal and child health center (Posyandu) availability with child weight status in indonesia: A national study’, Int. J. Environ. Res. Public Health, vol. 13, no. 3, 2016.
[3] I. Brian, M. A. Riyadi, and Sudjadi, ‘Designing a Digital Weight and Height Measuring Instrument to Know the Body Mass Index (Bmi) in the Elderly’, Transient, vol. 4, no. 2, pp. 244–255,
2015.
[4] K. T. Martono and Y. Dharmawan, ‘The role of management information system in data surveillance of maternal and child health’, ICITACEE 2015 - 2nd International Conference on Information Technology, Computer, and Electrical Engineering: Green Technology Strengthening in Information Technology, Electrical and Computer Engineering Implementation, Proceedings, 2016. . [5] J. Duarte, G. E. Valencia, J. C. Gutierrez,
J. Guzman, and A. Porto, ‘Implementation of a fuel measurement system based on the gravimetric principle for applications in engine test bench’, Contemp. Eng. Sci., vol. 11, no. 76, pp. 3781–3788, 2018. [6] Pinout, ‘HX711 Datasheet – 24-Bit
Analog-to-Digital Converter – AVIA’, 2016. [Online]. Available:
https://datasheetspdf.com/pdf-file/842201/Aviasemiconductor/HX711/1. [Accessed: 21-Sep-2018].
[7] R. . Yadav and H. Vohra, ‘Design architecture and comparison of interactive smart button using HC-05 and ESP8266’, in 2017 International Conference on Computing, Communication and Automation (ICCCA), 2017, pp. 982–985. [8] ‘HC-05 - Bluetooth Module’, 2018.
[Online]. Available:
https://components101.com/wireless/hc-05-bluetooth-module. [Accessed: 25-Sep-2018].
[9] P. Teikari et al., ‘An inexpensive Arduino-based LED stimulator system for vision research’, J. Neurosci. Methods, vol. 211, no. 2, pp. 227–236, 2012. [10] A. D’Ausilio, ‘Arduino: A low-cost
![Table 2: Pin Configuration [8]](https://thumb-us.123doks.com/thumbv2/123dok_us/8899823.954457/4.612.96.286.382.549/table-pin-configuration.webp)