Effects of Hyperventilation on Venous-Arterial
Bicarbonate Concentration Difference: A Possible Pitfall in
Venous Blood Gas Analysis
Akira Umeda1*, Kazuteru Kawasaki2, Tadashi Abe3, Tateki Yamane1, Yasumasa Okada4
1
Department of Internal Medicine, International University of Health and Welfare, Shioya Hospital, Yaita, Japan; 2Department of Respiratory Medicine, National Center for Child Health and Development, Tokyo, Japan; 3Division of Respiratory Medicine, Depart-ment of Medicine, Tokai University School of Medicine, Isehara, Japan; 4Division of Internal Medicine, Murayama Medical Center, Musashimurayama, Japan.
Email: *[email protected]
Received November 19th, 2013; revised December 15th, 2013; accepted January 10th, 2014
Copyright © 2014 Akira Umeda et al. This is an open access article distributed under the Creative Commons Attribution License, which permits unrestricted use, distribution, and reproduction in any medium, provided the original work is properly cited. In accor-dance of the Creative Commons Attribution License all Copyrights © 2014 are reserved for SCIRP and the owner of the intellectual property Akira Umeda et al. All Copyright © 2014 are guarded by law and by SCIRP as a guardian.
ABSTRACT
Objectives: Recent reports on venous blood gas analysis have shown that venous bicarbonate concentration is useful in the evaluation of the body acid-base status. Most of these reports have been based on the Bland-Altman analysis comparing arterial and venous blood gas values. We intended to elucidate any factors that decrease the agreement between venous and arterial bicarbonate concentrations, which might impair the usefulness of venous blood gas analysis. Methods: Healthy volunteers and patients with various diseases (n = 141) were evaluated by simultaneous arterial and venous blood sampling and Bland-Altman analysis. The venous-arterial bicarbonate concentration differencewas compared between healthy volunteers and untreated respiratory alkalosis patients. Intentional hyperventilation (30 or 60 breaths/min, for 3 min) was also performed on 6 healthy volunteers and the venous-arterial bicarbonate concentration difference was evaluated. Results: The relative average bias in bicarbonate concentration was 2.00 mEq/l with venous bicarbonate higher than arterial bicarbonate with 95% limits of agreement of ±4.15 mEq/l. Hyperventilation challenges increased the venous-arterial bicarbonate con-centration difference in an intensity-dependent manner. The venous-arterial bicarbonate concon-centration differ-ence was higher in untreated respiratory alkalosis patients than in healthy volunteers (P < 0.01). Conclusion: Although venous bicarbonate may be useful to evaluate the body acid-base status, hyperventilation increases the venous-arterial bicarbonate concentration difference. Physicians should keep this phenomenon in mind.
KEYWORDS
Hyperventilation; Bicarbonate; Bland-Altman Analysis; Venous Blood Gas Analysis
1. Introduction
Since the pulse oximeter was invented and it became possible to evaluate the systemic oxygen level by mea- suring percutaneus oxygen saturation (SpO2), peripheral venous blood gas analysis (VBGA) with simultaneous SpO2 measurement has been considered useful as an al- ternative to arterial blood gas analysis (ABGA) [1-3]. In- deed, physicians are now widely and even routinely per-forming VBGA with SpO2 measurement instead of sampl-
ing arterial blood, because VBGA is much easier and less invasive than ABGA especially in the youngest pediatric patients and in an emergency room. The agreement between variables on arterial and venous blood gas analysis has been well reviewed [1]. The usual method to evaluate the agreement has been with the Bland-Altman analysis [4].
Previously we reported that intentional hyperventila- tion increased venous-arterial partial CO2 pressure (PCO2) differences and pH differences [2]. We also re- ported that underestimation of respiratory alkalosis may occur with the “SpO2 plus VBGA” method in untreated
(
HCO3)
−
measurements by the Bland-Altman analysis. The effects of intentional hyperventilation on the venous- arterial HCO3
−
difference were also evaluated. In addi- tion, the differences in healthy volunteers and in un-treated respiratory alkalosis patients were also compared.
2. Methods
2.1. Subjects
The present study was approved by the Ethics Commit- tees at Ohtawara Red Cross Hospital and the Internation- al University of Health and Welfare. 141 subjects (95 males and 46 females, ranging from 16 to 91 years of age) were enrolled in this study after we obtaining their informed consent. Among these 141 subjects, 11 healthy volunteers and 130 patients with various diseases were included. Among these 130 patients, 13 patients with hyperventilation with PaCO2 < 35 mmHg and arterial pH (pHa) > 7.45 without the treatment such as a paper bag re-breathing maneuver were included.
2.2. Blood Sampling and Gas Analysis
The brachial artery and the median vein were used for the blood sampling. Arterial and venous blood was sam- pled simultaneously with a small (1 ml) syringe contain- ing heparin, and was immediately analyzed with an au- tomatic blood gas analyzer (Rapidlab 840, Bayer Health- care, Leverkusen, Germany, or Rapidlab 1265, Siemens Healthcare Diagnostics, Sudbury, United Kingdom). Blood sampling from healthy volunteers was done first at rest and then immediately after hyperventilation. The venous-arterial HCO3
−
difference is hereafter termed
(
v a)
HCO3 −
− . End-tidal PCO2 (PETCO2) was measured with a gas analyzer (Respina IH26, NEC San-ei, Tokyo, Japan) [5].
Bicarbonate concentration was calculated by the fol-lowing equation:
(pH 6.105)
3 2
HCO− 0.0307 PCO 10 −
= × ×
2.3. Protocols of Loading Maneuvers
In order to look at the effects of hyperventilation, the subjects breathed room air at a fixed rapid rate for 3 min. The breathing rate was changed from resting (11 - 20 times per min) to 30 and then to 60 times per min. The timing of breathing was announced by a time keeper and the subjects followed his voice. The subjects were re- quested to keep the same tidal volume so that the PETCO2
2.4. Statistical Analysis
Values are expressed as mean ± standard deviation unless indicated. We tested the linear correlation for the bicar-bonate difference between ABGA and VBGA by the Spear- man rank method, and compared the differences by Bland- Altman analysis [4]. We used an analysis of variance with a Fisher post hoc multiple comparison for the eval-uation of repeated measures between resting and inten-tional hyperventilation. An unpaired t-test (two-tail) was used for the comparison between healthy volunteers and patients. P < 0.05 was considered statistically significant.
3. Results
3.1. Arterial and Venous Bicarbonate Concentration at Rest
The arterial and venous HCO3
−
data at rest (n = 141) are plotted in Figure 1. Data for both healthy volunteers and various patients are included. The relationship between the ABGA and VBGA was close for HCO3
−
(r = 0.897, P = 3.85 × 10−51, Figure 1(a)). Bland-Altman plots are shown in Figure 1(b). The relative average bias of HCO3
−
was 2.00 mEq/l with venous HCO3
−
higher than arterial HCO3
−
and 95% limits of agree- ment of ±4.15 mEq/l.
3.2. Effects of Intentional Hyperventilation on Venous-Arterial Bicarbonate Concentration Difference
In the resting condition,
(
v a)
HCO3 −
− was 1.73 ± 1.71 mEq/l (n = 6, Figure 2). Hyperventilation challenges in- creased
(
v a)
HCO3−
− in an intensity-dependent manner.
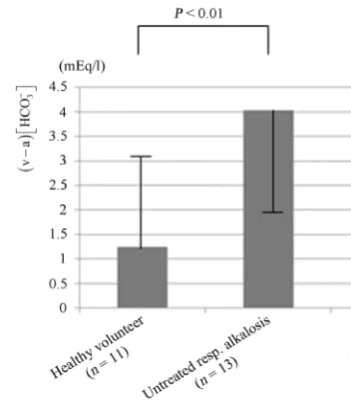
3.3. Venous-Arterial Bicarbonate Concentration Difference in Patients with Hyperventilation
The
(
v a)
HCO3 −
− data from healthy volunteers and from patients with untreated respiratory alkalosis (PaCO2 < 35 mmHg and pH > 7.45) are shown in Figure 3. It was found that
(
v a)
HCO3−
− was larger in the untreated patients (P = 0.0024).
4. Discussion
(a)
[image:3.595.66.282.96.387.2](b)
Figure 1. Blood gas data of healthy volunteers and patients with various diseases at rest (n = 141). (a) Relationship be-tween arterial bicarbonate concentration
(
a HCO −3)
andvenous bicarbonate concentration
(
v HCO −3)
is shown.−
3
v HCO = 0.891 × a HCO −3 + 5.08; r = 0.897, P = 3.85
× 10−51. There was a close correlation between a HCO −3
and v HCO −3. (b) Bland-Altman plots of HCO−3 data. Mean differences between arterial and venous data as well as 95% limits of agreement are shown. We cannot clearly say that the 95% limits of agreement are clinically very important, therefore we may be able to use v HCO −3 and
−
3
a HCO interchangeably considering the average difference.
have sufficient agreement to be clinically interchangeable for arterial values for patients in the emergency depart- ment [1,3]. On the other hand, agreement between arte- rial and venous PCO2 has been reported to be too poor and unpredictable in clinical usage as a one-off test, and PCO2 might be useful to screen for arterial hypercarbia or monitor trends in PCO2 for selected patients.
[image:3.595.329.518.96.283.2]In untreated hyperventilation patients, we reported that the “VBGA plus SpO2” method may lead to underesti- mation or misdiagnosis of respiratory alkalosis [2]. We speculated that the phenomenon could be attributed to the increase in the differences in venous-arterial PCO2 and pH in the acute phase of hyperventilation. We also
Figure 2. Intensity-response relationship between the level of hyperventilation and the venous-arterial bicarbonate con-centration difference
(
(
v−a)
HCO−3)
. The breathing rate was changed from resting (11 - 20 times per min) to 30 and then to 60 times per min. Hyperventilation (Hyperv.) in-creased(
v−a)
HCO−3 in an intensity-dependent manner (n = 6). Error bars: SD.Figure 3. The venous-arterial bicarbonate concentration
difference
(
(
v−a)
HCO−3)
data in patients with hyper-ventilation.(
v−a)
HCO−3 data were compared betweenhealthy volunteers (n = 11) and untreated respiratory alka-losis patients (n = 13). In untreated respiratory alkaalka-losis patients,
(
v−a)
HCO−3 was increased (P = 0.0024). Error bars: SD. [image:3.595.332.508.388.590.2]and hypotension [2,6].
Here we evaluated
(
v a)
HCO3 −
− in hyperventilation and found that
(
v a)
HCO3−
− increases after the 3 min hyperventilation challenge in an intensity-dependent man- ner (Figure 2).
(
v a)
HCO3−
− also increased in untreated respiratory alkalosis patients (Figure 3). The time course of
(
v a)
HCO3−
− after hyperventilation has not been well studied. Nevertheless, we suppose that
(
v a)
HCO3−
− is increased in the acute phase of hyperventilation (in the same time of developing respiratory alkalosis), but
(
v a)
HCO3 −
− might decrease more swiftly than the nor- malization of respiratory alkalosis in arterial blood gas data. We experienced some already treated respiratory alkalosis patients using a paper-bag rebreathing maneuv- er without an increase in
(
v a)
HCO3−
− (data not shown). Further investigation is needed to confirm this.
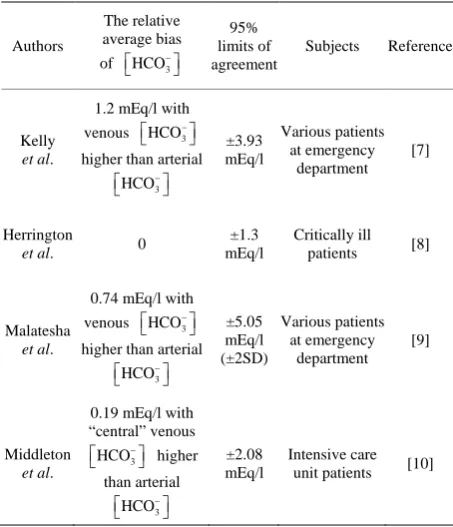
As for the Bland-Altman analysis data, our results for
3
HCO−
are similar to previous reports [7-9] (Table 1). The authors wrote that the agreement was acceptably narrow. Nevertheless, we feel that the 95% limits of agreement of ±5.05 mEq/l [9] are not so narrow. We
Table 1. Previously reported Bland-Altman analysis data comparing arterial and venous HCO−3.
Authors
The relative average bias
of HCO3
− 95% limits of agreement
Subjects Reference
Kelly
et al.
1.2 mEq/l with venous HCO3
−
higher than arterial
3 HCO− ±3.93 mEq/l Various patients at emergency department [7] Herrington
et al. 0
±1.3 mEq/l
Critically ill patients [8]
Malatesha
et al.
0.74 mEq/l with venous HCO3
−
higher than arterial
3 HCO− ±5.05 mEq/l (±2SD) Various patients at emergency department [9] Middleton
et al.
0.19 mEq/l with “central” venous
3
HCO−
higher than arterial 3 HCO− ±2.08 mEq/l Intensive care unit patients [10]
or not important). Our feeling is intermediate on this. Anyway, peripheral venous HCO3− seems to be useful.
As for the comparison between the arterial blood and “central” venous blood, Middleton et al. reported similar data [10] (Table 1).
Our report is the first that addresses how hyperventi- lation increases the difference between arterial and ven- ous bicarbonate concentration. Physicians should keep this phenomenon in mind when performing venous blood gas analysis.
REFERENCES
[1] A. M. Kelly, “Review Article: Can Venous Blood Gas Analysis Replace Arterial in Emergency Medical Care,”
Emergency Medicine Australasia, Vol. 22, No. 6, 2010, pp. 493-498.
http://dx.doi.org/10.1111/j.1742-6723.2010.01344.x [2] A. Umeda, K. Kawasaki, T. Abe, et al., “Hyperventilation
and Finger Exercise Increase Venous Arterial PCO2 and pH Differences,” American Journal of Emergency Medi-cine, Vol. 26, No. 9, 2008, pp. 975-980.
http://dx.doi.org/10.1016/j.ajem.2007.12.001
[3] B. L. Lim and A. M. Kelly, “A Meta-Analysis on the Utility of Peripheral Venous Blood Gas Analyses in Ex-acerbations of Chronic Obstructive Pulmonary Disease in the Emergency Department,” European Journal of Emer- gency Medicine, Vol. 17, No. 5, 2010, pp. 246-248. http://dx.doi.org/10.1097/MEJ.0b013e328335622a [4] J. M. Bland and D. G. Altman, “Statistical Methods for
Assessing Agreement between Two Methods of Clinical Measurement,” Lancet, Vol. 1, No. 8476, 1986, pp. 307- 310. http://dx.doi.org/10.1016/S0140-6736(86)90837-8 [5] Y. Okada, T. Satoh, S. Kuwana, et al., “Electrical
Stimu-lation of the Rabbit Pulmonary Artery Increases Respira-tory Output,” Respiratory Physiology & Neurobiology, Vol. 140, No. 3, 2004, pp. 209-217.
http://dx.doi.org/10.1111/j.1742-6723.2004.00642.x [6] F. Shirani, R. Salehi, A. E. Naini, et al., “The Effects of
Hypotension on Differences between the Results of Si-multaneous Venous and Arterial Blood Gas Analysis,”
Journal of Research in Medical Sciences, Vol. 16, No. 2, 2011, pp. 188-194.
[7] A. M. Kelly, R. McAlpine and E. Kyle, “Agreement be-tween Bicarbonate Measured on Arterial and Venous Blood Gases,” Emergency Medicine Australasia, Vol. 16, No. 5-6, 2004, pp. 407-409.
http://dx.doi.org/10.1111/j.1742-6723.2004.00642.x [8] W. G. Herrington, H. J. Nye, M. S. Hammersley, et al.,
“Are Arterial and Venous Samples Clinically Equivalent for the Estimation of pH, Serum Bicarbonate and Potas-sium Concentration in Critically Ill Patients?” Diabetic Medicine, Vol. 29, No. 1, 2012, pp. 32-35.
[image:4.595.58.285.473.737.2][9] G. Malatesha, N. K. Singh, A. Bharijia, et al., “Compari-son of Arterial and Venous pH, Bicarbonate, PCO2 and PO2 in Initial Emergency Department Assessment,” Emer-
gency Medicine Journal, Vol. 24, No. 8, 2007, pp. 569- 571. http://dx.doi.org/10.1136/emj.2007.046979
[10] P. Middleton, A. M. Kelly, J. Brown, et al., “Agreement between Arterial and Central Venous Values for pH, Bi-carbonate, Base Excess, and Lactate,” Emergency Medi-cine Journal, Vol. 23, No. 8, 2006, pp. 622-624.
![The Intracellular pH of a Molluscan Smooth Muscle During a Contraction Catch Relaxation Cycle Estimated by the Distribution of [14C]DMO and by 31P NMR Spectroscopy](data:image/gif;base64,R0lGODlhAQABAIAAAP///wAAACH5BAEAAAAALAAAAAABAAEAAAICRAEAOw==)