Impact Factor: 5.515
Cluster Analysis of Cyber Crime Data using R
Radha Mothukuri
1, Dr. Bobba Basaveswara Rao
2 1, 2Dept of CSE
1Research Scholar of Acharya Nagarjuna University,Guntur, Andhra Pradesh, India 2
Research Supervisor for Acharya Nagarjuna University,Guntur, Andhra Pradesh, India
Abstract- Cluster analysis divides the data into groups that are meaningful, useful or both. It is also used as a starting point for other purposes of data summarization. This paper discuss some very basic algorithms like K-means, Fuzzy C-K-means, Hierarchical clustering to come up with clusters, and use R data mining tool. The results are tested on the datasets namely Online News Popularity, Cyber Crime Data Set data analysis. All datasets was analyzed with different clustering algorithms and the figures we are showing is the working of them in R data mining tool. Every algorithm has its uniqueness and antithetical behavior.
Keywords: k-means algorithm, fuzzy c-means algorithm, hierarchical clustering algorithm, R tool.
I.
INTRODUCTION
Cluster analysis divides data into meaning full groups (clusters) which share common characteristics i.e. same cluster are similar to each other than those in other clusters. It is the study of automatically finding classes. A web page especially news articles which are flooded in the internet have to be grouped. The clustering of these different groups is a step forward towards the automation process, which requires many fields, including web search engines, web robots and data analysis.
Any new web page goes through numerous phases including data acquisition, preprocessing, Feature extraction, classification and post processing into the database. Cluster analysis can be regarded as a form of the classification which creates a labeling of objects with class labels. However it derives these labels only from the data. Data mining functionalities are the Characterization and discrimination, mining frequent patterns, association, correlation, classification and prediction, cluster analysis, outlier analysis and evolution analysis [1].
Clustering is a vivid method. The solution is not exclusive and it firmly depends upon the analysts’ choices. Clustering always provides groups or clusters, even if there is no predefined structure. While applying cluster analysis we are contemplating that the groups exist. But this speculation may be false. The outcome of clustering should never be generalized. [9].
II.
R TOOL
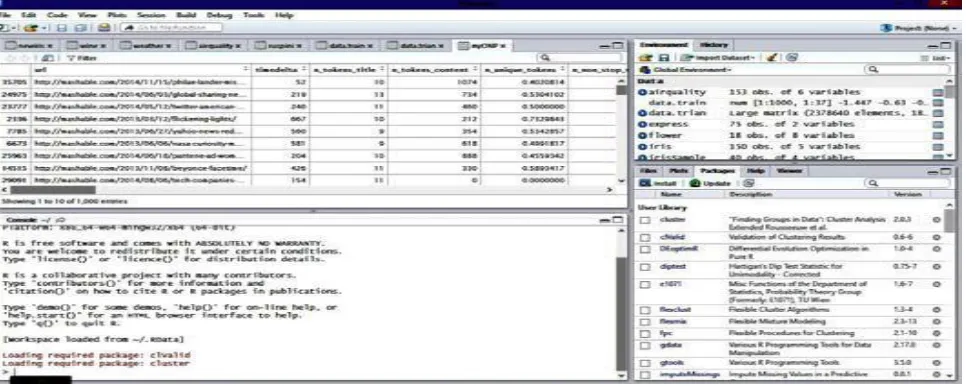
Impact Factor: 5.515 R is public domain software primarily used for statistical analysis and graphic techniques [10]. A core set of packages is included with the installation of R, with more than 7,801 additional packages (as of January 2016[update]) available at the Comprehensive R Archive Network (CRAN), Bio conductor, Omegahat, Git Hub, and other repositories.[14] R tool provides a wide class of statistical that includes classical statistical tests, linear and nonlinear modeling, classification, time-series analysis, clustering and various graphical functions.[13]R uses collections of packages to perform different functions [11]. CRAN project views provide numerous packages to different users according to their taste. R package contain different functions for data mining approaches. This paper compares various clustering algorithms on datasets using R which will be useful for researchers working on medical data and biological data as well. For this IDE, R Studio is used refer the below Figure 1.
Fig 1: R tool Studio
III.
Literature Survey
Impact Factor: 5.515 machines, and Bayesian networks. This paper focuses on a type of classification model that is based on K-means clustering algorithm. K-means is the most popular clustering algorithm. It is very efficient and very easy to implement. Besides being used as a clustering technique, K-means has also been adapted for data classification.
Ying zhao, George karypis [2] describe a fast and high-quality document clustering algorithms play an important role in providing intuitive navigation and browsing mechanisms by organizing large amounts of information into a small number of meaningful clusters. In particular, clustering algorithms that build meaningful hierarchies out of large document collections are ideal tools for their interactive visualization and exploration as they provide data-views that are consistent, predictable, and at different levels of granularity. This paper focuses on document clustering algorithms that build such hierarchical solutions and (i) presents a comprehensive study of partition and agglomerative algorithms that use different criterion functions and merging schemes. (ii) presents a new class of clustering algorithms called constrained agglomerative algorithms, which combine features from both partition and agglomerative approaches that allows them to reduce the early-stage errors made by agglomerative methods and hence improve the quality of clustering solutions.
Chun-Nan Hsu, Han-Shen Huang , Bo-Hou Yang [3] describe the Expectation-Maximization (EM) algorithm is one of the most popular algorithms for data mining from incomplete data. However, when applied to large data sets with a large proportion of missing data, the EM algorithm may converge slowly. The triple jump extrapolation method can effectively accelerate the EM algorithm by substantially reducing the number of iterations required for EM to converge.
IV.
Related Work
DATA PREPARATION
DATA PRE-PROCESSING
Data pre-processing [20] is a data mining technique that involves transforming raw data into an understandable format. Often the data is unstructured, inconsistent, has missing values, and lack in certain behaviour or trends that gives many errors. Therefore, it needs to be cleaned, integrated, transformed, and hence reduced. Cleaning fills in the missing values and removes noise.
Integration take the data cubes or chunks together using multiple databases. Transformation uses normalization and aggregates the data and Reduction helps in decreasing the volume of data keeping similar analytical results.
Impact Factor: 5.515 For clean data, removal of missing values was needed to get an appropriate crime data set. Initially, columns that had these missing values or sparse values were deleted as undefined values would have a negative impact on the accuracy of the model. For dirty data, the missing data of a feature were converted into median value of that feature. For predicting feature, „Per Capita Violent Crimes‟, a new column called „High Crime‟ was created that had a value „1‟ for Per Capita Violent Crime‟ greater than 0.1 and „0‟ otherwise. The threshold of 0.1 was decided upon manual analysis of data by view-through process. All the features had to be predicted using this target feature „High crime‟.
Crime pattern Analysis
The data mining is data analyzing techniques that used to analyze crime data beforehand stored from various resources to find patterns and trends in crimes. In additional, it can be applied to enlarge efficiency in solving the crimes quicker and also can be applied to automatically advise the crimes. Crime preclusion and revealing become an important trend in crime and a very challenging to solve crimes. Several studies have discovered various techniques to solve the crimes that used too many applications. Such studies can help to speed up the process of solving crime and help the huge data are very difficult and complex.
Objective
I. Crime prevention and detection become an important trend in crime and a very challenging to solve crimes.
II. The data used for analysis require the accuracy and sufficiency.
III. This proposed system focuses on Traffic Violation and Border Control, Violent Crime, the Narcotics, Cyber Crime.
IV. Issues and challenges on crime are Data Collection and Integration, Crime Pattern, Performance, Visualization.
V.
Proposed Work
After preprocessing we can use various clustering algorithms
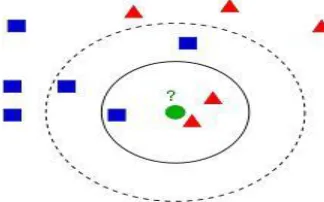
K-NEAREST NEIGHBORS ALGORITHM
The k-Nearest Neighbors algorithm (k-NN) is a non-parametric technique utilized for classification and regression. In both cases, the input consists of the k closest training exemplar in the characteristic space.
Impact Factor: 5.515
In k-NN regression, the k-NN algorithm is used for estimating continuous variables. One such algorithm uses a weighted average of the k nearest neighbors, weighted by the inverse of their distance. This algorithm works as follows:
1. Compute the Euclidean distance from the query example to the labeled examples. 2. Order the labeled examples by increasing distance.
K-NN Algorithm
Input: Crime Data, Watermark Data
Output: Modified Crime Observation Data
1. Add the Crime Profiles (P).
2. Add the Crime Observation Data (O). 3. Enter watermark content (W).
4. Convert the watermark data to bytes and find the length of watermark data (L).
5. Sort the Crime Observation Data (O) Crime wise. 6. I=0
7. For Each Crime‟s Observation Set in (O)
8. Alter the Observation Data‟s third value such that OD(3) = 301 + W(I) 9. Change the OD(1) position = OD(1) position + W(I)
10. I=I+1
11. If I>=L Then 12. Break 13. End If 14. Next
15. Output the New Crime Data Set.
Input: Modified Crime Observation Data
Output: Crime Observation Data, Extracted Watermarked Data
1. Select the Crime Data Set (where Watermark Data Embedded) (P). 2. I=0;
Impact Factor: 5.515 7. L= W(I)
8. End If
9. I=I+1 10. If I >L Then 11. Break 12. End If 13. Next
14. Convert the watermark bytes to data. 15. Check the KNN Property.
16. Output Watermark Data.
Result Analysis
Now we can take input data set
We can take 200 papers charters details dataset
After data preprocessing
Impact Factor: 5.515
From the 14434 terms that we started with, we are now left with a TDM which considers on 4
commonly occurring terms.
Term frequency
Impact Factor: 5.515
Sttf with 186 documents and terms
Conclusion
Impact Factor: 5.515
References
[1]. J. Han and M. Kamber, Data Mining: Concepts and Techniques, second ed. Morgan Kaufmann, 2006.
[2]. C.C. Aggarwal and P.S. Yu, “Finding Generalized Projected Clusters in High Dimensional Spaces,” Proc. 26th ACM SIGMOD Int‟l Conf. Management of Data, pp. 70-81, 2000.
[3]. K. Kailing, H.-P. Kriegel, P. Kro ¨ger, and S. Wanka, “Ranking Interesting Subspaces for Clustering High Dimensional Data,” Proc.Seventh European Conf. Principles and Practice of Knowledge Discovery in Databases (PKDD), pp. 241-252, 2003.
[4]. K. Kailing, H.-P. Kriegel, and P. Kro ¨ger, “Density-Connected Subspace Clustering for High-Dimensional Data,” Proc. Fourth SIAM Int‟l Conf. Data Mining (SDM), pp. 246-257, 2004.
[5]. E. Mu ¨ ller, S. Gu ¨nnemann, I. Assent, and T. Seidl, “Evaluating Clustering in Subspace Projections of High Dimensional Data,” Proc. VLDB Endowment, vol. 2, pp. 1270-1281, 2009.
[6]. E. Agirre, D. Martı´nez, O.L. de Lacalle, and A. Soroa, “Two Graph-Based Algorithms for State-of-the-Art WSD,”Proc. Conf.Empirical Methods in Natural Language Processing (EMNLP), pp. 585-593, 2006.
[7]. K. Ning, H. Ng, S. Srihari, H. Leong, and A. Nesvizhskii, “Examination of the Relationship between Essential Genes in PPI Network and Hub Proteins in Reverse Nearest Neighbor Topology,” BMC Bioinformatics,vol. 11, pp. 1-14, 2010.
[8]. D. Arthur and S. Vassilvitskii, “K-Means++: The Advantages of Careful Seeding,”Proc. 18th Ann. ACM-SIAM Symp. Discrete Algorithms (SODA),pp. 1027-1035, 2007.
[9]. I.S. Dhillon, Y. Guan, and B. Kulis, “Kernel k-Means: Spectral Clustering and Normalized Cuts,”Proc. 10th ACM SIGKDD Int‟lConf. Knowledge Discovery and Data Mining,pp. 551-556, 2004.