Impact Factor: 4.123
©2017, IJCSMA All Rights Reserved, www.ijcsma.com 131
STEPWISE REGRESSION BASED SUPPORT
VECTOR MACHINE FOR STABLE AND
CONSISTENT DATA DELIVERY IN WSN
Mr. A.SRIDHAR
Research Scholar Dept. of Computer Science Dravidian University, Kuppam, A.P., India.
Email: [email protected].
Dr. C.CHANDRASEKAR
Professor
Dept. of Computer Science Periyar University, Salem, T.N., India.
Email: [email protected].
ABSTRACT ___ Wireless Sensor Networks (WSNs) plays an important function with self-organized and structure-less wirestructure-less networks for data delivery. With different routing protocols, efficient route path is selected by using
the stable links. The establishment of stable network topology ensures communication effectiveness without any
disconnection or disruption, for providing reliable data transmission. But, present network protocol modifies the
route path considerably due to different interferences and environmental changes. Though, it obtains minimum
data stability. Therefore, Stepwise Regression based Support Vector Machine (SR-SVM) technique is introduced
to improve stable and consistent data delivery in WSN. Stepwise Regression technique and Support Vector
Machine are the two process involved in proposed SR-SVM technique. At first, Stepwise Regression technique is
used to examine the neighbouring node and select the target node. Based on neighbouring node, energy efficient
neighbouring node is detected to attain a stable data delivery with minimum energy consumption in network.
With the help of detected energy node, target node is selected for efficient wireless communication. After that,
consistent data delivery is attained in network through link quality measure by using Support Vector Machine
(SVM). Here, the link quality of the neighbouring nodes is considered to choose the optimal route by minimizing
the distance function. In addition, convex hull of the two classes is used in geometric representation of SVM.
Here, the number of hop between source and sink nodes are determined. This helps to improve link quality and
network consistency with reduced data packet loss. The performance of SR-SVM technique is evaluated with
parameters such as throughput, energy consumption, data loss rate, and average time. The experimental result
shows that SR-SVM technique achieves higher throughput and better energy consumption when compared to
state-of-the-art-works.
Impact Factor: 4.123
©2017, IJCSMA All Rights Reserved, www.ijcsma.com 132
1. INTRODUCTION
Wireless sensor networks attain stable and high consistent data delivery with the required
performance of data communication. The improvement of consistent wireless network
communication provides better communication with reduced data loss and delay during data
transmission between the sensor nodes. Here, Stable and unstable links were distinguished.
Therefore, the several research works has been established in WSN for stable and consistent data
delivery. It is explained with the help of literature work as follows.
Competence-enhanced and Maintenance Distance Vector (MC-DV) framework was
considered in [1] to develop the performance of network with feedback control. With the aid of
every link, transmission power and retransmission were adjusted to attain higher delivery ratio.
Kautz-based Real-time, Fault-tolerant and EneRgy-efficient WSAN (REFER) was discussed in
[2] to get real-time communication. It includes multi-path based routing and energy-efficient to
improve network performance. Though, the delay is increased with minimum network lifetime.
A multihop wireless routing protocol named as E-STAR was developed in [3] systems to
enhance the performance of routing with high consistency and stability. It increases the packet
delivery ratio and network lifetime. But, it fails to enhance the link stability. In [4], Enhance
Threshold Sensitive Stable Election Protocol (ETSSEP) was considered to improve the stability
of routing with increased network lifetime. Though, it considers only stability and failed to
improve the reliability of network.
Unequal redundancy level (URL) data collection scheme was designed in [5] to attain
reliable data communication. With the assist of network coding-based mechanism, energy
consumption is balanced at both non-hotspot areas and hotspot areas. But, delay was increased.
Data Routing for In-Network Aggregation (DRINA) was presented in [6] to provide reliable
routing. Here, data fusion and aggregation is avoided to preserve the energy during
communication. Thus, it reduces energy consumption. But, network throughput is not
Impact Factor: 4.123
©2017, IJCSMA All Rights Reserved, www.ijcsma.com 133
Power Emission Density (PED)-based interference modeling method was designed in [7]
for enabling accurate network settings. Sector-based resources allocation scheme is used to
enhance the throughput rate. But, it resulted with higher energy consumption to the desired level.
In [8], double level-low-energy adaptive clustering hierarchy (DL-LEACH) algorithm was
discussed to determine node energy and to select cluster head for minimum energy consumption.
However, the consistency of data transmission was not improved.
Local Uniform Rate Service (LURS) was implemented in [9] which are known as
calculus framework to improve energy efficiency. Based on backlogged data and delay
restrictions, better energy is maintained along with scheduling cycle. But, data stability is not
maintained properly. In [10], Energy-efficient multi-layer MAC (ML-MAC) protocol was
introduced to reduce the energy consumption with minimum collisions and retransmission. But,
energy efficiency is high. The issues presented in the existing literature such as lower network
throughput and energy consumption. In order to overcome such issues, Stepwise Regression
based Support Vector Machine (SR-SVM) technique is introduced in WSN. The main
contribution of the research work is described as follows,
To improve stable and consistent data delivery, Stepwise Regression based Support Vector Machine (SR-SVM) technique is introduced. Initially, Stepwise
Regression technique is applied to select a target node by monitoring the
neighbouring node and thus it achieve stable data delivery. With the support of
target node, energy consumption is minimized.
Next, Support Vector Machine (SVM) is used in SR-SVM technique to improve
the consistency of network during data delivery through link quality measure. The
optimal route path is selected by measuring the link quality of the neighbouring
nodes. The convex hull of two classes in geometric representation of SVM is used
Impact Factor: 4.123
©2017, IJCSMA All Rights Reserved, www.ijcsma.com 134
The rest of the paper is structured as follows: In Section 2, Stepwise Regression based
Support Vector Machine (SR-SVM) technique is described with neat diagram. In Section 3,
simulation settings are provided with the analysis of results explained in Section 4. In Section 5,
introduces the related works. The conclusion of the research work is presented in section 6.
2. STEPWISE REGRESSION BASED SUPPORT VECTOR MACHINE TECHNIQUE
The Wireless Sensor Network is designed for enhancing the data delivery ratio to the one
hop neighbour with efficient energy of sensor nodes. The sensor node determines target node
(i.e. one hop neighbouring node) to achieve improved network stability and consistency with
minimum energy consumption. Therefore, an efficient data packet delivery is obtained with
minimum delay, energy consumption and less hop count for improving the sensor node
communication. Therefore, Stepwise Regression based Support Vector Machine (SR-SVM)
technique is proposed to attain stable and consistent data delivery.
A system model for proposed SR-SVM technique is considered to achieve stable and
consistent data delivery in WSN. Let us consider, a wireless sensor network which comprises of
a graph „ ‟ where „ ‟ denotes a number of sensor nodes and „ ‟ denotes edge i.e. links between the nodes in a sensing rectangular area „ ‟ in a communicate range „ ‟. Let „ ‟ is the set of neighbour‟s node. The sensor nodes develop the necessary
transmission range to execute stable and consistent data delivery in WSN. Based on the system
model, the performance analysis of proposed SR-SVM technique is carried out. The architecture
Impact Factor: 4.123
©2017, IJCSMA All Rights Reserved, www.ijcsma.com 135
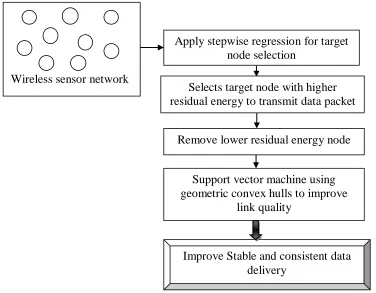
Figure 1 Architecture Diagram of Stepwise Regression based Support Vector Machine
technique
Above figure 1 illustrates the architecture diagram of the Stepwise Regression based
Support Vector Machine (SR-SVM) learning technique. Here, WSN consists of different
numbers of sensor nodes. The SR-SVM technique includes two processes such as stepwise
regression and support vector machine using geometric convex hulls. Initially, Stepwise
Regression is used for selecting the target node in network to achieve improved data packet
delivery in WSN. Based on the energy of each sensor node, the target node (i.e. neighbouring
node) is selected. The data packets are transmitted when the residual energy is higher during
selection of target node. After that, support vector machine using geometric convex hulls is
introduced to improve link quality. It reduces the nearest point difficulty which directs to
efficient solution for geometric representation of SVM thereby reducing the data loss and Apply stepwise regression for target
node selection
Selects target node with higher residual energy to transmit data packet
Support vector machine using geometric convex hulls to improve
link quality
Improve Stable and consistent data delivery
Impact Factor: 4.123
©2017, IJCSMA All Rights Reserved, www.ijcsma.com 136
average time for next hop selection. As a result, proposed SR-SVM technique achieves stable
and consistent data delivery in WSN.
2.1 Stepwise Regression for target node selection
An efficient target node selection is carried out through stepwise regression technique to
obtain improved stability on data. In sensor network, both link stability and node stability is
important to improve the consistent data delivery in WSN. Thus, it is achieved by using stepwise
regression technique. Regression is a geometric measure to establish the strength of correlation
between one dependent variable (i.e. nodes) and a sequence of independent variables (i.e. nodes).
There are two significance processes namely variable selection and removal. Based on the
energy utilization of sensor node, process is carried out. During this process, higher residual
energy is selected as a target node for data packet transmission. When there is a lower residual
energy, then the node is removed and it helps to avoid the path failure in network. Hence, the
link stability is improved while broadcasting the data packets.
Let us consider, the number of sensor nodes „ ‟ and the transmitting and
receiving energy of the node are measured. The energy of the node is measured in terms of
power and time as given below.
(1)
From (1), energy of node is measured with power „ ‟ and time in seconds. The energy of
each node is measured in joules. The transmitting energy of a node is calculated as follows.
(2)
From (2), a transmitting energy „ ‟ is measured using transmission power represented
as „ ‟, a size of data packet given as „ ‟ and the bandwidth denoted as „ ‟. Thus, it
determines the amount of data packet is transmitted in a fixed amount of time. The energy
consumption of receiving a data packet is calculated as following.
Impact Factor: 4.123
©2017, IJCSMA All Rights Reserved, www.ijcsma.com 137
From (3), a receiving energy is specified as „ ‟ and „ ‟ denotes a receiving power.
After that, the total energy of sensor node is measured using following equation.
(4)
A total energy of a node „ ‟ is measured using (4). In order to select the target node,
residual energy is necessary for improving the link stability while broadcasting the data packets
and it determines the node energy. The residual energy of sensor node is estimated as,
(5)
From (5), the residual energy „ ‟ is measured using the initial energy „ ‟ and the total energy „ ‟ required for transmitting and receiving energy. Then the threshold is assigned for
selecting the target node (i.e. neighbour node).
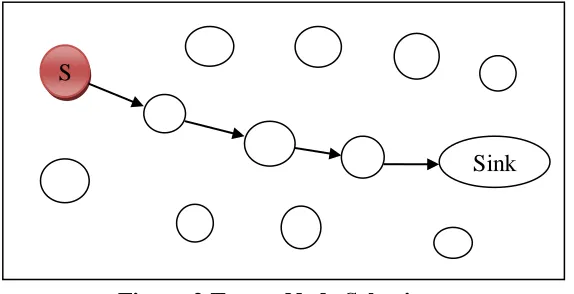
Figure 2 Target Node Selections
As shown in figure 2, the source node (S) selects neighbouring node as a target node with
higher residual energy to execute data delivery. Stepwise Regression technique is used in
SR-SVM technique to select a dependent sensor node as a target node and remove the independent
nodes based on residual energy. As a result, a better target node in network is selected for
efficient data packet transmission. S
Impact Factor: 4.123
©2017, IJCSMA All Rights Reserved, www.ijcsma.com 138
// Stepwise Regression based target node selection
Input: Sensor nodes , Data Packet „
Output: Target node selection to improve throughput and minimize energy consumption
Step 1:Begin
Step 2: For each sensor node in network
Step 3: Measure transmitting and receiving energy of node using (2) (3)
Step 4: Computeresidual energy of sensor node using (5)
Step 5: If ( RE then
Step 6: Select the target node for transmitting data packets to sink node
Step 7: Else
Step 8: Removes the node which has lowerresidual energy
Step 9: End If
Step 10: End For
Step 11: End
Algorithm 1 Stepwise Regression based target node selection
Stepwise Regression based target node selection algorithm is described in above
algorithm 1. For each sensor node, transmitting and receiving energy is measured. Then, the
residual energy of sensor node is calculated for selecting their one hop neighbouring node by
comparing with threshold value. If residual energy of the node is higher than the threshold value,
the node is selected as target node to perform data delivery. Otherwise, when there is a lesser
residual energy, then the sensor node is removed. This helps to improve the throughput and
reduce the energy consumption.
2.2 Geometric representation of Support vector machine learning technique
Next, Support Vector Machine (SVM) learning technique is applied to improve the
network consistency by measuring the link quality. It reduces the transmission range and
multiple hops between the nodes in network. When there is higher link quality, data packets are
transmitted with neighbouring nodes and consistency is improved with one-hop communication.
Impact Factor: 4.123
©2017, IJCSMA All Rights Reserved, www.ijcsma.com 139
group of sensor nodes. From the samples, „ ‟ indicates sensor nodes and „ ‟ indicates output
results. The output of SVM is described as „ ‟. Based on convex set, convex hull
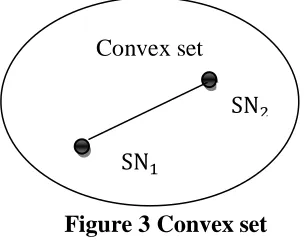
and extreme point set, geometric representation of SVMs is performed. At first, convex set is
shown in figure 3 with a set of points (i.e. sensor nodes) where any two sensor nodes and
are connected and the line denotes a connection of two nodes lies totally within the set.
Figure 3 Convex set
Secondly, Convex Hull in figure 4 provides a set of points (i.e. nodes) in the Euclidean
plane. Formally, the convex hull of the set is the smallest convex polygon that includes the
number of nodes of it.
Figure 4 Convex hull
Finally, an extreme point of a convex set „S‟ is a point which does not lie in any open line
section combining two points. As the number of node increases, SVM learning technique uses
convex hulls to control the nodes and to avoid limited transmission range problems. The
geometric SVMs are applied using geometric convex hulls to improve the link quality. The
convex hull of a finite set „S‟ is defined as a set of combination with all convex and each point „ (i.e. nodes) is assigned as a weight to determine average weighted points. A SVM is a
discriminative classifier which is described by a separating hyperplane. It bisects the straight
vector joining the convex hulls of the positive and negative polarity points. The geometric Convex set
Impact Factor: 4.123
©2017, IJCSMA All Rights Reserved, www.ijcsma.com 140
representation of the SVM is described in a separable case. Here, additional nodes do not disturb
the final solution unless they redefine the margin of the hyperplane. The margin which is above
and below the hyperplane is defined as follows,
⃗⃗ ⃗ (6)
⃗⃗ ⃗ (7)
From (6), (7), and defines a margins of two classes, ⃗⃗ denotes a weight vector,
denotes a set of points (i.e. nodes) and ⃗ denotes a bias. Therefore, an optimal hyperplane is
described as the set of points and given as below.
⃗⃗ ⃗ (8)
Therefore, convex hull of the two classes are defined as,
{∑ | ∑ } (9)
{∑ | ∑ } (10)
From (9) and (10), an average weight of each point is denoted as „ ‟ in the convex hull.
With the aid of geometric representation of SVMs, optimal node is selected and determining the
two closet nodes as the optimization functions. As a result, an efficient route path is identified for
link quality measurement and attains consistent network communication. Next, the data packet is
transmitted to next hop node by finding the closest node. Hop node is defined as intermediate
nodes between sources and sink node and it reduces the hop distance with minimum time. Thus,
the two closest nodes as the optimization functions are defined as follows.
‖∑ ∑ ‖ (11)
Such that, ∑ =1, ∑ =1,
The decision boundary is considered as f(x) = ⃗⃗ ⃗ to be the perpendicular
Impact Factor: 4.123
©2017, IJCSMA All Rights Reserved, www.ijcsma.com 141
(∑ ∑ ) (12)
(∑ ∑ ) (13)
From (12) and (13), lies along the line section and denotes a midpoint of the line
section. By rescaling the objective function, the output class labels „ ‟ is attained.
Therefore it is formularized as,
‖ ‖ ∑ (14)
The decision function by using the convex hull is attained as follows
∑ +b (15)
The sign of the decision function f (x) find whether data point „x‟ lies on the positive or
negative side of boundary and f (x) = 0 denotes a border line. Therefore, the node located in
boundary and other problems are avoided by the convex hull of the geometric representation of
the SVM. The algorithmic explanation of the SVM learning technique is described as follows.
Input : Data points i.e. Sensor nodes , weight , output function
Output: Improve the networkConsistency with minimum data loss and average hop
count
Step 1: Begin
Step 2: For all sensor node in network
Step 3: Convex hull of two classes is defined using (9) (10)
Step 4: Find two closest points by minimizing the distance formula using (11)
Step 5: Measure the objective function using (14)
Step 6: Measure the decision function using convex hull (15) for avoiding limited
Impact Factor: 4.123
©2017, IJCSMA All Rights Reserved, www.ijcsma.com 142
Step 7: Sensor Nodes closest distance are selected to improve link quality for
transmitting data packet
Step 8: End for
Step 9:End
Algorithm 2 Support Vector Machine learning algorithm
From above algorithm, the consistence of network is improved for reducing the data
packet loss and time for next hop selection. At first, convex hull reduces limited transmission
range problem in separable case and minimizing the distance function. Based on the node
distance, the link quality is improved. Therefore, the data packet is transmitted along the route
and reduces the data packet loss. As a result, the SR-SVM Technique efficiently improves the
stable and consistent data delivery in WSN.
3. SIMULATION SETTINGS
The proposed Stepwise Regression based Support Vector Machine (SR-SVM) technique
is simulated using NS-2 simulator with the network range of 1200*1200 m size. Destination
Sequence Based Distance Vector (DSDV) is used as routing protocol to conduct the
experimental work. It consists of different 100 nodes and 90 data packets with varies sizes ranges
between 100 to 1000 KB. The mobility of the sensor node is about 10 m/s with simulation rate of
45 milliseconds for data transmission.
4. RESULTS AND DISCUSSION
Result analysis of Stepwise Regression based Support Vector Machine (SR-SVM)
technique is discussed and compared with two existing methods. The compared existing methods
are namely Competence-enhanced and Maintenance Distance Vector (MC-DV) [1] and A
Kautz-based REal-time, Fault-tolerant and EneRgy-efficient WSAN (REFER) [2]. The performance
Impact Factor: 4.123
©2017, IJCSMA All Rights Reserved, www.ijcsma.com 143
average time for stable and consistent wireless network communication. The performance of
SR-SVM technique is described with the help of tables and graphs.
4.1 Performance analysis of Throughput
The ratio of number of data packets received at the sink node according to the total data
packets transmitted is defined as throughput. It is measured in kilo bits per second (kbps).
(16)
From (16), „ ‟ data packets are sink node and „ ‟ data packet send.
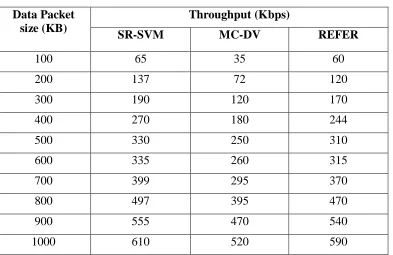
Table 1 Tabulation for Throughput
Data Packet size (KB)
Throughput (Kbps)
SR-SVM MC-DV REFER
100 65 35 60
200 137 72 120
300 190 120 170
400 270 180 244
500 330 250 310
600 335 260 315
700 399 295 370
800 497 395 470
900 555 470 540
1000 610 520 590
Table 1 clearly describes the throughput with respect to different packet sizes used in
simulation analysis. The size of the data packet is varied from 100KB to 1000KB. If the data
packet size is increased then the throughput gets increased. But the proposed SR-SVM technique
Impact Factor: 4.123
©2017, IJCSMA All Rights Reserved, www.ijcsma.com 144
Figure 5 Performance measure of throughput
Figure 5 illustrates the performance analysis of throughput rate with respect to different
data packet size. Above figure shows the comparison result of proposed SR-SVM technique with
existing MC-DV [1] and REFER [2]. With the application of stepwise regression technique,
target node is selected and remaining nodes are removed based on their residual energy. When
there is a higher residual energy, the route path is generated between sources and sink node.
Thus, it helps to improve the data delivery ratio and resulted with higher throughput. Therefore,
SR-SVM Technique considerably enhance the throughput by 44% and 8% compared to existing
MC-DV [1] and REFER [2] respectively.
4.2 Performance analysis of energy consumption
Energy consumption is defined as an amount of energy consumed by a single sensor node
„ ‟ with respect to the total number of sensor nodes „ ‟ in WSN. Energy consumption is
measured in terms of joules (J).
(17)
0 100 200 300 400 500 600 700
100 200 300 400 500 600 700 800 900 1000
Th
r
o
u
gh
p
u
t
(K
b
p
s)
Data Packet size (KB)
SR-SVM
MC-DV
Impact Factor: 4.123
©2017, IJCSMA All Rights Reserved, www.ijcsma.com 145
Table 2 Tabulation for energy consumption
Sensor nodes (N) Energy consumption (J)
SR-SVM MC-DV REFER
10 35.2 50.3 42.7
20 38.7 54.9 46.5
30 42.9 59.2 50.4
40 48.2 63.9 55.7
50 50.6 65.6 57.6
60 53.5 68.3 60.3
70 55.9 71.8 63.8
80 58.7 73.7 65.2
90 63.5 78.6 70.4
100 66.1 82.4 73.9
Above table 2 shows the simulation value of energy consumption with respect to
different number of sensor nodes. The sensor nodes are varied from 10 to 100 nodes. As shown
in above table, the proposed SR-SVM technique reduces energy consumption when compared
with existing MC-DV [1] and REFER [2] methods.
Figure 6 Performance measure of energy consumption
0 20 40 60 80 100
10 20 30 40 50 60 70 80 90 100
En e r gy c o n su m p ti o n (J)
Sensor nodes (N)
Impact Factor: 4.123
©2017, IJCSMA All Rights Reserved, www.ijcsma.com 146
The performance analysis of energy consumption with respect to varies sensor nodes is
illustrated in above figure 6. From the figure, proposed SR-SVM technique significantly
outperforms than the existing methods. Here, stepwise regression technique is used to reduce the
energy consumption of sensor node during the transmission. In order to obtain minimum energy
consumption, target node is selected based on the residual energy of nodes. Additionally, it
constructs the route path with minimum energy utilization for efficient data packet delivery. As a
result, the energy consumption is reduced by 24% and 13% compared to existing MC-DV [1]
and REFER [2] respectively.
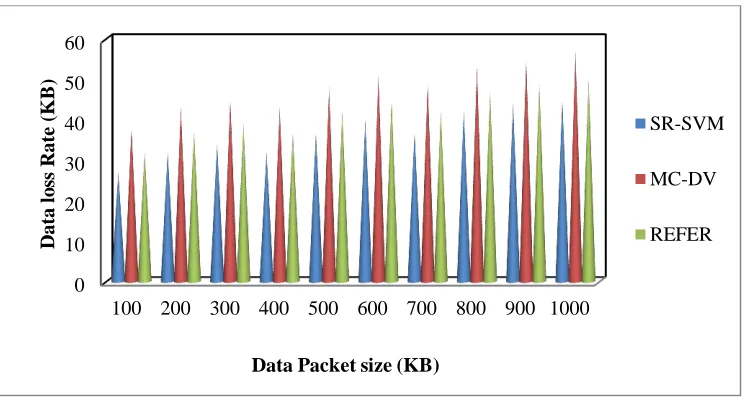
4.3 Performance analysis of data loss rate
The difference between the size of data packet received at sink node „ ‟ and size of data packet send „ ‟ in WSN is defined as data loss rate. It is measured in kilo
bytes (KB).
(18)
Table 3 Tabulation for data loss rate
Data Packet size (KB)
Data loss Rate (KB)
SR-SVM MC-DV REFER
100 27 38 32
200 32 43 37
300 34 45 39
400 32 43 37
500 37 48 42
600 40 51 45
700 37 49 42
800 42 53 47
900 44 55 49
Impact Factor: 4.123
©2017, IJCSMA All Rights Reserved, www.ijcsma.com 147
Table 3 describes the analysis of data loss rate based on size of data packet. The data
packet sizes get varied from 100 to 1000 KB. When the size of data packet is increased, data loss
rate is also increased. Hence, the proposed SR-SVM technique reduces the data loss rate when
compared with existing MC-DV [1] and REFER [2] methods.
Figure 7 Performance measure of data loss rate
The performance analysis of data loss rate with respect to varies data packet size is
illustrated in above figure 7.The data loss rate is determined based on optimal route path. By
applying the geometric representation of the SVM learning technique, optimal route path is
attained. In addition, link quality is improved based on the distance between source nodes to sink
node and avoids the limited transmission range problem. Hence, the data packets are transmitted
along that route path with minimum hop. This helps to improve the consistent data delivery and
reduce the data loss rate. Therefore, the data loss rate is minimized by 24% and 12% when
compared to existing MC-DV [1] and REFER [2] methods respectively.
0 10 20 30 40 50 60
100 200 300 400 500 600 700 800 900 1000
D
ata
lo
ss
R
ate
(K
B
)
Data Packet size (KB)
Impact Factor: 4.123
©2017, IJCSMA All Rights Reserved, www.ijcsma.com 148
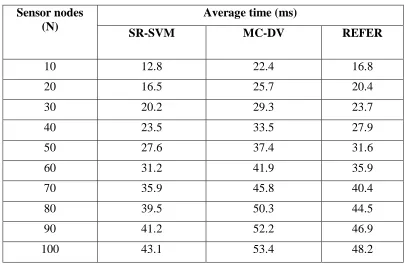
4.4 Performance analysis of average time
The average time is defined as the measure of time taken for selecting next hop node
between source nodes to sink node according to the total number of sensor nodes in WSN. It is
measured in terms of milliseconds (ms).
(19)
Table 4 Tabulation for average time
Sensor nodes (N)
Average time (ms)
SR-SVM MC-DV REFER
10 12.8 22.4 16.8
20 16.5 25.7 20.4
30 20.2 29.3 23.7
40 23.5 33.5 27.9
50 27.6 37.4 31.6
60 31.2 41.9 35.9
70 35.9 45.8 40.4
80 39.5 50.3 44.5
90 41.2 52.2 46.9
100 43.1 53.4 48.2
As shown in table 4, the measure of average time value is tabulated based on the different
number of sensor nodes. The average time for determining the next hop is reduced in proposed
Impact Factor: 4.123
©2017, IJCSMA All Rights Reserved, www.ijcsma.com 149
Figure 8 Performance measure of average time
Figure 8 describes analysis of average time with respect to number of sensor node in the
range of 10 to 100 nodes. By applying the support vector machine learning technique, number of
hops between source and sink node is reduced. The next hop node is selected with higher
residual energy for every sensor node. Thus, it generates the link between nodes to achieve
successful data delivery and improves the network consistency. As a result, the average time for
selecting the next hop node is reduced by 27% and 14% when compared to existing MC-DV [1]
and REFER [2] methods.
5. RELATED WORK
Zone-based Energy Efficient routing protocol (ZEEP) was described in [11] to select the
best optimal nodes for communication. Then, a genetic algorithm is used to improve network
lifetime with minimum energy consumption. Though, it does not consider data stability. Genetic
Algorithm based approach in multi-sink WSN was developed in [12] to determine the difficulty
of load balance. With the assist of Genetic algorithm, the coverage area is increased by
controlling the communication. However, the network throughput was reduced.
0 10 20 30 40 50 60
10 20 30 40 50 60 70 80 90 100
A
v
e
r
age
ti
m
e
(m
s)
Sensor nodes (N)
SR-SVM
MC-DV
Impact Factor: 4.123
©2017, IJCSMA All Rights Reserved, www.ijcsma.com 150
Another Genetic algorithm was introduced in [13] to provide an energy-efficient based
multipath routing. A-star algorithm was performed to establish higher route stability and reduced
multipath traffic. However, network throughput was not improved. Mobile sink based Energy
efficient adaptive threshold clustering hierarchy algorithm was presented in [14] to solve
network lifetime and load balancing. Predictive Energy Consumption Efficiency (PECE) was
designed in [15] to improve network lifetime. With the use of bee colony optimization (BCO),
stable data transfer is obtained. But, throughput and energy consumption was not considered.
6. SUMMARY
Finally, an efficient Stepwise Regression based Support Vector Machine (SR-SVM)
technique is introduced for achieving stable and consistent network communication. In the
beginning, stepwise regression technique is applied to select the target node for transmitting the
data packet and it is selected based on node energy. When the node has higher residual energy,
throughput is increased with minimum energy consumption. After that, support vector machine
learning technique is used to improve network consistency. Here, link quality is measured by
geometric representation of SVM. With the help of convex hull, next hop node is determined.
This helps to reduce the data loss rate. Finally, the decision functions of convex hull of SVM
avoid the limited transmission problem and improve the network consistency.
REFERENCES:
[1] Shan lin, Gang zhou, Motaz al-hami, Yafeng wu, John A. Stankovic, Tian he, Xiaobing WU
and Hengchang liu, “Toward Stable Network Performance in Wireless Sensor Networks: A
Multilevel Perspective”, ACM Transactions on Sensor Networks, Volume 11, Issue No. 3,
February 2015, Pages 42-68.
[2] Haiying Shen, and Ze Li, “A Kautz-Based Wireless Sensor and Actuator Network for
Real-Time, Fault-Tolerant and Energy-Efficient Transmission”, IEEE Transactions On Mobile
Impact Factor: 4.123
©2017, IJCSMA All Rights Reserved, www.ijcsma.com 151
[3] A.Jenitha Princess and V.Mathimalar, “Establishing Stable and Reliable Routes for
Heterogeneous Multihop Wireless Sensor Networks”, International Research Journal of
Engineering and Technology (IRJET), Volume 3, Issue No.6, June 2016, Pages 562-567.
[4] Shekhar Kumar, Shashi Kant Verma and Awadhesh Kumar, “Enhanced Threshold Sensitive
Stable Election Protocol for Heterogeneous Wireless Sensor Network” Wireless Personal
Communications, Springer, Volume 85, Issue No. 4, December 2015, Pages 2643–2656.
[5] Qi Zhang and Anfeng Liu, “An unequal redundancy level-based mechanism for reliable data
collection in wireless sensor networks”, EURASIP Journal on Wireless Communications and
Networking, Springer, Volume 2016, Issue No.258, December 2016.
[6] Leandro Aparecido Villas, Azzedine Boukerche, Heitor Soares Ramos, Horacio A.B.
Fernandes de Oliveira, Regina Borges de Araujo and Antonio Alfredo Ferreira Loureiro,
“DRINA: A Lightweight and Reliable Routing Approach for In-Network Aggregation in Wireless Sensor Networks”, IEEE Transactions On Computers, Volume 62, Issue No. 4, April
2013, Pages 676-689.
[7] Minming Ni, Jianping Pan and Lin Cai, “Geometrical-Based Throughput Analysis of
Device-to-Device Communications in a Sector-Partitioned Cell”, IEEE Transactions On Wireless
Communications, Volume 14, Issue No. 4, April 2015, Pages 2232-2244.
[8] Hui Li and Jing Liu, “Double Cluster Based Energy Efficient Routing Protocol for Wireless
Sensor Network”, International Journal of Wireless Information Networks, Springer, Volume 23,
Issue No. 1, March 2016, Pages 40–48.
[9] Haitao Zhang., Huadong Maa, Xiang-Yang Li, Shaojie Tang, Xiaohua Xu, “Energy-efficient
scheduling with delay constraints for wireless sensor networks: A calculus-based perspective”,
Journal on Computer Communications, Elsevier, Volume 35, Issue No.16, September 2012,
Pages 1983-1993.
[10] Manish Kumar Jha, Atul Kumar Pandey, Dipankar Pal, Anand Mohan, “An energy-efficient
Impact Factor: 4.123
©2017, IJCSMA All Rights Reserved, www.ijcsma.com 152
Journal of Electronics and Communications, Elsevier, Volume 65, Issue No.3, March 2011,
Pages 209–216.
[11] Juhi R. Srivastava and T.S.B. Sudarshan, “A genetic fuzzy system based optimized zone
based energy efficient routing protocol for mobile sensor networks (OZEEP)”, Applied Soft
Computing, Elsevier, Volume 37, December 2015, Pages 863–886.
[12] Haidar Safa, Mathieu Moussa, and Hassan Artail, “An energy efficient Genetic Algorithm
based approach for sensor-to-sink binding in multi-sink wireless sensor networks”, Wireless
Networks, Volume 20, Issue No. 2, February 2014, Pages 177-196
[13] Ying Song, Chao Gui, Xiaocheng Lu, Hua Chen and Baolin Sun, “A Genetic Algorithm for
Energy-Efficient Based Multipath Routing in Wireless Sensor Networks”, Wireless Personal
Communications, Springer, Volume 85, Issue No. 4, December 2015, Pages 2055-2066.
[14] Shipra Sharma and Kanika Sharma, “Improved Lifetime by Mobile Sink based Energy
Efficient Adaptive Threshold Clustering Hierarchy Algorithm for WSN”, International
Advanced Research Journal in Science, Engineering and Technology, Volume 3, Issue
No.10,October 2016, Pages 72-75.
[15] De-gan Zhang, Xiang Wang, Xiao-dong Song, Ting Zhang and Ya-nan Zhu, “A new
clustering routing method based on PECE for WSN”, EURASIP Journal on Wireless