Vol.9 (2019) No. 6
ISSN: 2088-5334
Automatic Detection Brain Segmentation to Detect Brain Tumor
Using MRI
Riyanto Sigit
#1, Annisa Wulandari
#2, Noor Rofiqah
#3, Heny Yuniarti
#4 #Department of Informatics and Computer Egineering, Politeknik Elektronika Negeri Surabaya, Jl. Raya ITS, Surabaya, 60111, Indonesia E-mail:[email protected]; [email protected]; [email protected]; [email protected]
Abstract— Brain tumors are a type of disease in the form of lumps of meat that grow in the brain. In differentiating brain tumor tissue from normal tissue become a difficulty caused by the same colors are an obstacle in seeing brain tumors using MRI images. Accuracy is needed in analyzing brain tumors. However, currently, radiographers (radiologists) still analyze the results of manual MRI images of brain tumors. Therefore we need a method that is able to segment MRI images precisely and automatically, with the aim of obtaining faster and more accurate image segmentation of brain tumors so that we can know the percentage of brain tumors found in the brain. To overcome difficulties when segmenting brain tumors in separating brain tumor tissue from other tissues such as normal brain tissue, cerebrospinal fluid, fat, and edema, a learning-based system method that will carry out the training process uses Haar training to narrow the MRI image so that it is more focused on the part of the head object. Then median filtering is performed to maintain the edge of the image on the MRI image. Then the segmentation process using the thresholding method is run, then repeated to take the largest area. Segmentation of brain is carried out by marking the brain area and the area outside the brain using the DAS method and then cleaning the skull using the cropping method. In this research, 12 images of MRI brain tumors were used. The results of segmentation compared to area of the brain tumor and area of the brain tissue. The system obtains a calculation of the tumor area having an average error of 10,5%.
Keywords— automatic; brain tumors; MRI images; segmentation; thresholding.
I. INTRODUCTION
Cancer cells that grow out of control and attack brain tissue are called brain tumors. There are two types of brain tumors, benign tumors and malignant tumors. Usually, a malignant tumor in the form of blood clots and fat surrounding it. To detect the location and size of brain tumors an MRI or CT-Scan of the patient’s head is needed. The result of MRI images can help to distinguish between brain tumors, brain tissue, cerebrospinal fluid, and edema based on differences in color contrast in each tissue [1]. At present, the problem in radiological is that doctors analyze to diagnose the results of MRI brain tumors manually, so that it takes a long time [2]. To determine the results of analysis of the tumor effectively, early detection is needed. For diagnosis, MRI scanning is better than CT-Scan because it does not use radiation, so it does not affect the human body. This MRI scanning works based on radio waves and magnetic field [3].
To overcome this problem, a solution is needed that is a system that can be integrated automatically, can detect the presence of brain tumors, and calculate the tumor area. A brain tumor area will estimate the tumor area that will be dissected, so that it can help surgeon work. This system will
be developed in the future to examine brain tumors effectively and automatically [4].
Nooshin Nabizadeh et al [6] created an automated system that can detect parts of the tumor and describe the tumor area. The method used in feature extraction is Gabor wavelet. In addition, statistical feature extraction methods are also used. The experimental results show the efficacy of the technique that has successfully segmented brain tumor tissue with low computational accuracy and complexity.
Aye Min et al [7] chose the median filter method to begin their research. The median filter is a non-linear method that is used to eliminate noise from brain MRI images. The median filter is selected because it can eliminate noise without decreasing the image sharpness. The median filtering will work by replacing the pixel value of the image with the median value of the neighboring pixel.
Radiologists will confirm the effectiveness of using MRI segmentation using multilevel thresholding and this level set to identify the presence of tumors in the human brain.
Jin Liu et al [9] presented research on the segmentation of brain tumors that aimed to separate different tumor tissue such as edema cells, necrotic, and active from normal brain tissue. The aim is to provide a broader review of the MRI image segmentation method for brain tumors. In the pre-processing stage, the ADF method is used. Then segmented using the thresholding and region based methods. After being successfully segmented, classification is done using Atlas based algorithm method, MRF algorithm, and SVM algorithm.
Bhima et al [10] explained the detection of brain tumor using the watershed method. According to them, image segmentation is important in image processing because it facilitates the extraction of regions from MRI images. In this research, the authors used the watershed method for the grayscale image segmentation process applied to mathematical morphology and region detection. This research resulted in good accuracy for the detection of brain tumors but has obstacles in the form of limitations in the detection of brain tumors and the overall analysis of the internal structure of the brain is largely ignored as one of the most important factors for detection of disorders.
Dhange et al [11] described the ability of watershed segmentation, which is used to separate the abnormal network and the surrounding normal network with the aim of being able to identify significantly from the area involved and not involved properly. At the end of the research, the tumor will be extracted from the MRI image and the position and shape of the tumor will be determined by various parameters, such as perimeter, eccentricity, entropy, and centroid that has been calculated. The advantage of this research is it is simplicity and efficiency because it can eliminate salt and papper noise, high frequency component from MRI image without disturbing edges.
In this research, the first step to start is training and testing by Haar Method. This training and testing is used to narrow the MRI image so that the image will focus on the part of the head object. The second step is preprocessing by median filtering. The aims of median filtering are to maintain the edge of the image in a way moving the pixel value of the original image to the middle pixel value [12]. The third step is thresholding. The aims of thresholding is to identify the tumors object based on distribution of gray level. And then, the results of thresholding step are used as an input to find the largest area in the image [13]. The aims of the largest area is to separate tumors from other tissues in the brain. The brain segmentation is done using watershed method. Watershed begins by giving a sign the outer region of the brain and the brain region, so that it can distinguish the outer region of the brain and the brain region. That sign will give different color using watershed. Then, the cropping method is used to removal of the skull bones.
This paper discusses brain tumor segmentation to calculate not only the tumor area but also the percentage of the area. The introduction and the review from previous studies will discuss in session 1. Session 2 discussed the material and method. Session 3 discussed results and discussion. And the last, session 4 discussed conclusions.
II. MATERIAL AND METHOD
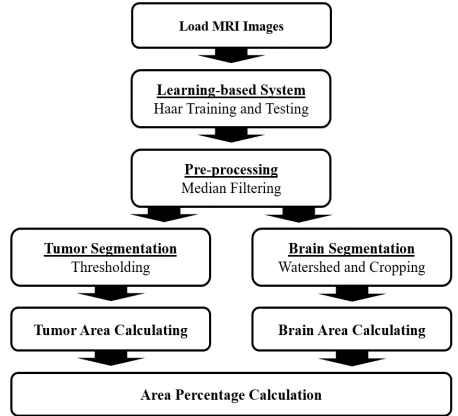
In this section, MRI Scan Brain Tumor segmentation procedures are represented. The method for MRI Scan Brain Tumor segmentation include: 1) Haar training for learning-based system method, 2) Median filtering, 3) Threshold and largest contour, 5) Watershed segmentation and crop. The method are described in a diagram is shown in Fig. 1.
Fig. 1. Algorithm of schematic diagram
Fig. 1 shows the algorithm of schematic diagram for MRI Scan brain tumor segmentation. This research will begin with load MRI image. This research has 6 stages, namely load MRI Scan image, learning-based system using Haar, preprocessing using median filtering, tumor segmentation using thresholding and brain segmentation using watershed then cropping, tumor and brain area calculating, and the last is percentage calculation of the area.
A. MRI Scan Image
In this research, all MRI Scan use an axial perspective with an image size of 512 x 512 pixels. MRI Image in an axial perspective is shown in Fig. 2.
Fig. 2. Axial perspective of the brain image
Fig. 2 is a slice of MRI Scan brain tumor image that are used as an input image in this research. The MRI Scan brain tumor images used is a collection of images consisting of several pieces or slices of MRI images Scan brain tumor.
B. Haar Training and Testing
programmed by humans. There are two steps in machine learning, namely training and testing. Training is the process of giving knowledge to the system to be able to detect an object, or commonly called a learning process. The testing process is used to determine whether the system has been able to detect objects or not. How to machine learning work is shown in Fig. 3.
Fig. 3. Schematic diagram of how to machine learning works
In fig. 3 there are training data and data input, so in machine learning requires two data that must be prepared, which is data for training and data for testing. The function of the training data is to train the algorithm to get the desired model, while the function of the testing data is to test the correctness of the model’s performance. From the model obtained, the system will be able to make predictions.
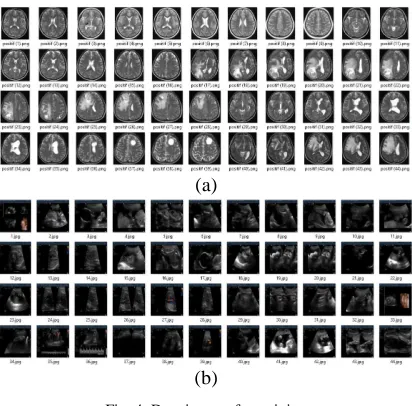
Learning process in this research using haar training and testing. Haar cascade is used in object detection, which previously the system has carried out the training process. To be able to detect objects, positive and negative images are needed. Positive images are images that include the objects that will be detected, while negative images are images that not include the objects that will be detected. Positives and negatives image for training is shown in Fig. 4.
(a)
(b)
Fig. 4. Data images for training
Fig. 4(a) shows MRI scan brain tumor used as positives data during training. There are 102 data consisting of normal and abnormal brain MRI images. While Fig. 4(b) shows
ultrasound images. There are 1171 data ultrasound images used as negative data during training. The advantages of using the haar method are very fast computing. Haar cascade works by adding the number of white pixels and color pixels. Formula (1) is an equation of haar cascade.
(1)
Equation (1) is used to find the total feature value by reducing the average pixel in bright areas with the average pixel in dark areas. If the value of the difference is above the threshold value, so it can be said that the feature exists. However, if the difference is belom the threshold value, it can be said that the feature does not exist. Haar training and testing result is shown in Fig. 5.
Fig. 5. Haar’s result
C. Median Filtering
Median filtering was chosen because it is a method that can be used to remove noise but still maintain the edge of the image. Median filtering works by replacing each value with the median value of neighboring pixels, then moving towards other pixels in the image.
There are three steps to finding the median value. The first step is reading the pixels value and the neighbor pixel value that will be processed. The second step is sorting the pixel value from small to large. And the third step is choosing the middle value for the new pixel value (x,y). Formula (2) is an equation of median filtering.
(2)
Where ω is a user-defined neighbourhood with the center located around [m,n] location in the image.
The impact given by the median filtering is the image will appear blurry. The median filtering result is shown in Fig. 6.
Fig. 6. Median filtering is result
D. Watershed
segmentation process. The watershed process works to determine the segmentation area of an MRI image by initializing the watershed point. Initialize watershed points in the MRI image is shown in Fig. 7.
Fig. 7. Initialization of watershed area
Fig. 7 shows the initialization of the watershed area. As in the picture, the system will determine into 2 areas of segmentation. First is Area 1 is an area inside the brain including parts of the brain, brain tissues, and brain tumors. And the second, Area 2 is an area outside of the brain including the background image and skull bones.
Watershed transformation aims to set a gray image. The basic principle of watershed transformation is when the water that fills the two infiltration ponds will merge into one, like a dam. Formula (3), (4), (5), and (6) is an equation of watershed transformation.
(3)
(4)
(5)
(6)
From the equation (3), (4), (5), and (6) there are some notation, which is Mi, max, T[n], (s,t), Cn (Mi), and others. Mi and max are a sign of minimum and maximum value of g(x,y). T[n] is made into a set of coordinates with (s,t), so that it can define g(s,t) < n. Cn (Mi) is a binary image of a set of coordinate point in the minimum Mi area that is in step n or C[n]. Whereas the combination of all catchments is C[max-1].
The water filling process is carried out by draining water to fill the surface. Water will stop flowing when te desired level has been reached, which is marked by the sight of the top of the dam.
This research, MRI images are used as an input to the watershed process. The purpose of dam transformation is to obtain a brain region without the skull by removing the skull bones. To be able to remove the skull, the watershed will eliminate the skull bones in the brain. The watershed transformation result is shown in Fig. 8.
Fig. 8. Watershed transformation’s result
E. Cropping
Cropping method is used to retrieve the desired results by removing unwanted parts. The first step in running the cropping method is to find and give a mark on the contours. In this research, the system will take part in the brain region by cutting the skull bone area. The cropping algorithm is shown in Fig. 9.
Fig. 9. Cropping algorithm
Fig. 9 shows that the input used in the cropping method is the output of the watershed process. Then the input image converts to gray scale. After that, it would be processed using the threshold method, which is the binary thresholding method. The process would produce a contour area is copied in the form of a masked original image. The cropping operation result is shown in Fig. 10.
Fig. 10. Cropping operations’s result
F. Binary Threshold
The function of thresholding is to utilize the gray level in the image to get the desired object. There are several types of threshold methods, but in this research the threshold type used is binary thresholding. Binary thresholding method aims to change the background to black and change the color of the object to white. If an image has a pixel value that meets or exceeds the threshold value, then the image will be mapped to the desired value. Formula (7) is an equation of binary thresholding.
(7)
Fig. 11. Binary threshold’s result
G. Algorithm of Largest Contour
Contour is the boundary formed by a set of edge pixels. Likewise, the result of a binary threshold that has several distressed contour consist of several organs, such as brain tissues, segmented tumors, fat, and cerebrospinal fluid. Some of these contours will be processed to get the largest contour, which is considered a segmented tumor. The largest contour algorithm is shown in Fig. 12.
Fig. 12. Largest contour algorithm
Fig. 12 shows the largest contour algorithm. There are several steps until the system can display results in the form of images of the largest contour. The input of this step is the threshold image. The image will be processed by converting to gray. Then the system will store all the contours obtained as vector. After becoming a vector the system can find the largest contour and redraw the contour. The largest contour result is shown in Fig. 13.
Fig. 13. Largest contour’s result
H. Brain Area and Brain Tumor Area Calculation Pixel
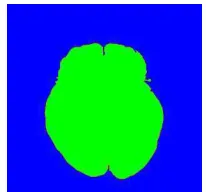
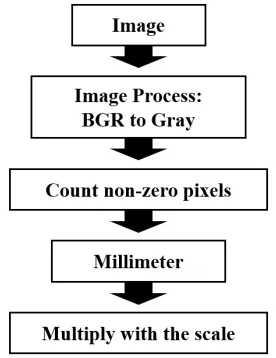
The way to calculate the brain area and brain tumor area is to look for pixels that have gray rises that have a value or nor equal to 0. Algorithm for calculating segmented area is shown in Fig. 14.
Fig. 14. Algorithm for calculating segmented area
Fig. 14 shows an algorithm for calculating the segmented area, where there are several steps. The first step of the BGR image will be processed into a gray image by calculating the pixel value of the BGR image to get the pixel value B=G=R. If the gray value is not equal to 0 then the pixel calculation will be added. After getting the value in pixels, the system will convert to millimeters. The scale of the image multiplies the last step. Formula (8) is an equation to calculate the area.
(8)
In formula (8) there is a constant with a value of 0.26, which means that very 1 pixel that is read equals 0.26 millimeters (mm).
III.RESULTS AND DISCUSSION
TABLEI
RESULTS OF BRAIN TUMORS AREA
No. Input Image Area
(Pixels)
Area (mm2)
1 9769 2585.71
2 4236 1445.94
3 3290 872.47
4 4689 1240.63
5 8933 2364
After get the tumor area in millimeters, then calculate the area of the brain. For calculate brain area, first the system will calculate the area in pixels, then the system will convert in millimeters using formula (8). The calculated brain area is shown in Table 2.
TABLEII RESULTS OF BRAIN AREA
No. Input Image Area
(Pixels)
Area (mm2)
1 78044 20649
2
84541 22368
3 85330 22576
4 71883 19019
5 85695 22673
(9)
The ratio formula is obtained from the division between tumor area and brain area then multiplied by 100%. Tumor area values obtained from the calculation of the number of pixel of the tumor. Brain area values obtained from the calculation of the number of pixels of the brain. The calculation ratio of the segmented brain tumor area is shown in Table 3.
TABLEIII RATIO OF BRAIN TUMOR AREA
No MRI Images Tumor Calculation
of Ratio
1 12.51%
2 6%
3 3%
4 6%
5 10%
After getting the area value of the brain tumor and the brain area. the system will do an error calculation to get the average value of the errors of some of the image being tested. The following formula is used to calculate the error values:
(10)
One of the goals of calculating errors is to find out the effectiveness of the system that has been made. The segmented brain tumor area average error is shown in Table 4.
TABLEIV
THE SEGMENTED BRAIN TUMOR AREA’S AVERAGE ERROR
No. Result Value Error (%)
References (mm2) System (mm2)
1 2803.68 2585.71 7.7
2 846.88 681.89 19.4
3 1445.94 1121.77 22.2
4 780.55 755.44 3.2
5 1189.3 1276.25 7.3
6 901.12 872.47 3.1
7 2026.13 2364 16.6
8 800.32 838.99 4.8
9 171.19 202.12 18
10 2631.09 2679.6 1.8
11 1470.7 1409.7 4.1
12 1083.17 1271.06 17.3
Average Error 10.5
Fig. 15. Comparison chart of calculated tumor areas and references
Fig. 15 shows a graph of reference and calculated tumor area value. From the graph, it can be analyzed that the value of the area ratio calculated by the area of reference affects the error rate. If the difference between the reference value and the calculated value is low, so the error rate gets smaller. Conversely, if the difference between the reference value and the calculated value is high, then the error gets bigger.
TABLEV
THE SEGMENTED BRAIN AREA’S AVERAGE ERROR
No. Result Value Error (%)
References (mm2) System (mm2)
1 19539.4 20649.1 5.6
2 17721.28 18655.2 5.2
3 19327 22368.1 15.7
4 17980.5 17504.5 2.6
5 25575 26880 5.1
6 22850 22576.9 1.1
7 22944 22673.4 1.1
8 20352 21558 5.9
9 22350 21995 1.5
10 23429.55 28063.5 19.7
11 17252.6 17043.6 1.2
12 21177.75 22905 8.1
Average Error 6.1
Fig. 16. Comparison chart of calculated brain areas and references Fig. 16 shows a graph of reference and calculated brain area value. From the graph, it can be analyzed that the value of the area ratio calculated by the area of reference affects the error rate. If the difference between the reference value and the calculated value is high, then the error gets bigger. But, if the difference between the reference value and the calculated value is low, so the error rate gets smaller.
IV.CONCLUSIONS
The experimental results provide the conclusion that before segmentations brain tumors, the part that must be removed first is the skull shell because the skull shell has the same color as the object of the brain tumor. The process of the skull cutting was carried out using the segmentation using watershed method with initializing two lines. The brain tumors segmentation is done using the thresholding. And then, the biggest contour was conducted to separate
tumor objects from other tissues. The average error obtained from the calculation of the system test for the tumor area is 10,5%, while the average calculation of the brain area error is 6,1%.
REFERENCES
[1] Huang Meiyan, Wei Yang, Wu Yao, Jiang Jun, Chen Wufan, and Qianjin Feng, “Brain Tumor Segmentation Based on Local Independent Projection-based Classification”, IEEE Transactions on Biomedical Engineering, 2013.
[2] Ines NJEH, Lamia Sallemi, Mohammed Ben Slima, Stephane Lehericy. “A Computer Aided Diagnosis ‘CAD’ for Brain Glioma Exploration”. International Conference on Advanced Technologies Signal and Image Processing.2014.
[3] Eman Abdel-Maksoud*, Mohammad Elmogy, Rashid AlAwadi.”Brain Tumor Segmentation Based on a Hybrid Clustering Technique”.Egyptian Informatics Journal.2015.
[4] Riyanto Sigit, Zainal Arief, Mochamad Mobed Bachtiar. ”Development of Healthcare Kiosk for Checking Heart Health”.EMITTER International Journal of Engineering Technology.2015.
[5] Dawngliana Malsawm, Deb Daizy, Handique Mousum, and Roy Sudipta, “Automatic Brain Tumor Segmentation in MRI: Hybridized Multilevel Thresholding and Level Set”, International Symposium on Advanced Computing and Communication (ISACC). 2015.
[6] Nooshin Nabizadeh, Miroslav Kubat. “Brain tumors detection and segmentation in MR images: Gabor wavelet vs. statistical features”. Elsevier.2015.
[7] A. Min and Z. M. Kyu, "MRI Images Enhancement and Tumor Segmentation for Brain," 2017 18th International Conference on Parallel and Distributed Computing, Applications and Technologies (PDCAT), Taipei, 2017, pp. 270-275.
[8] Malsawm Dawngliana, Daizy Deb, Mousum Handique, and Sudipta Roy. “Automatic Brain Tumor Segmentation in MRI: Hybridized Multilevel Thresholding and Level Set”. International Symposium on Advanced Computing and Communication (ISACC). 2015. [9] Jin Liu, Min Li, Jianxin Wang*, Fangxiang Wu, Tianming Liu, and
Yi Pan. “ A Survey of MRI-Based Brain Tumor Segmentation Methods”.ISSN.2014.
[10] K. Bhima and A. Jagan, "Analysis of MRI based brain tumor identification using segmentation technique," 2016 International Conference on Communication and Signal Processing (ICCSP), Melmaruvathur, 2016, pp. 2109-2113.
[11] P. Dhage, M. R. Phegade and S. K. Shah, "Watershed segmentation brain tumor detection," 2015 International Conference on Pervasive Computing (ICPC), Pune, 2015, pp. 1-5.
[12] A. Wulandari, R. Sigit and M. M. Bachtiar, "Brain Tumor Segmentation to Calculate Percentage Tumor Using MRI," 2018
International Electronics Symposium on Knowledge Creation and Intelligent Computing (IES-KCIC), Bali, Indonesia, 2018, pp.
292-296.
[13] R. R. Hidayatullah, R. Sigit and S. Wasista, "Segmentation of head CT-scan to calculate percentage of brain hemorrhage volume," 2017
International Electronics Symposium on Knowledge Creation and Intelligent Computing (IES-KCIC), Surabaya, 2017, pp. 301-306.
[14] L. Breiman, “Random forests,” Machine Learning, vol. 45, no. 1, pp. 5–32, 2001.
[15] Ines NJEH, Lamia Sallemi, Mohammed Ben Slima, Stephane Lehericy. “A Computer Aided Diagnosis ‘CAD’ for Brain Glioma Exploration”. International Conference on Advanced Technologies
Signal and Image Processing.2014.
[16] Lina Chato, Shahram Latifi. “Machine Learning and Deep LearningvTechniques to Predict Overall Survival of Brain Tumor Patients using MRI Images”.IEEE International Conference on Bioinformatics and Bioengineering.2017.