STATISTICAL ANALYSIS OF THE PHYSICAL PROPERTIES OF VARIETIES OF BEANS
(
Phaseolus vulgaris
L.) INFLUENCED BY MATURITY STAGE
O. Eboibi
1and H. Uguru
2,*1,
M
ECHANICALE
NGR.
D
EPARTMENT,
D
ELTAS
TATEP
OLYTECHNIC,
O
ZORO,
D
ELTAS
TATENIGERIA
2,
A
GRIC.
&
B
IO-E
NVIRONMENTALE
NGR.
D
EPARTMENT,
D
ELTAS
TATEP
OLYTECHNIC,
O
ZORO,
D
ELTAS
TATENIGERIA
E-mail addresses:
1[email protected],
2[email protected]
ABSTRACT
Physical properties of post-harvest bean seeds was studied, but the physical properties of bean seeds in response to post flowering (maturity stage) have not been fully studied; therefore, this study is aimed at evaluating the physical properties of two bean varieties (iron and honey) during their maturation stages. The bean seeds were harvested at 15, 20 and 25 days after flowering (DAF), the physical properties (length, width, thickness, average thousand seed mass, size, volume, geometric mean, sphericity, surface area, arithmetic mean, bulk density, true density, porosity, angle of repose, and the static friction coefficient (against plywood, rubber, Formica, galvanized iron, and aluminum surfaces)) in both bean varieties were evaluated. The results showed that maturity stage of the bean seeds significantly (P≤ 0.05) influenced all their physical properties. Over the course of a maturation time, while their porosity and angle of repose decreased, in both bean varieties, other properties were found to increase. The bean seeds true density increased from 817.75 to 1207 kg/m3 in iron bean, and 774.25 to 1144 kg/m3 in honey bean; likewise, the bulk density increased from 464.5 to 761.75 kg/m3 and 544.75 to 867.66 kg/m3 in the iron and honey bean respectively; porosity decreased from 42.15 to 36.37% in the iron bean and 34.19 to 26.41% in the honey bean. The static coefficient of friction result was; Formica (iron bean, 0.24 to 0.35; honey bean 0.22 to 0.28), aluminum (iron bean 0.31-0.37; honey bean 0.25 to 0.32), galvanized iron (iron bean, 0.35-0.44; honey bean, 0.33 to 0.39), plywood (iron bean, 0.49 to 0.58; honey bean 0.39 to 0.46), and rubber (iron bean 0.55 to 0.61; honey bean 0.43 to 0.50). While the angle of response decreased from 39.62 to 30.73o in the iron bean and 45.78 to 36.84o in the honey bean. Furthermore, the results show that the ideal period for harvest, processing and handling of the two bean seeds is 20 to 25 days after anthesis, since the seeds will be having maximum dry weight and higher viability. Data gotten from this result is useful in the design and development of harvesting, handling and processing equipment.
Keywords: Iron bean, honey bean, physical properties, maturation, moisture content.
Nomenclature
L Length (mm) T Thickness (mm)
W Width (mm) S Surface area (mm2)
Da = Arithmetic mean (mm) V Volume (mm3) Dg = Geometric mean (mm) D Diameter (mm)
Sp Sphericity (%) H Height (mm)
ρb Bulk density (kg/m3) ε Porosity ρt True density (kg/m3) ψ Angle of repose
1. INTRODUCTION
Bean (Phaseolus vulgaris L.) has been characterized as a nearly perfect food because of their high protein, fiber, prebiotic, vitamin B, and chemically diverse micronutrient composition [1, 2]. Beans present great variety in color, size, chemical composition and hardness, depending on the cultivar to which they
belong. These differences come from intrinsic factors (genotype, which is partially responsible for the differences between cultivars and varieties) or from extrinsic factors such as storage conditions, type of cultivation soil, agronomic practices and climatic and technological factors [3, 4]. Bean provides a rich combination of carbohydrates (60-65%), proteins
(21-Vol. 37, No. 4, October 2018, pp.
1176 – 1184
Copyright© Faculty of Engineering, University of Nigeria, Nsukka,Print ISSN: 0331-8443, Electronic ISSN: 2467-8821
25%), fats (less than 2%), vitamins and minerals [5], and serves as a primary source of dietary protein for people in the lower income bracket [6].
The Knowledge of the physical properties of biomaterial is essential in the design of harvesting, handling, processing equipment. Seed dimensions are very important in the design of sizing, cleaning and grading machines, because bulk density and porosity are major parameters in the design of drying and storage systems [7]. Knowledge of the coefficient of friction is necessary in designing equipment for solid flow and storage structures [8]. Such basic knowledge is important not only to the engineers but also to food scientists, plant breeders, processors and other scientists who may find new uses [9]. Seed development is the period between fertilization and maximum fresh weight accumulation and seed maturation begins at the end of seed development and continues till harvest [10]. Studies on seed development and physiological maturity become important because seeds should be harvested at proper time to ensure their quality in terms of viability and vigor [11]. Seed quality can be limited by environmental conditions both before and after physiological maturity, the stage of development at which the seed possesses its maximum dry mass [12]. The seed reaches its maximum dry weight at physiological maturity [11]. Since the moisture content of the seed is often too great for mechanical harvesting and threshing at physiological maturity (PM), further desiccation must occur before direct harvesting is possible. Harvest maturity is defined as the first time the seed moisture declines to a harvestable level in those crops harvested as dry seeds and/or fruits [13]. Today, there is no detailed information on the physical properties of honey and iron beans as influenced by their maturity stage. Therefore, the objective of this study is to determine selected physical properties (geometric mean, arithmetic mean, volume, sphericity, surface area, thousand seed mass, bulk density, true density, porosity, angle of repose, and the static coefficient of friction) of iron and honey beans, at different maturity stage, which are necessary for the design and development of harvesting, handing and processing machines
2. MATERIALS AND METHOD 2.1 Seed Preparation
Bean pods from two bean varieties (iron and honey) with identical maturity stage (days from flowering) were chosen and harvested. Hundred seeds from the pods were manually shelled from the pods, damaged and pests infested seeds were eliminated from the
healthy seeds. The healthy selected seeds were later used for the physical properties determination.
2.2 Moisture content determination
The already cleaned and selected bean seeds were collected and their initial moisture content (Mc) determined by drying samples in an electric oven set at 105°C (±1°C) for 11 hours [14].
2.3 Dimensional properties determination
The dimensional properties of the bean seeds were measured with a digital vernire caliper with accuracy of 0.01 mm. Fifty randomly selected bean seeds of each variety were measured to determine the average length, width and thickness. The geometric mean and arithmetic mean, were calculated by using equations 1 and 2 respectively [9].
√ ( ) ( )
( )
Where Dg is the Geometric mean; Da is the Arithmetic mean; L is the Length; W is the Width and T is the Thickness
2.3.1 Sphericity
The sphericity, defined as the ratio of the surface area of the sphere having the same volume as that of seed to the surface area of seed, was determined with equation 3 [9].
√
00 ( )
2.3.2 Surface Area and Volume
The surface area and volume of the seed were calculated by using the following equations [9].
( )
(5)
Where S is the surface area and V is the volume
2.4 Gravimetric Properties Determination
2.4.1 Thousand Seed Mass (TSM)
The one thousand seed mass (TSM) of the two bean varieties was measured by counting 100 seeds from each variety and weighing them in an electronic balance to an accuracy of 0.001 g. To evaluate the thousand seed mass, the result of the 100 seeds was multiplied by 10 to give mass of 1000 bean seeds.
2.2.2 Bulk Density
pouring from a constant height, striking off the top level and weighing [15]. The bulk density was obtained as follows:
( )
Where Ma is the mass of the sample; and V is the volume of the sample
2.2.3 True Density
The true density of seeds was determined by using the liquid displacement method. Toluene (C7H8) was used in place of water because it has lesser extent absorb by seed. Fifty grams of the seed were filled in a calibrated pipe and the displaced toluene was measurement from the pipe. True density was obtained as the ratio of seeds weight to the volume of displaced liquid.
2.2.4 Porosity
The porosity is the fraction of the space in the bulk seeds which is not occupied by the seeds. The porosity of bean seed was calculated from the values of true density and bulk density by the following equation [16].
( ) 00 ( )
Where ε is the porosity; ρb is the bulk density; and ρt is the true density.
2.5 Frictional Properties Determination
2.5.1Coefficient of Static Friction
The incline plane method was used to measure static coefficient of friction of the following structural surfaces; aluminum, rubber, plywood, galvanized iron and Formica sheet. A hollow metal cylinder (opened at both ends) was filled with bean samples. The cylinder was then placed on an adjustable tilting plate without allowing the metal cylinder to touch the inclined surface. The tilting surface was then raised slowly and gradually by a screw mechanism until the cylinder started to slide down. At this point, the angle of tilt was
measured and the friction coefficient was calculated as the tangent of that specific tilt angle [17, 18].
( )
2.5.2 Angle of Repose
The angle of repose (ψ) was determined by using a hollow cylindrical mould of 100 mm diameter and 150 mm height. The cylinder was placed on a wooden table, filled with bean seed and raised slowly until it forms a cone of seeds. The diameter and height of the cone were recorded. The angle of repose (ψ) was calculated by the fallowing equation [19].
ψ ( )
where ψ is the angle of repose; H is the height; and D is the diameter
2.6 Statistical Analysis
All the data were analyzed using the SPSS 20.0 statistical software. The means that differed significantly were separated using Duncan’s multiple range test. Significant differences were accepted at P<0.05. For each of the maturity stage level were used in each physical properties.
3. RESULTS AND DISCUSSION
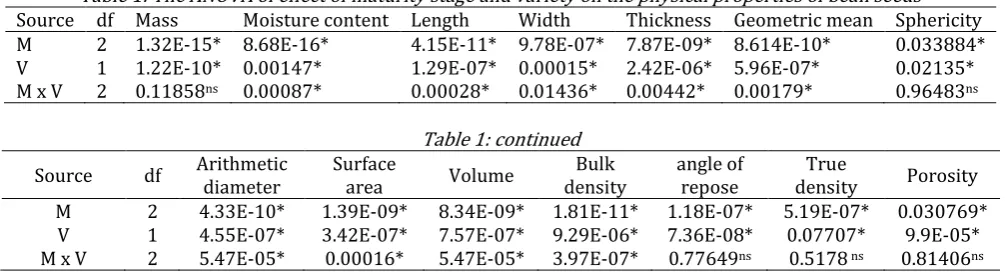
The analysis of variance (ANOVA) of the physical properties of the two bean varieties are influenced by maturity stage as presented in Table 1. The maturity stage significantly (P ≤0.05) influenced all the fifteen parameters (mass, moisture content, length, width, thickness, geometric mean, arithmetic diameter, sphericity, surface area, volume, bulk density, true density, porosity, coefficient of static friction, and angle of repose) investigated; also, bean variety still significantly (P ≤0.05) influenced all the fifteen parameters studied. The interaction of maturity stage and bean variety significantly (P ≤0.05) influenced the length, width, thickness, geometric mean, sphericity, surface area, volume, arithmetic diameter, moisture content and bulk density of the bean seeds.
Table 1: The ANOVA of effect of maturity stage and variety on the physical properties of bean seeds
Source df Mass Moisture content Length Width Thickness Geometric mean Sphericity M 2 1.32E-15* 8.68E-16* 4.15E-11* 9.78E-07* 7.87E-09* 8.614E-10* 0.033884*
V 1 1.22E-10* 0.00147* 1.29E-07* 0.00015* 2.42E-06* 5.96E-07* 0.02135*
M x V 2 0.11858ns 0.00087* 0.00028* 0.01436* 0.00442* 0.00179* 0.96483ns
Table 1: continued
Source df Arithmetic diameter
Surface
area Volume
Bulk density
angle of repose
True
density Porosity M 2 4.33E-10* 1.39E-09* 8.34E-09* 1.81E-11* 1.18E-07* 5.19E-07* 0.030769*
Table 1: continued
Source Df Coefficient of static friction
M 2 7.99E-67*
V 1 7.72E-49*
S 4 4.4E-67*
M x V 2 2.53E-07*
M x S 8 4.15E-12*
V x S 4 3.88E-06*
M x V x S 8 0.0135*
* Significant at P≤ 0.05, ns non-significant, M = Maturity stage, V = bean variety, S = surface of static friction
3.1 Seed Moisture Content
The ANOVA results showed that the differences between moisture levels were statistically significant (P<0.05) for the three maturity stages. From the results, the moisture content of the two bean varieties moisture declined with increase in maturity stage of the seed (Figure 1). The two bean varieties presented the same behaviour in terms of moisture content declination during maturity. For both determinations, the moisture content of honey bean was significantly lower than the iron bean variety. Seed moisture content has also been used as an index of optimum harvest time [20, 21]. The pattern of declining seed moisture content during seed development was similar to that reported in the marrow [22] and spring barley [23]. According to Goncalves et al. [24], the total moisture content decreases in the course of maturity, this reduction in moisture content tends to cause an increase in firmness, as fruits tend to lose flexibility, when they lose water.
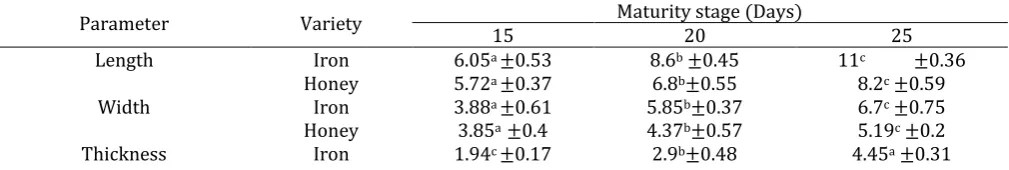
3.2 Seeds Dimensional Properties
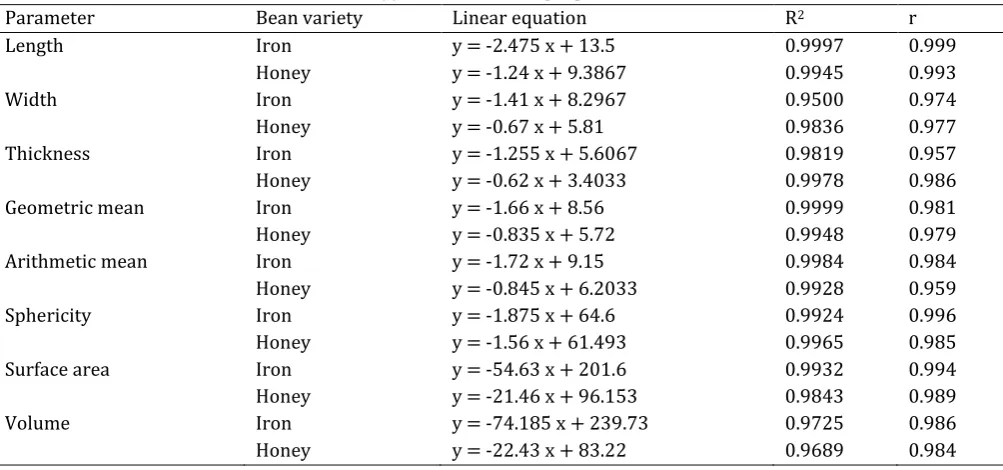
The average of dimensional properties of both bean varieties and their dependence on maturation are shown in Table 2; while their respective coefficient of determination (R2) and correlation (r) values are presented in Table 3. Table 2 shows that the seeds dimensional properties linearly increased from both bean varieties as maturity age of the seed increased from 15 DAF to 25 DAF; higher in Iron bean than in honey bean. There was an approximately 6% increase
in sphericity of the Iron bean and 5% of the honey bean as the bean seeds matured. The correlations values between the dimensional properties and maturity stage for the two bean varieties were relatively high, indicating that any dimensional properties investigated can be predicted at any specific maturity stage.
Common letters mean that there are no significant differences between mean at P≤0.05
Figure 1: Influence maturity stage on bean seed moisture content
3.3 Gravimetric Properties
Statistically, significant difference (p < 0.05) was found in all gravimetric properties for both bean variety seed with the variation in the maturation (Table 1). The regression equations of maturity stage as a function of gravimetric properties of bean seeds with their respective coefficient of determination (R2) and correlation (r) are given in Table 4.
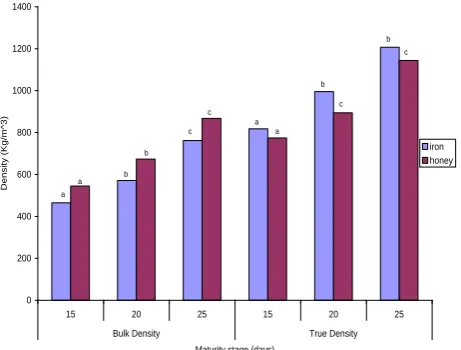
3.3.1 Bulk Density
The bulk density of seeds was observed to increase linearly with increasing maturation stage of the two bean varieties (Figure 2). This can be attributed to the change of the bean textural and material structures as the seed matures. Longer photoperiods may also result in greater production of photosynthates and to increase biomass, growth efficiency, duration of crop and yield per plant and thus mitigating source limitations [25, 26].
Table 2: Dimensional properties of bean seeds at different maturity stage
Parameter Variety Maturity stage (Days)
15 20 25
Length Iron 6.05a ±0.53 8.6b ±0.45 11c ±0.36
Honey 5.72a ±0.37 6.8b±0.55 8.2c ±0.59
Width Iron 3.88a ±0.61 5.85b±0.37 6.7c ±0.75
Honey 3.85a ±0.4 4.37b±0.57 5.19c ±0.2
Thickness Iron 1.94c ±0.17 2.9b±0.48 4.45a ±0.31
0 10 20 30 40 50 60 70 80 90 100
15 20 25
Maturity stage (Days)
M
ois
ture
C
ont
ent
(%
w
b)
Iron Honey
c c
b
b
Parameter Variety Maturity stage (Days)
15 20 25
Honey 1.56c ±0.23 2.13b±0.26 2.8a ±0.45
Geometric mean Iron 3.57a ±0.39 5.26b±0.4 6.89c ±0.42
Honey 3.25a ±0.29 3.98b±0.4 4.92c ±0.42
Arithmetic mean Iron 3.95a±0.43 5.79b±0.36 7.39c ±0.4
Honey 3.71a ±0.29 4.43b±0.42 5.40c ±0.38
Sphericity Iron 58.88a ±1.65 61.04ab±1.69 62.63b ±2.87
Honey 56.76a ±3 58.48ab±3.11 59.88b ±1.47
Surface area Iron 40.32a ±8.29 87.11b±13.65 149.58c ±18.66
Honey 33.34a ±5.93 50.10b±10.06 76.26c ±12.74
Volume Iron 24.37a ±7.09 76.96b±18.52 172.74c ±33.06
Honey 18.25a ±4.89 33.72b±10.05 63.11c ±15.65 Values are mean ± SD. Means with similar superscript in the same row did not differ significantly (p ≤0.05).
Table 3. Regression equations as a function of maturity stage with their respective coefficient of determination (R2) and correlation (r) for dimensional properties of bean seeds
Parameter Bean variety Linear equation R2 r
Length Iron y = -2.475 x + 13.5 0.9997 0.999
Honey y = -1.24 x + 9.3867 0.9945 0.993
Width Iron y = -1.41 x + 8.2967 0.9500 0.974
Honey y = -0.67 x + 5.81 0.9836 0.977
Thickness Iron y = -1.255 x + 5.6067 0.9819 0.957
Honey y = -0.62 x + 3.4033 0.9978 0.986
Geometric mean Iron y = -1.66 x + 8.56 0.9999 0.981
Honey y = -0.835 x + 5.72 0.9948 0.979
Arithmetic mean Iron y = -1.72 x + 9.15 0.9984 0.984
Honey y = -0.845 x + 6.2033 0.9928 0.959
Sphericity Iron y = -1.875 x + 64.6 0.9924 0.996
Honey y = -1.56 x + 61.493 0.9965 0.985
Surface area Iron y = -54.63 x + 201.6 0.9932 0.994
Honey y = -21.46 x + 96.153 0.9843 0.989
Volume Iron y = -74.185 x + 239.73 0.9725 0.986
Honey y = -22.43 x + 83.22 0.9689 0.984
Where y = physical property; x = maturity stage.
Table 4. Regression equations as a function of maturity stage with their respective coefficient of determination (R2) and correlation (r) for frictional properties of iron and honey bean
Parameter Bean variety Regression equation R2 r
Bulk density Iron y = 148.63 x + 301.92 0.974 0.987
Honey y = 161.46 x + 372.31 0.986 0.993
True density Iron y = 194.63 x + 617.33 0.997 0.998
Honey y = 184.88 x + 567.75 0.961 0.981
Porosity Iron y = -2.89 x + 45.263 0.982 -0.991
Honey y = -3.89 x + 37.823 0.987 -0.993
1000 seed mass Iron y = 15.705 x - 3.2033 0.914 0.956
Honey y = 8.645 x + 1.3433 0.964 0.981
3.3.2 True density
True density of seeds increased linearly with increase of maturity stage (Figure 2). The increase in seed bulk and true density parameters may be due to decrease of photosynthesis and accumulation of photosynthates, as maturity stage processes [12]. During initial maturation stage, despite with the high moisture
seeds are lighter than water; this characteristic can be used to design separation or cleaning process [28].
Common letters mean that there are no significant differences between mean at P≤0.05
Figure 2: Influence maturity stage on bean seed bulk and true density
Common letters mean that there are no significant differences between mean at P≤0.05
Figure 3: Influence maturity stage on bean seed porosity
Common letters mean that there are no significant differences between mean at P≤0.05
Figure 4: Influence maturity stage on bean seeds 1000 mass
3.3.3 Porosity
From the ANOVA, maturity stage had a significant effect on the porosity of both bean variety. The porosity of the two bean varieties decreases with increased in maturation of the bean seeds (Figure 3). The porosity is the fraction of the space in the bulk seeds which is not occupied by the seeds [29]. It depends on the geometry and surface properties of the material [28] and allow fluid to pass through the bulk. It is useful in the calculation of the rate of aeration and cooling, drying and heating and in the design of heat exchangers and other similar equipment for bean handling [30]. The seed with low porosity will dry very slowly; porosity has practical applications in the design of aeration systems during storage and enable designers to know the number of seeds that will enter a hollow seed tube of planters [31]. The regression relationship between porosity and maturity stage are represented by the equations in Table 4.
3.3.4 Thousand Seed Mass
The effect of time of maturation stage on 1000 seed mass of the two bean varieties is shown in Figure 4. As presented in Figure 4, the mass of the seeds increased linearly with increased maturation stage; higher in the iron bean variety than in the honey bean variety. Harvesting crops at early maturity stage usually resulted in yield loss due to high seed moisture content, high percentage of immature seeds and low 1000 seed weight; while delayed harvesting resulted in more seeds were filled and consequently, average seed weight increased [32, 33]. Seeds gradually attain viability and vigor during the developmental process as seed dry weight is accumulated during maturity [11]. The increase in dry weight of the seeds towards maturity reflects the accumulation of nonstructural carbohydrates, reducing sugars and fibre, relative to seed moisture content which showed a sharp fall [34]. From the results, it was observed that all the seeds harvested earlier than 20 DAF, had poorer seeds quality parameters owing to poor development of seeds and lesser food reserves, as reflected in the 1000 seed weight. The results are also in conformity with [35] in onion. The regression relationship between the bean seeds mass and maturity stage are represented by the equations in Table 4.
3.4. Frictional Properties
3.4.1. Coefficient of Static Friction
From the results, the static friction of the bean seeds was significantly (P≤ 0.05) influenced by the maturity stage of the bean in both varieties investigated in this 0
200 400 600 800 1000 1200 1400
15 20 25 15 20 25
Bulk Density True Density Maturity stage (days)
Den
sity (Kg
/m^3
)
iron honey
a a
a a
b b
b b
c
c c
c
0 5 10 15 20 25 30 35 40 45
15 20 25
Maturity stage (Days)
Porosity (%)
Iron Honey b
b
a,b
a,b
a
a
0 0.5 1 1.5 2 2.5 3 3.5 4 4.5 5
15 20 25
Maturity stage (days)
1000 seed
mass (K
g
)
Iron Honey
a
a
b
b
c
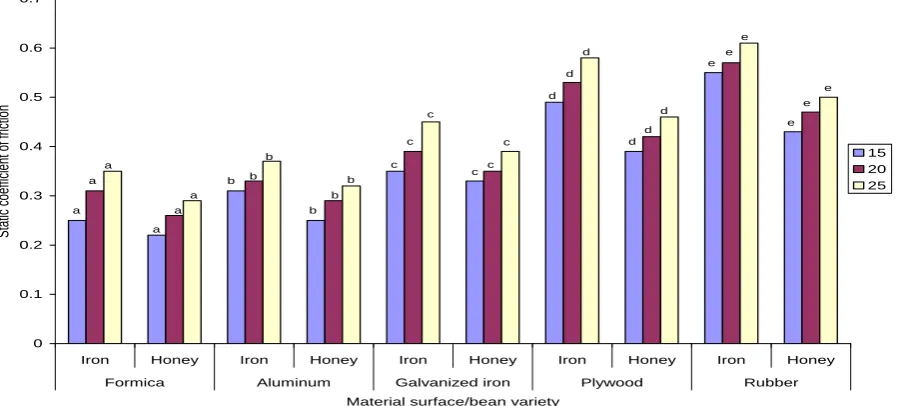
research. It was observed that the static coefficient of friction increased with increase in maturation for all the surfaces. The results show that all the seeds harvested earlier (15 DAF), had poorer static friction when compared to those harvested at 25 DAF, as reflected in Figure 5. At all maturity stage, the static coefficient of friction was greatest in rubber and lowest in Formica, which indicates smaller coefficient of friction values on smoother and polished surfaces. The regression relationships between maturity stage and static coefficients of friction on all test surfaces are presented in Table 5.
3.4.2 Angle of Repose
For both bean variety, ANOVA was found significant (p < 0.05) in terms of the maturity stage for angle of repose. The angle of repose was higher for honey bean seed at all the maturity stages evaluated in this study. The decline in the angle of repose for both variety of
beans as maturation progresses (Table 6), could be attributed to the decline in moisture content of the seeds as maturation progresses. Gharibzahedi et al. [36] reported that seeds might stick together at the higher moisture content, which results in less flowability and better stability, thereby increasing the angle of repose. Angle of repose is importance in designing hopper openings, sidewall slopes of storage bins, chutes for bulk transporting of seeds and it is particularly useful for calculating the quantity of granular materials which can be placed implies or flat storages [36]; therefore, the maturity stage of bean seeds should be taken into account while designing processing and handling equipment. The regression relationship existing between maturity stage and angle of repose is presented in Table 6. From the above results, it can be seen that crop physical properties and quality parameters are associated with stage at which the crop is harvested.
Common letters mean that there are no significant differences between mean at P≤0.05
Figure 5: Influence maturity stage on bean seed coefficient of static friction
Table 5: Regression equations as a function of maturity stage with their respective coefficient of determination (R2) and correlation (r) for frictional properties of iron and honey bean.
Parameter Surface Bean variety Regression equation R2 r
coefficient of
static friction Rubber
Iron y = 0.03 x + 0.5167 0.964 0.993
Honey y = 0.035 x + 0.3967 0.993 0.996
Plywood Iron y = 0.045 x + 0.4433 0.996 0.982
Honey y = 0.035 x + 0.3533 0.993 0.997
Galvanized iron Iron y = 0.05 x + 0.3067 0.949 0.974
Honey y = 0.03 x + 0.3033 0.964 0.981
Aluminum Iron y = 0.03 x + 0.2833 0.964 0.982
Honey y = 0.035 x + 0.22 0.942 0.971
Formica Iron y = 0.05 x + 0.2033 0.986 0.993
Honey y = 0.035 x + 0.1867 0.993 0.996
Angle of repose Iron y = -4.445 x + 43.977 0.998 -0.999
Honey y = -4.47 x + 50.803 0.956 -0.978 0
0.1 0.2 0.3 0.4 0.5 0.6 0.7
Iron Honey Iron Honey Iron Honey Iron Honey Iron Honey
Formica Aluminum Galvanized iron Plywood Rubber
Material surface/bean variety
Sta
tic co
eff
ici
en
t o
f friction
15 20 25
a a
a
a a
a b b
b
b b
b c
c c
c c c
d d
d
d d
d e
e e
e e
Table 6: Angle of repose of iron and honey bean at different maturity stage
Parameter Variety Maturity stage (Days)
15 20 25
Angle of response Iron 39.62a ±0.82 34.91b ±0.95 30.73c ±3.40
Honey 45.78a ±0.99 42.97b ±1.25 36.84c ±2.48
Values are mean ± SD. Means with similar superscript in a column did not differ significantly (p ≤ 0.05).
4. CONCLUSION
This research results establish a strong correlation (≥ ± 0.92) between the geometric, frictional, gravimetric properties and maturation of the two bean varieties. From the results, the moisture content of the two bean varieties declined (iron bean seeds 43.54 %; honey bean seeds 44.5 %) with increase in maturation. Over the course of a maturation period, all the geometric (dimensional) properties increased linearly for both bean varieties; the average length, width and thickness of seeds ranged from 6.80 to 11, 3.88 to 6.7 and 1.94 to 4.45 mm respectively for the iron bean; and 5.72 to 8.2, 3.85 to 5.19 and 1.56 to 2.8 mm respectively for the honey bean. In respect to the bean seeds gravimetric properties, only the true and bulk densities increased with maturation (15 DAF to 25 DAF). The true density increased linearly from 817.75 to 1207 kg/m3 in iron bean and 774.25 to 1144 kg/m3 in honey bean; likewise, the bulk density increased from 464.5 to 761.75 kg/m3 and 544.75 to 867.66 kg/m3 in the iron bean and honey bean seeds respectively. But the porosity of the bean seeds decreased with increase in the maturation, iron bean (42.15 to 36.37%) and honey bean (34.19 to 26.41%). Furthermore, as for the frictional properties of the bean seeds, the static coefficient of friction of the seeds increased for all five surfaces during maturation, namely; Formica (iron bean, 0.24 to 0.35; honey bean 0.22 to 0.28), aluminum (iron bean 0.31-0.37; honey bean 0.25 to 0.32), galvanized iron (iron bean, 0.35-0.44; honey bean, 0.33 to 0.39), plywood (iron bean, 0.49 to 0.58; honey bean 0.39 to 0.46), and rubber (iron bean 0.55 to 0.61; honey bean 0.43 to 0.50). The angle of response of the seeds decreased significantly during maturation, iron bean (39.62 to 30.73%) and honey bean (45.78 to 36.84%). The results of all these physical properties could be used in the design of harvesting, cleaning, grading and separation equipment for bean seeds. From the above results, it can be seen that crop physical properties and quality parameters are associated with stage at which the crop is harvested.
5. REFERENCES
[1] Lyimo, M., Mugula, J., Elias, T. “Nutritive composition of broth from selected bean varieties
cooked for various periods.” Journal of the Science of Food and Agriculture, 58(4):, pp535-539, 1992. [2] Geil, P.B., Anderson, J. W. “Nutrition and health
implications of dry beans: a review.” Journal of the American College of Nutrition, 13(6):, pp 549-558, 1994.
[3] Gonzalez D. E., Valadez-Vega, M. D. C., Reynoso-Camacho, R., Loarca-Pina, G. “Tannins, trypsin inhibitors and lectin cytotoxicity in tepary (Phaseolus acutifolius) and common (Phaseolus
vulgaris) beans.” Plant Foods for Human
Nutrition, 60(3). Pp. 137–145. 2005.
[4] Aghkhani, M. H., Ashtiani, S. H. M., Motie, J. B. “Physical properties of Christmas Lima bean at different moisture content.” International Agrophysics, volume 26, pp 341–346. 2012. [5] Ensminger, A. H., Ensminger, M. E., Konlande, J. E.,
Robson, J. R. K. Food & nutrition encyclopaedia
(2nd Ed.). Boca Raton, FL: CRC Press. 1994. [6] Wortmann, C. S., Kirkby, R. A., Eledu, C. A., Allen, D.
J. “Atlas of Common bean (Phaseolus vulgarisL.)
production in Africa.” CIAT Publication (297), 2004.
[7] Dursun, E., Dursun I. “Some physical properties of caper seed”. Biosystem Engineering, 92, pp 237-245, 2005.
[8] Hazbavi, I. “Moisture dependent physico-mechanical properties of Iranian okra (Ablemoschus esculentus L.) seed”. African Journal of Biotechnology. Vol. 12(42), pp. 6098-6106, 2003.
[9] Mohsenin, N. N. Physical Properties of Plant and Animal Materials, 2nd ed. Gordon and Breach Science Publishers, New York. 1986.
[10] Mehta, C. J., Kuhad, M. S., Sheoran, I. S., Nandwal, A.S. Studies on seed development and germination in chickpea cultivars. Seed Res., 21(2):, pp 89-91, 1993.
[11] Olasoji J. O., Aluko, A.O., Adeniyan, O.N., Olanipekun, S.O., Olosunde A.A., Okoh J. O. “Effect of time of harvest on physiological maturity and kenaf (Hibiscus canabinus) seed quality.” African Journal of Plant Science Vol. 6(10), pp. 282-289, 2012.
[14] AOACOfficial Methods of Analysis, 17th Ed. Association of Official Analytical Chemists, Gaithersburg, USA. 2000.
[15] Ghasemi, V. M, Mobli H, A. Jafari, Keyhani, A.R., Heidari, S. M., Rafiee, S., Kheiralipour, K. “Some physical properties of rough rice (Oryza Sativa) grain.” Journal of Cereal Science. 47: 2008, pp. 496-5012000.
[16] Kabas, O., Ozmerzi, A., Akinci, I. “Physical properties of cactus pear (Opuntia ficus india L.) grown wild in Turkey.” Journal of Food Engineering. 73:, pp 198-202, 2006.
[17] Dutta, S. K., Nema, V. K., Bhardwaj, R. J. “Physical properties of gram”. Journal of Agricultural Engineering Research. 39:, pp 259-268, 1988. [18] Gezer, I., Haciseferogullari, H., Demir, F. “Some
physical properties of Hacihaliloglu apricot pit and its kernel.” Journal of Food Engineering. 56: pp 49-57, 2002.
[19] Mullah, S. K. “The effect on moisture content on the physical properties of groundnut kernels.” Tropical Science. 32:, pp, 129-136, 1992.
[20] Berti, M. T., Johnson, B. L., Manthey L. K. “Seed physiological maturity in Cuphea.” Industrial Crops and Products Journal 25:, pp190–201, 2007. [21] Bedance, G. M., Gupta, M. L., D. L. George, D. L. “Optimum harvest maturity for guayule seed.”
Industrial Crops Production. 24:, pp26–33, 2006. [22] Demir, I., Ellis R. H. “Changes in potential seed
longevity and seedling growth during seed development and maturation in marrow (Cucurbita pepo L.).” Seed Science Research 3:, pp 247–257, 1993.
[23] Pieta, F. C., Ellis, R. H. “The development of seed quality in spring barley in four environments: I. Germination and longevity”. Seed Sci. Res. 1, pp 163–177:1991.
[24] Gonçalves, E. M., Brazão, R, Pinheiro, J., Abreu, M. S., Cristina, L. M, C, Martins, M. M. “Influence of maturity stage on texture, pectin composition and microstructure of pumpkin.” In: Mercosur Congress on Process Systems Engineering, 4. Rio de Janeiro. Anais... Rio de Janeiro: Empromer, 2005.
[25] Summerfield, R. J., Asumadu, H., Ellis, R. H., Qi, A. “Characterization of the photoperiodic response of post-flowering development in maturity isolines of soabean [Glycine max (L.) Mer-rill] ‘Clark’”. Journal Annals of Botany 82:, pp 765–771 1998.
[26] Ellis, R. H. Asumadu H, Qi, A, Summerfield, R.J., “Effects of photoperiod and maturity genes on plant growth, partitioning, radiation use efficiency and yield in soybean [Glycine max (L.) Merrill] ‘Clark’”. Journal Annals of Botany 85:, pp 335–343, 2000.
[27] Gupta, R. K.; Das, S. K. Fracture resistance of sunflower seed and kernel to compressive loading. Journal of Food Engineering, Dublin, v. 46, n. 2pp. 1-8, 2000.
[28] Mpotokwane, S. M., Gaditlhatlhelwe, E., Sebaka, A., and Jideani, V. A. “Physical properties of bambara groundnuts from Botswana.” Journal of Food Engineering, 89(1), 2008, pp 93–98. 2008.
[29] Karababa E, Coşkuner, Y. “Moisture dependent physical properties of dry sweet corn kernels.”
International J. Food Properties, 10, pp 549-560, 2007.
[30] Asoegwu, S. N., Ohanyere, S. O., Kanu, O. P., Iwueke, C. N. “Physical properties of African oil bean seed (Pentaclethra macrophylla),” VIII, –16, 2006.
[31] Akaaimo, D. I., Raji, A. O. “Some physical and engineering properties of prosopis Africana seed.”
Biosystems Engineering, 95(2), pp 197–205,
2006.
[32] Siddique, A.B., Wright, D. Effects of time of harvest at different moisture contents on seed fresh Weight, dry weight, quality (Viability and Vigour) and food reserves of peas (Pisum sativum L.).
Asian Journal of Plant Sciences, 2:, pp 983-992, 2003
[33] Nimje, P.M., Gandhi, A.P. “Effect of stage of harvesting and nitrogen levels on yield and
usitatissimum”. Journal of Oilseeds Research., 11:, pp 141-151,1994.
[34] Ketsa, S., Poopattarangk, S. “Growth, physico-chemical changes and harvest indices of small edible-podded peas (Pisum sativum L. Var. macrocarpon).” Tropical Agriculture., 68:, pp 274-278, 1991.
[35] Gouda, G. H., “Effect of stages of harvesting and drying methods on seed quality in onion. M. Sc. (Agri.) Thesis¸” University of Agricultural Sciences, Dharwad, India. 1997.