Doctoral Dissertations Student Theses and Dissertations
Fall 2012
Data fusion by using machine learning and computational
Data fusion by using machine learning and computational
intelligence techniques for medical image analysis and
intelligence techniques for medical image analysis and
classification
classification
Beibei ChengFollow this and additional works at: https://scholarsmine.mst.edu/doctoral_dissertations
Part of the Electrical and Computer Engineering Commons Department: Electrical and Computer Engineering
Department: Electrical and Computer Engineering
Recommended Citation Recommended Citation
Cheng, Beibei, "Data fusion by using machine learning and computational intelligence techniques for medical image analysis and classification" (2012). Doctoral Dissertations. 1974.
https://scholarsmine.mst.edu/doctoral_dissertations/1974
This thesis is brought to you by Scholars' Mine, a service of the Missouri S&T Library and Learning Resources. This work is protected by U. S. Copyright Law. Unauthorized use including reproduction for redistribution requires the permission of the copyright holder. For more information, please contact [email protected].
DATA FUSION BY USING MACHINE LEARNING AND COMPUTATIONAL INTELLIGENCE TECHNIQUES FOR MEDICAL IMAGE ANALYSIS AND
CLASSIFICATION
by
Beibei Cheng
A DISSERTATION
Presented to the Faculty of the Graduate School of the MISSOURI UNIVERSITY OF SCIENCE AND TECHNOLOGY
In Partial Fulfillment of the Requirements for the Degree
DOCTOR OF PHILOSOPHY in COMPUTER ENGINEERING 2012 Approved by: R.J. Stanley, Advisor W. V. Stoecker R. H. Moss H. Xiao Z. Yin
2012 Beibei Cheng All Rights Reserved
PUBLICATION DISSERTATION OPTION
This dissertation has been prepared in the style utilized by the Missouri University of Science and Technology and consists of the following ten articles that published as follows:
Paper I, Cheng B., Stanley R.J., Stoecker W.V., Stricklin S.M., “Analysis of Clinical and Dermoscopic Features for Basal Cell Carcinoma Neural Network Classification”, has been published in Skin Research and Technology, 2012 Jun 22. [Epub ahead of print]
Paper II, Cheng B., Stanley R.J., Stoecker W.V., “Automatic Dirt Trail Analysis in Dermoscopy Images”, has been published in Skin Research and Technology, 2012 Jan 11. [Epub ahead of print]
Paper III, Cheng B., Erdos D., Stanley R.J., Stoecker W.V., Hinton K., “Automatic Telangiectasia Analysis in Dermoscopy Images using Adaptive Critic Design”, has been published in Skin Research and Technology, 2011 Dec 5. [Epub ahead of print]
Paper IV, Cheng B., Stanley R.J., Soumya D., Antani S., Thoma G.R., “Automatic Detection of Arrow Annotation Overlays in Biomedical Images”, has been published in International Journal of Healthcare Information Systems and Informatics (IJHISI), International Journal of Healthcare Information Systems and Informatics, October-December 2011, 6(4), pp.23-41.
Paper V, Cheng B., Erdos D., Stanley R.J., Stoecker W.V., Calcara D., Gomez D., “Automatic Detection of Basal Cell Carcinoma Using Telangiectasia Analysis in Dermoscopy Skin Lesion Images”, has been published in Skin Research and Technology, August 2011, 17(3), pp. 278–287.
Paper VI, Cheng B., Antani S., Stanley R.J., Thoma G.R., “Graphical Figure Classification Using Data Fusion for Integrating Text and Image Features”, have been submitted to SPIE Electronic Imaging, San Francisco, California, 2013.
Paper VII, Cheng B., Antani S., Stanley R.J., Thoma G.R., “Graphical Image Classification Combining an Evolutionary Algorithm and Binary Particle Swarm Optimization”, Proceedings of SPIE Electronic Imaging, San Francisco, California, vol.8297, pp.1-8, 2012.
Paper VIII, Cheng B., Antani S., Stanley R.J., Thoma G.R., “Automatic Segmentation of Subfigure Image Panels for Multimodal Biomedical Document Retrieval”, Proceedings of the SPIE Electronic Imaging, San Francisco, California, vol. 7874, pp. Z-1-11, 2011.
Paper IX, Cheng B., Stanley R.J., Szalapski T., Stoecker W.V., “A Hybrid Computational Intelligence Algorithm for Automatic Skin Lesion Segmentation in Dermoscopy
Images”, Proceedings of Artificial Neural Networks in Engineering (ANNIE), St. Louis, MO, vol.20, pp.379-386, 2010.
Paper X, Cheng B., Stanley R.J., Antani S., Thoma G.R., “A Novel Computational Intelligence based Approach for Medical Image Artifacts Detection”, Proceedings of the 2010 International Conference on Artificial Intelligence and Pattern Recognition, Orlando, FL, pp.113-20, July 2010.
ABSTRACT
Data fusion is the process of integrating information from multiple sources to produce specific, comprehensive, unified data about an entity. Data fusion is categorized as low level, feature level and decision level. This research is focused on both investigating and developing feature- and decision-level data fusion for automated image analysis and classification. The common procedure for solving these problems can be described as: 1) process image for region of interest’ detection, 2) extract features from the region of interest and 3) create learning model based on the feature data. Image processing techniques were performed using edge detection, a histogram threshold and a color drop algorithm to determine the region of interest. The extracted features were low-level features, including textual, color and symmetrical features. For image analysis and classification, feature- and decision-level data fusion techniques are investigated for model learning using and integrating computational intelligence and machine learning techniques. These techniques include artificial neural networks, evolutionary algorithms, particle swarm optimization, decision tree, clustering algorithms, fuzzy logic inference, and voting algorithms. This work presents both the investigation and development of data fusion techniques for the application areas of dermoscopy skin lesion discrimination, content-based image retrieval, and graphic image type classification.
ACKNOWLEDGMENTS
First and foremost, I would like to offer my sincerest gratitude to my advisor, Dr. R. J. Stanley. Dr. Stanley has supported me with his knowledge and patience while giving me the freedom to work on my own ideas. Without him, I would not have been able to overcome so many difficulties and accomplish so many publications. One could not ask for a better, friendlier advisor.
I am also extremely indebted to my committee members: Dr. W.V. Stoecker, Dr. R. Moss, Dr. H. Xiao, and Dr. Z. Ying. Dr. Stoecker helped me gain domain knowledge in the dermatology related aspects of my research. Dr. Moss provided a great deal of advice in both my research and my paper written. The suggestions given by Dr. Xiao and Dr. Ying during both my comprehensive exam and final defense were very useful toward improving not only my research but also my dissertation.
I must also acknowledge Dr. S. Antani and Dr. G. Thoma from the U.S. National Library of Medicine: National Institutes of Health. Dr. Antani and Dr. Thoma offered many interesting research topics and gave me the opportunity to get involved with the projects. I also appreciate their time spent in reviewing my paper. This work would not have been possible without their continued help and support. Last but not least, I am thankful to my ever-supportive husband, Dr. R. Wang, and my mother, Ms. L. Zhao. Their love, encouragement, and faith in my abilities kept me going throughout my work.
TABLE OF CONTENTS
PUBLICATION DISSERTATION OPTION ... iii
ABSTRACT ... v
ACKNOWLEDGMENTS ... vi
LIST OF ILLUSTRATIONS ... xiv
LIST OF TABLES ... xviii
SECTION 1. INTRODUCTION ... 1
1.1 BACKGROUND AND PROBLEM STATEMENT ... 1
1.2 SUMMARY OF CONTRIBUTIONS ... 2
PAPER ... 5
I. ANALYSIS OF CLINICAL AND DERMOSCOPIC FEATURES FOR BASAL CELL CARCINOMA NEURAL NETWORK ... 5
ABSTRACT ... 5
1. INTRODUCTION ... 6
2. DESCRIPTION OF FEATURE CATEGORIES ... 8
3. DISCRIMINATION ALGORITHMS ... 11
3.1 EVOLVING ARTIFICIAL NEURAL NETWORKS (EANN’s) ... 11
3.2 EVOLVING ARTIFICIAL NEURAL NETWORK ENSEMBLES (EANNE’s) ... 12
4. EXPERIMENTS PROCEDURE ... 13
5. RESULTS AND DISCUSSIONS ... 14
6. CONCLUSIONS ... 16
ACKNOWLEDGEMENTS ... 16
REFERENCES ... 17
II. AUTOMATIC DIRT TRAIL ANALYSIS IN DERMOSCOPY IMAGES ... 19
ABSTRACT ... 19
1. INTRODUCTION ... 20
2. METHODOLOGY ... 21
2.2 DIRT TRAIL DETECTION ALGORITHM OVERVIEW ... 21
3. DIRT TRAIL DETECTION ALGORITHM ... 22
3.1 GAUSSIAN BANDPASS FILTER ... 22
3.2 MEDIAN FILTER ... 24
3.3 IMAGE SUBTRACTION ... 25
3.4 HISTOGRAM PROCESSING ... 25
3.5 LOGIC OPERATION ... 26
3.6 NOISE FILTERING FOR HAIRS AND BUBBLES ... 26
3.7 NOISE FILTERING FOR ISOLATED NOISE ... 27
4. CLASSIFIER INPUT FEATURES AND CLASSIFIER METHODOLOGY ... 28
4.1 FEATURES COMPUTED FOR LESION DISCRIMINATION ... 28
4.2 CLASSIFIER DESCRIPTION ... 28
5. EXPERIMENTAL RESULTS ... 30
5.1 DIRT TRAIL MASK EXAMPLES ... 30
5.2 FEATURE ANALYSIS USING LOGISTIC REGRESSION ... 30
5.3 LESION DISCRIMINATION RESULTS ... 30
6. CONCLUSIONS ... 33
ACKNOWLEDGMENTS ... 33
REFERENCES ... 34
III. AUTOMATIC TELANGIECTASIA ANALYSIS IN DERMOSCOPY IMAGES USING ADAPTIVE CIRTIC DESIGN ... 35
ABSTRACT ... 35
1. INTRODUCTION ... 36
2. PROBLEM DESCRIPTION ... 41
3. ADAPTIVE CRITIC DESIGN METHODOLOGY ... 45
4. RESULTS AND DISCUSSION ... 48
4.1 DIAGNOSTIC ACCURACY ... 48
4.2 STRUCTURE DETECTION VS. DIAGNOSIS ... 49
5. CONCLUSIONS AND FUTURE WORK ... 50
IV. AUTOMATIC DETECTION OF ARROW ANNOTATION OVERLAYS IN
BIOMEDICAL IMAGES ... 53
ABSTRACT ... 53
1. INTRODUCTION ... 54
2. ARROW DETECTION PROCESS ... 57
2.1 OBJECT SEGMENTATION ... 57
2.2. FEATURE EXTRACTION ... 58
2.2.1 Region Property Features. ... 59
2.2.2 Shape Features. ... 60
2.2.3 Correlation-based Features. ... 61
2.3 CLASSIFIER ALGORITHMS ... 62
3. EXPERIMENTS PERFORMED ... 64
4. DISCUSSION ... 69
5. CONCLUSIONS AND FUTURE WORK ... 72
ACKNOWLEDGEMENTS ... 72
REFERENCES ... 73
APPENDIX ... 76
V. AUTOMATIC DETECTION OF BASAL CELL CARCINOMA USING TELANGIECTASIA ANALYSIS IN DERMOSCOPY SKIN LESION IMAGES ... 80
ABSTRACT ... 80
1. INTRODUCTION ... 81
2. METHODS ... 83
2.1 TELANGIECTASIA DETECTION OVERVIEW ... 83
2.2 DATA SET USED ... 83
2.3 PRE-PROCESSING ... 84
2.4 COLOR-DROP VESSEL DETECTION ... 84
2.5 NOISE ELIMINATION ... 86
2.5.1 Brown Network Filtering.. ... 87
2.5.2 Hair Filtering. ... 88
2.5.4 Blob Filtering for Mask Density. ... 89
2.5.5 Post-processing: Connecting Vessel Segments. ... 89
2.5.6 Post-processing: Length and Area Lower Bounds.. ... 90
2.5.7 Post-processing: Independent and Principal Component Analysis, Histogram Pursuit. ... 91
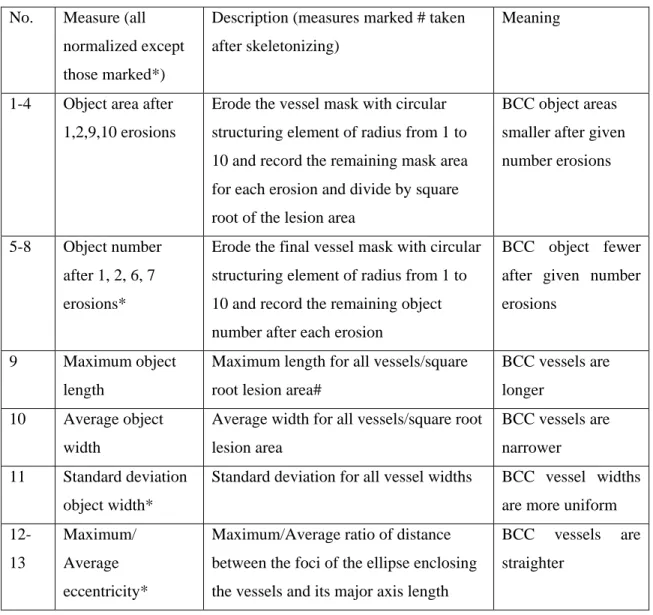
2.6 VESSEL FEATURE GENERATION ... 91
2.7 NEURAL NETWORK METHODS FOR BCC DIAGNOSIS ... 93
3. EXPERIMENTS PERFORMED ... 94
4. RESULTS ... 95
5. DISCUSSION ... 96
5.1 DIAGNOSTIC ACCURACY ... 96
5.2 EXAMPLES OF ERRORS ... 96
5.3 RELATION TO CLINICAL PRACTICE ... 97
5.4 STRUCTURE DETECTION VS. DIAGNOSIS ... 97
5.5 LIMITATIONS OF STUDY AND SCOPE OF FUTURE RESEARCH ... 97
REFERENCES ... 99
VI. GRAPHICAL FIGURE CLASSIFICATION USING DATA FUSION FOR INTEGRATING TEXT AND IMAGE FEATURES ... 101
ABSTRACT ... 101
1. INTRODUCTION ... 102
2. RELATED WORK ... 104
3. IMAGE FEATURE EXTRACTION AND SELECTION ... 105
3.1 IMAGE FEATURE EXTRACTION ... 105
3.2 IMAGE FEATURE SELECTION ... 105
4. TEXT FEATURE EXTRACTION AND SELECTION... 107
4.1 TEXT FEATURE EXTRACTION ... 107
4.2 TEXT FEATURE SELECTION ... 107
5. OUTPUT COMBINATION ... 109
6. EXPERIMENTAL RESULTS ... 110
ACKNOWLEDGEMENTS ... 113
REFERENCES ... 114
VII. GRAPHICAL IMAGE CLASSIFICATION COMBINING AN EVOLUTIONARY ALGORITHM AND BINARY PARTICLE SWARM OPTIMIZATION ... 115
ABSTRACT ... 115 1. INTRODUCTION ... 116 2. RELATED WORK ... 118 3. METHODS ... 120 3.1 FEATURE EXTRACTION ... 120 3.2 CLASSIFIER ... 121
4. OPTIMAL FEATURE SELECTION ... 123
4.1 EVOLUTIONARY ALGORITHM (EA) ... 123
4.2 BINARY PARTICLE SWARM OPTIMIZATION (BPSO) ... 123
4.3 EABPSO ... 124
5. EXPERIMENTAL SETUP AND RESULTS ... 125
5.1 DISCUSSION ... 126
6. CONCLUSIONS ... 128
ACKNOWLEDGEMENTS ... 128
REFERENCES ... 129
VIII. AUTOMATIC SEGMENTATION OF SUBFIGURE IMAGE PANELS FOR MULTIMODAL BIOMEDICAL DOCUMENT RETRIEVAL ... 131
ABSTRACT ... 131
1. INTRODUCTION ... 132
2. PRIOR WORK ... 134
3. METHODS ... 135
3.1 IMAGE TYPE IDENTIFICATION ... 135
3.2 SEGMENTING MULTI-PANEL REGULAR IMAGES ... 136
3.3 SEGMENTING MULTI-PANEL ILLUSTRATION IMAGES... 137
5. CONCLUSIONS ... 146
ACKNOWLEDGEMENTS ... 146
REFERENCES ... 147
IX. A HYBRID COMPUTATIONAL INTELLIGENCE ALGORITHM FOR AUTOMATIC SKIN LESION SEGMENTATION IN DERMOSCOPY IMAGES ... 149
ABSTRACT ... 149
1. INTRODUCTION ... 150
2. PREPROCESSING ... 152
3. EVOLVING VECTOR QUANTIZATION ... 153
3.1 STANDARD PSO ... 153
3.2 DIFFERENTIAL EQUATION-BASED PSO ... 154
3.3 POSTPROCESSING ... 155
4. RESULTS AND DISCUSSION ... 157
5. CONCLUSIONS AND FUTURE WORK ... 158
REFERENCES ... 159
X. A NOVEL COMPUTATIONAL INTELLIGENCE-BASED APPROACH FOR MEDICAL IMAGE ARTIFACTS DETECTION ... 160
ABSTRACT ... 160
1. INTRODUCTION ... 161
2. FEATURE GENERATION ... 165
3. ADAPTIVE CRITIC DESIGN METHODOLOGY ... 170
4. OTHER CLASSIFICATION ALGORITHMS ... 173
4.1 MLP BACKPROPGATION NEURAL NETWORK ... 173
4.2. PARTICLE SWARM OPTIMIZATION (PSO) FOR TRAINING OF A MLP NEURAL NETWORK ... 173
4.3. GENETIC ALGORITHM (GA) FOR TRAINING OF A MLP NEURAL NETWORK ... 174
5. RESULTS AND DISCUSSION ... 175
ACKNOWLEDGEMENTS ... 177 REFERENCES ... 178 SECTION 2. CONCLUSIONS ... 180 BIBLIOGRAPHY ... 181 VITA ... 182
LIST OF ILLUSTRATIONS
Page
PAPER I
Figure 1. Examples of BCC BASAL structures visible using dermoscopy. ... 7
PAPER II Figure 1. Dirt trail examples in dermoscopic skin lesion images, shown by arrows, with dirt trails containing dots and clods of varying sizes. ... 20
Figure 2. Overview of the dirt trail detection algorithm. ... 23
Figure 3. RGB plane. ... 23
Figure 4. Gaussian bandpass filter representation in the spatial frequency domain. ... 23
Figure 5. Bandpass-filtered images converted to spatial domain for R, G, and B planes.. ... 24
Figure 6. Median filter output images from R, G, B planes. ... 25
Figure 7. Output images from scalarized Otsu’s method for R, G, B planes. ... 26
Figure 8. Otsu’s output image A after logical AND of the threshold color plane images. ... 26
Figure 9. Image overlay ... 27
Figure 10. Dirt trail detection mask examples.. ... 31
Figure 11. ROC curve and AUC (area under curve) for backpropagation neural network. ... 32
PAPER III Figure 1. Telangiectasia example.. ... 37
Figure 2. Overview of vessel detection and discrimination process. ... 38
Figure 3. Overview of image analysis algorithm. ... 38
Figure 4. Examples of telangiectasia in the skin image from Figure 1 and the vessel mask generated using the algorithm in Figure 3.. ... 39
Figure 5. Images with varied contrast enhancement (CE) . ... 42
Figure 6.Vessel mask overlays change with varying contrast enhancement. ... 43
Figure 7. Schematic diagram of ADHDP. ... 45
Figure 8. Neural network structure of the critic network. ... 47
PAPER IV
Figure 1. Medical image with arrows.. ... 55
Figure 2. Overview of arrow detection process. ... 56
Figure 3. Edge detection operator mask. ... 58
Figure 4. Object segmentation example.. ... 59
Figure 5. MinPixelNo feature.. ... 60
Figure 6. Samples for generating WDD features. ... 62
Figure 7. The WDD functions used to compute arrow features. ... 62
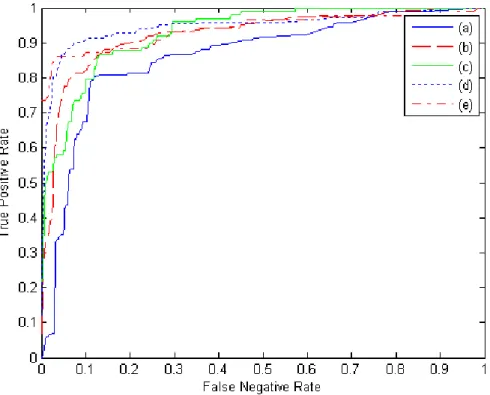
Figure 8. ROC curves for a representative test set for case 1 for the different classifiers with M=5, N=75 (except for Backpropagation ANN). ... 66
Figure 9. Arrow objects incorrect classified.. ... 70
Figure 10. Non-arrow objects incorrect classified. ... 71
PAPER V Figure 1. Telangiectasia.. ... 82
Figure 2. Overview--BCC diagnosis by telangiectasia detection. ... 83
Figure 3. Direction Mask Used for Pixel Marking. ... 85
Figure 4. Mask image with different red drops.. ... 85
Figure 5. Mask Images with Different NumPix Values. ... 86
Figure 6. Brown Area Filtering.. ... 87
Figure 7. Hair filtering.. ... 88
Figure 8.Bubble filtering. ... 89
Figure 9. Blob density filtering. ... 89
Figure 10. (a) Mask after noise filtering. (b) Mask after dilation, radius 3, and erosion, radius 2. ... 90
Figure 11. Lower area bound. ... 90
Figure 12. Receiver operating characteristic curve and area under curve (AUC) results for different feature combinations. ... 95
Figure 13. BCC misdiagnosed. ... 96
Figure 14. Benign lesion misdiagnosed.. ... 98
PAPER VI Figure 1. Examples of graphical figure with its caption. ... 103
PAPER VII
Figure 1. Graphical image type examples. ... 117
Figure 2. Examples illustrating problems, discussed in Section 2, in existing approach after preprocessing... 119
Figure 3. Image preprocessing example. ... 120
Figure 4. Overview of EABPSO procedure. ... 124
Figure 5. Root Mean Squared Error (RMSE) versus iteration number for each of the feature selection schemes. ... 126
PAPER VIII Figure 1. Examples of different types of multi-panel images. ... 133
Figure 2. Overview of sub-image segmentation process. ... 135
Figure 3. Image processing algorithm example. ... 137
Figure 4. Overview of multi-panel images decomposition process. ... 138
Figure 5. Sobel edge operator processing.. ... 139
Figure 6. Form bounding boxes. ... 139
Figure 7. Incorrect bounding box segmentation. ... 140
Figure 8. Steps for applying Particle Swarm Optimization algorithm. ... 141
Figure 9. Membership Function. ... 142
Figure 10. Sample results of PSO clustering with different fitness functions. ... 143
Figure 11. Input image and its fitness function. ... 145
PAPER IX Figure 1. Overview of lesion segmentation process. ... 151
Figure 2. Preprocessing example. ... 152
Figure 3. Evolving vector quantization algorithm flow chart. ... 154
Figure 4. Example of image output within ten iterations ... 155
Figure 5. Post-processing ... 156
PAPER X Figure 1. Medical image examples. ... 161
Figure 2. Overview of arrow detection and discrimination process. ... 163
Figure 3. Edge detection. ... 163
Figure 5. MinPixelNo feature. ... 165
Figure 6. The WDD functions used to compute arrow features. ... 167
Figure 7. Samples for generating WDD features. ... 167
Figure 8. Falsely identified arrow. ... 169
Figure 9. Arrows with different rotation value. ... 169
Figure 10. Schematic diagram of ADHDP. ... 171
Figure 11. Basic concept of PSO. ... 173
LIST OF TABLES
Page
PAPER I
Table 1. Overview of feature groups examined for lesion discrimination. ... 9
Table 2. Feature combinations for lesion discrimination. ... 10
Table 3. Average area under the ROC curve discrimination results for different feature and discrimination algorithm combinations. ... 14
PAPER II Table 1. Descriptions for Dirt Trail Dermoscopic Features ... 28
PAPER III Table 1. Vessel-based features investigated with descriptions ... 44
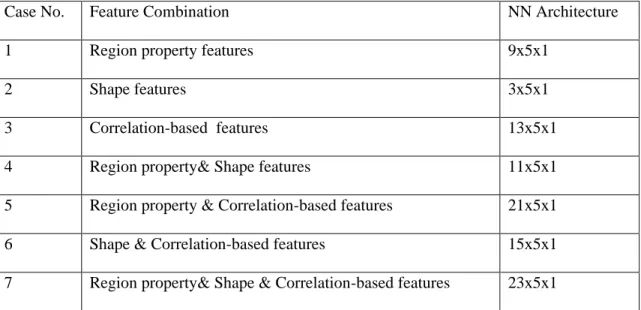
PAPER IV Table 1. Seven cases with their feature combinations and NN architectures. ... 65
Table 2. Average area under the ROC curve test results and (precision/recall) for different algorithms and feature combinations. ... 67
PAPER V Table 1. Vessel-based features investigated with descriptions. ... 92
Table 2. Feature measures generated from final vessel mask, included in final model, SAS procedure logistic. ... 93
PAPER VI Table 1. Top 20 features with its information gain value. ... 107
Table 2. Top 20 features with its Chi-square value. ... 108
Table 3. Five classes of fuzzy set union and intersection. ... 109
Table 4. Performance comparison for image feature set with MLP NN classifier. ... 111
Table 5. Performance for text feature set with MLP NN classifier. ... 112
PAPER VII
Table 1. Extracted Features. ... 122 Table 2. Performance comparisons for different feature combinations. ... 127
PAPER VIII
Table 1. Information gain and chi-square value for image features useful in detecting image type. ... 136 Table 2. Fuzzy rule. ... 143 Table 3. Result of image type identification. ... 144
PAPER IX
Table 1. Standard PSO and DEPSO error result with three planes. ... 157
PAPER X
1. INTRODUCTION
1.1
BACKGROUND AND PROBLEM STATEMENTThe analysis of medical images is essential in modern medicine. Both new challenges and opportunities arise for different phases of the clinical routine and image retrieval as the amount of not only patient data but also medical publications increase. This work uses state-of-the-art data fusion techniques for the following three aspects:
Dermoscopy skin lesion discrimination
Content-based image retrieval
Graphic image type classification
Data fusion is the process of integrating information from multiple sources to produce specific, comprehensive, unified data about an entity [1]. Data fusion is categorized as low-level, feature-low-level, and decision-level. Low-level data fusion combines several sources of raw data to produce new raw data. Feature-level data fusion combines the descriptive features extracted from multiple sensors, measuring either a similar or a dissimilar phenomenon into a single feature vector for discrimination purposes.
Decision-level data fusion involves the fusion of a sensor using preliminary decisions, made from individual or multiple sensors and information sources.
Techniques for data fusion include computational intelligence, machine learning, statistical estimation, and more. This research focused on developing both machine learning techniques and computational intelligence for data fusion.
Machine learning is defined as computer program that “is said to learn from experience
E with respect to some class of tasks T and performance measure P, if its performance at tasks in
T, as measured by P, improves with experience E” [2]. The approaches of machine learning
include decision tree learning, artificial neural network, clustering, and so forth. Each approach can be overviewed as follows. A decision tree is a decision support tool that uses a tree-like graph to illustrate the choices available to a decision maker, every possible choice with its estimated outcome being shown as a separate branch of the tree [3]. An artificial neural network can be viewed as a parallel and distributed processing system which consists of a huge number of simple, massively connected processors [4]. Clustering is the task of partitioning data objects (patterns, entities, instances, observances, and units) into a certain number of clusters (groups, subsets, or categories) so that the objects in the same cluster are more similar to each other than to those in other clusters [5].
Computational intelligence is a set of nature-inspired exploration into the adaptive mechanisms that enable intelligent behavior in complex and changing environments which includes evolutionary computation, swarm intelligence and fuzzy systems [6]. The concept of evolutionary computation is survival of the fittest: the weak may die while the elite move to the next level [7]. Swarm intelligence is the study of swarms of social organisms such as a flock of birds or a school of fish [8]. Fuzzy logic is a form of either many-valued logic or probabilistic logic; it deals with reasoning that is approximate rather than fixed and exact [9].
Feature-level fusion involves the extraction of representative features from sensor data. These features combine into a single vector as the input to a classification approach based on neural networks, clustering algorithms, and so on [1]. Current studies include the investigation of feature-level fusion using hand and face biometrics [10], feature-level data fusion for bimodal person recognition [11], feature-level data fusion for land mine detection [12], and so forth. Decision-level data fusion involves fusing sensors using preliminary decisions made from individual or multiple sensors and information sources. Examples of decision-level fusion methods include weighted decision methods (voting techniques) [13] and inference methods [14].
This work presents both the investigation and development of data fusion in not only feature-level and also decision-level fusion for a varied range of applications. Feature-level fusion techniques are explored for the skin cancer diagnosis and content-based image retrieval. These techniques include artificial neural network, evolutionary algorithm, particle swarm optimization, adaptive critic design, decision tree and clustering algorithms. Decision-level fusion approaches including fuzzy logic controller, fuzzy intersection/union, and voting algorithm are developed for graphic image type classification.
1.2
SUMMARY OF CONTRIBUTIONSThis dissertation consists of a number of journal papers and conference papers, as presented in the publication list. My unique contributions regarding solving the proposed three aspects are:
Dermoscopy skin lesion discrimination. Basal cell carcinoma (BCC) is the most commonly diagnosed skin cancer in the USA. An automated image analysis and classification method for dermoscopy skin lesion discrimination was developed by applying a novel classifier (Adaptive Critic Design) in the feature-level data fusion. The representative features were first extracted from sensor data according to dermatologist’s suggestion. Those features were then combined into a single vector as the input to Adaptive Critic Design (ACD). ACD is a
biologically-inspired reinforcement learning approach which can combine feature information from multiple sources. ACD gives results superior to those from existing methods such as a backpropagation neural network. This technique can be generally applicable to structure detection that is sensitive to image parameters such as contrast. In addition, it is a useful means for global feature data fusion in order to improve the accuracy of pattern recognition. Furthermore, skin cancer discrimination was enhanced by adding information gathered from the patient and the physician, demonstrating the potential of data fusion in aiding the lesion diagnostic process.
Content-based image retrieval. The detection of medical image artifacts, such as arrows, is important for highlighting both supplemental and context-based information. This information is helpful in improving biomedical information retrieval. Computational intelligence methods, including evolving artificial neural networks (EANNs) and evolving artificial neural networks ensembles (EANNEs), have been investigated in the feature level data fusion for arrow object discrimination. Both EANNs and EANNEs are hybrid artificial intelligence algorithms by combining evolutionary algorithm and particle swarm optimization with artificial neural network. EANNs are evolving into one of the best neural networks available. EANNEs are evolving into neural network ensembles, with the minimum correlation information among the ensembles. Both EANNs and EANNEs outperform the backpropagation NN, indicating the benefit of incorporating multiple neural networks for data fusion. EANNEs outperform EANN, as EANNEs play a better role in fusing the features within a large diversity and variety.
Graphic image type classification. Automatic figure type identification is an important step toward improving both multimodal (text + image) information retrieval and clinical decision support applications. An automated image type classification was developed by applying a data fusion approach to combine information from both text and image sources believed to contain complementary information. First, feature-level fusion techniques were developed for image feature selection in biomedical images for chart classification. These techniques include Particle Swarm Optimization (PSO) and Evolutionary Algorithm (EA) paradigms used for feature selection, with Support Vector Machines (SVM) utilized as the fitness value determination. A hybrid EAPSO algorithm was invented for feature selection by combining the new individual generation functions of both EA and PSO, to attain the global minimum at high speed. Second, a decision-level fusion approach (fuzzy set intersection/union to improve graphic image type classification) was developed. For each biomedical image, both its image features and its caption features were input into artificial neural network classifiers.
The classifiers’ outputs were characterized as fuzzy sets to determine the final classification result. This research demonstrates that data fusion techniques are useful in the feature-level data fusion to remove the negative related or unrelated features, while data fusion techniques are useful in the decision level data fusion to combine the resource information.
PAPER
I. ANALYSIS OF CLINICAL AND DERMOSCOPIC FEATURES FOR BASAL
CELL CARCINOMA NEURAL NETWORK
Beibei Chenga, R. Joe Stanleya, William V, Stoeckerb, Sherea M. Stricklinb, Kristen A. Hintonb, Thanh K. Nguyena, Ryan K. Raderb,Harold S. Rabinovitzc , Margaret Olivieroc , Randy H.
Mossa
a
Department of Electrical and Computer Engineering, Missouri University of Science and Technology (S&T), Rolla, MO, 65409, USA
b
Stoecker & Associates, Rolla MO, 65401, USA
c
Skin and Cancer Associates, Plantation, FL, USA
ABSTRACT
Background: Basal cell carcinoma (BCC) is the most commonly diagnosed cancer in the USA. In this research, we examine four different feature categories used for diagnostic decisions, including patient personal profile (patient age, gender, etc.), general exam (lesion size and location), common dermoscopic (blue-gray ovoids, leaf-structure dirt trails, etc.), and specific dermoscopic lesion (white/pink areas, semitranslucency, etc.). Specific dermoscopic features are more restricted versions of the common dermoscopic features.
Methods: Combinations of the four feature categories are analyzed over a data set of 700 lesions, with 350 BCCs and 350 benign lesions, for lesion discrimination using neural network-based techniques, including evolving artificial neural networks (EANNs) and evolving artificial neural network ensembles.
Results: Experiment re sults based on 10-fold cross validation for training and testing the different neural network-based techniques yielded an area under the receiver operating characteristic curve as high as 0.981 when all features were combined. The common dermoscopic lesion features generally yielded higher discrimination results than other individual feature categories.
Conclusions: Experimental results show that combining clinical and image information provides enhanced lesion discrimination capability over either information source separately. This research highlights the potential of data fusion as a model for the diagnostic process.
1. INTRODUCTION
Basal cell carcinoma (BCC), characterized as a slow-growing skin malignancy originating within the basal layer of the epidermis, is the most commonly diagnosed cancer with an estimated 3 million new cases annually in the USA [1]. In the consultation process when a patient exhibits a skin lesion, physicians gather patient information, determine general information about the skin lesion, and may use devices such as a dermatoscope (3Gen LLC, San Juan Capistrano, CA, USA; Heine Optotechnik, Herrsching, Germany) for determining a preliminary diagnosis. Currently, dermatopathology examination of a biopsy is used as the diagnostic gold standard.
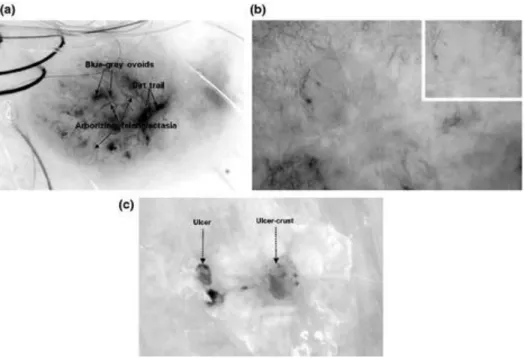
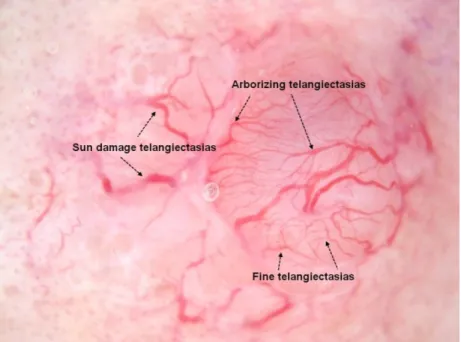
In this research, the diagnostic process, here characterized as BCC versus benign lesion discrimination is examined based on information gathered from the patient, physician, and the dermoscopic image of the lesion. There are several BCC structures identifiable using dermoscopy that strongly suggests a BCC diagnosis. These have been incorporated into the BASAL acronym: Blue-gray ovoids and globules, Arborizing telangiectasia, Semitranslucency/Spoke wheel structures, Atraumatic ulcerations, and Leaf-like structures/dirt-trails [2]. Figure 1(a)–(c) presents dermoscopic lesion image examples of these structures.
While there have been numerous studies based on dermoscopic image feature analysis for pigmented lesion discrimination, few studies have specifically addressed BCC versus benign lesion discrimination by a classifier [3-6]. In those studies, BCC lesion discrimination was focused on the detection and analysis of particular dermoscopic features, including telangiectasia [3, 4], leaf-dirt trails [5], and semitranslucency [6]. This research explores the efficacy of fusing clinical and dermoscopic features to enhance skin lesion discrimination capability. Four categories of features were investigated in this research for BCC discrimination: (i) patient personal profile descriptors, (ii) general exam descriptors, (iii) common dermoscopic skin lesion image features associated with BCC, and (iv) specific dermoscopic skin lesion image features used for detecting uncommon BCC presentations. Combinations of these feature categories are examined for skin lesion discrimination using neural network techniques, including standard backpropagation neural networks, evolving artificial neural networks (EANNs), and EANN ensembles (EANNEs).
Figure 1. Examples of BCC BASAL structures visible using dermoscopy. All images are contact dermoscopy images except b. (a) Blue-gray ovoids, Arborizing telangiectasia, and dirt trails (rudimentary Leaf-like structures), (b) Semitranslucency, non-contact dermoscopy (inset-contact
dermoscopy), and (c) Atraumatic ulceration, with similar ulcer-crust.
The remainder of the paper is presented in the following sections: 1. Description of feature categories
2. Discrimination algorithms 3. Experimental procedure 4. Results and discussion 5. Conclusion.
2. DESCRIPTION OF FEATURE CATEGORIES
Table 1 provides an overview of the four overall feature groups. The personal profile descriptors used are patient age, gender, race/ethnicity, and geographic location. Age was given in a binary format for either older than or younger than (and including) 50 years of age. Race/ethnicity is quantized as either non-Hispanic or Hispanic. The geographic location is based on clinic location, either above (Missouri, Connecticut) or below (Florida) the Tropic of Cancer. The final general exam attribute was lesion location. The third category of features are basic and common BCC dermoscopic descriptors BASAL features including blue-gray ovoids, vessels, pink veil (a more general form of semitranslucency), atraumatic ulcerations, and leaf-dirt trails. The fourth category of features comprises more specific dermoscopic features found to be present in this set of 350 BCCs. For both the common and specific dermoscopic features, a dermatologist (W.V.S.) identified the presence or absence of each feature within the lesion. Two of these specific features have been previously described and have high specificity: arborizing telangiectasia and semitranslucency [2, 7]. We have determined in this research other features with high specificity found in BCC that have not been previously described. These features are developed here to detect unusual BCC presentations such as white areas, pink areas, purple blotches, pale areas, large (majority of lesion) ulcer/crust plus pink regions, and majority white and pink regions. The common and specific dermoscopic features in each feature group are shown in Table 1.
The experimental data examined to evaluate the discrimination capability of the different feature categories includes images acquired from four clinic locations across the USA: The Dermatology Center (Rolla, MO, USA), Drugge & Sheard (Stamford, CT, USA), Skin & Cancer Associates (Plantation, FL, USA) and Columbia Dermatology & Mohs Skin Cancer Surgery. (Columbia, MO, USA). Three hundred and fifty lesions with a BCC diagnosis and 350 benign lesions were used as the test set. Benign lesions consisting of 80 acquired nevi, 71 seborrheic keratoses, 60 actinic keratoses, 51 lentigines, 15 congenital nevi, 10 lichen planus-like keratoses, 9 sebaceous hyperplasia, and 54 lesions of miscellaneous types constituted the competitive set.
Table 1. Overview of feature groups examined for lesion discrimination. Patient Personal
profile descriptors
General exam descriptors
Common BCC features Specific BCC features
Age Size Blue-gray ovoids Arborizing telangiectasia
Gender Lesion
Location
Pink veil White/pink areas
Race/Ethnicity N/A Vessels Semitranslucency
Geographic Location
N/A Leaf-Dirt Trails Purple Blotches
N/A N/A Atraumatic ulcerations Pale Areas
N/A N/A N/A Majority of Lesion
N/A N/A N/A Ulcer/Crust plus Pink
Regions
N/A N/A N/A Majority Pink/White
Regions
Table 2 presents the different feature group combinations examined for BCC versus benign lesion discrimination based on the four feature categories. Column 1 gives the feature combination, Column 2 provides the feature categories included in the feature combination, Column 3 lists the total number of features for the feature combination, and Column 4 gives the multilayer perceptrons neural network architecture used for lesion discrimination for the different feature combinations.
Table 2. Feature combinations for lesion discrimination. Feature
Combination
Feature Groups Included Total
Number of Features
Neural Network Architecture
1 Personal profile descriptors 4 5x5x1
2 General exam descriptors 2 3x5x1
3 Common lesion features 5 6x5x1
4 Specific lesion features 6 7x5x1
5 Personal profile descriptors, general exam descriptors
6 7x5x1
6 Personal profile descriptors, common lesion features
9 10x5x1
7 Personal profile descriptors, specific lesion features
10 11x5x1
8 General exam descriptors, common lesion features
7 8x5x1
9 General exam descriptors, specific lesion features
8 9x5x1
10 Common lesion features, specific lesion features
11 12x5x1
11 Personal profile descriptors, general exam descriptors, common lesion features
11 12x5x1
12 Personal profile descriptors, general exam descriptors, specific lesion features
12 13x5x1
13 Personal profile descriptors, common lesion features, specific lesion features
15 16x5x1
14 General exam descriptors, common lesion features, specific lesion features
13 14x5x1
15 Personal profile descriptors, general exam descriptors, common lesion features, specific lesion features
3. DISCRIMINATION ALGORITHMS
Using the different combinations of feature categories given in Table 2, EANN's and EANNE's are examined for BCC versus benign lesion discrimination. The implementation for each algorithm is given in this section.
3.1 EVOLVING ARTIFICIAL NEURAL NETWORKS (EANN’s)
EANN's refer to a class of artificial neural networks (ANN's) in which both evolution and learning are fundamental forms of adaption. Evolutionary algorithms (EAs) can be used to train the connection weight, design the architecture, and select the input features of the ANN's. In this research, EAs using particle swarm optimization (PSO) [8] and genetic algorithm (GA) [9] for neural network training are investigated.
PSO is the study of swarms of social organisms such as a flock of birds, in which each particle in the swarm moves toward its previous best location (Pbest) and global best location (Gbest) at each time step [8]. The PSO algorithm utilized in this study is presented in detail in [10] and is overviewed as follows. We initialize M particles, where each particle is a D-dimensional vector with each element of the vector representing a connection weight and D being the total number of weights. For example, feature combination 1 from Table 2 has an architecture of 5 × 5 × 1. The total number of weights (D) is 11 (5 + 5 + 1) and each element in this D-dimensional vector is the connection weight. Furthermore, the M particles represent M
ANNs.
The connection weights in each ANN are updated when the elements in each particle are trained as follows. The initial value for each element of the vector is randomly set at a value from –0.1 to 0.1. In each training time step, the element's value of each particle is updated toward Pbest and Gbest. Pbest is the particle of the M particles that gives the least root mean square error (RMSE) between the current training epoch and the previous training epoch. Gbest is the particle among the M particles which generates the minimum RMSE, where the RMSE is calculated based on the difference between the ground truth and the actual ANN's output. The details for the updating process are given in [8]. The same process is repeated for N epochs. The final Gbest particle is selected for the final ANN weights for the test vector.
GAs use the “survival of the fittest” concept where the weak may die and elites are able to progress to the next level [9]. The GA approach investigated here is presented in detail in [10]. We initialize M parents, where each parent is a D-dimensional vector with each element of the vector representing a connection weight, with D being the total number of weights. In a
similar fashion defined for the PSO configuration, M parents represent M ANNs. The initial value for each element of the vector is randomly set from –0.1 to 0.1. In each training step, these
M parents generate M offspring after implementing random selection, uniform crossover and a mutation operation. Then, the next M parents are selected based on whether the parents or their offspring minimize the RMSE. The same process is repeated for N epochs. From the final parent pool, the parent which minimizes the RMSE is selected for the final ANN weights for the test vectors.
3.2 EVOLVING ARTIFICIAL NEURAL NETWORK ENSEMBLES (EANNE’s)
Neural network ensembles provide an approach for using and combining the outputs from several networks, with each ANN having the same inputs and generating its own outputs [11]. The purpose of EANNs is to make use of the whole population of ANNs rather than a single one. Training the network ensembles and determining the final output from the network ensembles are two main components for EANNEs design.
Negative correlation learning [12, 13] is implemented to train neural network ensembles in order to minimize the mutual informal among the networks. We initialize an ensemble with M
ANNs with the initial weights in each ANN randomly set to a value from –0.1 to 0.1. In each training time step, each ANN in the ensemble is trained for a certain number of epochs using negative correlation learning firstly. Then, M offspring ANNs will be created by using selection, crossover, and a mutation operation in GA and replacement of the worst ANNs. The same process is repeated for N times.
For the final output determination, there are several criteria such as averaging, winner-taking-all and voting for combining the outputs. Here we simply choose averaging to deliver the final output as shown in Eq. (1).
∑ (1)
4. EXPERIMENTS PROCEDURE
Fifteen different feature combinations were investigated as inputs to the neural network architectures. The feature combinations and the neural network architectures for the EANN approach trained using the GA algorithm, the EANN approach trained using the PSO algorithm, the EANNE approach, and standard backpropagation ANN are given in Table 2. Each neural network architecture includes the total number of features for the feature combination and one bias as the inputs to each classifier algorithm. Each neural network architecture from Table 2 includes five nodes in a hidden layer and one node in the output layer. The input and output layers use linear transfer functions, and the hidden layer utilizes sigmoid transfer functions. A 10-fold cross validation methodology is used for generating training/test sets for each neural network's architecture [13]. The same training/test sets from the cross-validation process are applied to all feature combinations and classification algorithms presented. The 10-fold cross validation process is repeated five times for each feature combination. Classification results are based on averaging the area under receiver operating characteristic (ROC) curves [14] generated for each of the 10-test sets over the five separate 10-fold cross validation sets. The area under the ROC curve was utilized as the classification measure in this research because the area under the ROC curve does not require selecting a decision boundary or threshold to determine detection accuracy.
5. RESULTS AND DISCUSSIONS
Table 3 presents the average area under the ROC curve results over the five sets of 10-fold cross validation test sets for the different feature combinations and discrimination algorithms examined. BP denotes the standard backpropagation ANN algorithm. EANN-GA and EANN-PSO represent the EANN neural network approaches using the GA and PSO methods for neural network training, respectively.
Table 3. Average area under the ROC curve discrimination results for different feature and discrimination algorithm combinations.
Feature Combination Discrimination Algorithm
BP EANNE EANN-GA EANN-PSO
1 0.612 0.613 0.604 0.607 2 0.670 0.704 0.739 0.746 3 0.667 0.823 0.812 0.818 4 0.841 0.774 0.799 0.712 5 0.632 0.794 0.815 0.837 6 0.830 0.924 0.909 0.928 7 0.809 0.890 0.879 0.894 8 0.822 0.927 0.928 0.941 9 0.830 0.909 0.910 0.941 10 0.710 0.853 0.888 0.937 11 0.828 0.934 0.918 0.950 12 0.842 0.913 0.901 0.942 13 0.890 0.970 0.946 0.974 14 0.904 0.973 0.954 0.977 15 0.897 0.972 0.948 0.981
Several conclusions can be obtained from Table 3. First, the EANN algorithm using PSO neural network training typically yielded the highest overall area under the ROC curve results from the four discrimination algorithms investigated. Second, using all features (Feature
combination 15) gave the highest overall discrimination results, with an area under the ROC curve of 0.981 for the EANN-PSO approach. Feature combinations 13–15 yielded comparable results for the EANNE, EANN-GA, and EANN-PSO classification methods, with Feature combination 14 (general exam descriptors, common dermoscopic lesion features, and specific dermoscopic lesion features) providing slightly higher results than using all features (Feature combination 15). This is not a surprising result since the personal profile descriptors (Feature combination 1) yielded the overall lowest BCC discrimination results compared to the other individual feature groups. Third, inspecting the individual feature categories, the common dermoscopic lesion features yielded higher discrimination results than the other feature categories, except for the standard back propagation method. The personal profile descriptors gave consistently lower discrimination results than the other feature categories. Size and location information (general exam descriptors) and specific dermoscopic lesion features gave more discerning discrimination information than personal profile descriptors for all classification algorithms examined.
6. CONCLUSIONS
In this research, BCC versus benign lesion discrimination was explored using four types of clinical and dermoscopic lesion image features: patient personal profile, general exam, common dermoscopic image features associated with BCC, and specific dermoscopic image features with uncommon BCC presentations. Lesion discrimination was performed for different combinations of these features using EANNs and EANNEs architectures. Experiment results showed an area under the ROC curve as high as 0.981 when all features were combined. Common dermoscopic lesions features generally gave higher discrimination results than other individual feature categories. Overall, experimental results highlight that combining clinical and image information enhances lesion discrimination capability over either information source separately, demonstrating the potential of data fusion in aiding the lesion diagnostic process.
ACKNOWLEDGEMENTS
This publication was made possible by Grant Number SBIR R43 CA153927-01 of the National Institutes of Health (NIH). Its contents are solely the responsibility of the authors and do not necessarily represent the official views of the NIH.
REFERENCES
1. Rogers HW, Weinstock MA, Harris AR, Hinckley MR, Feldman SR, Fleischer AB, Coldiron BM. “Incidence estimate of nonmelanoma skin cancer in the United States”. Arch Dermatol 2010, 146, pp.283–287.
2. Stoecker WV, Stolz W. “Dermoscopy and the diagnostic challenge of amelanotic and hypomelanotic melanoma”. Arch Dermatol, 2008,144, pp. 1120–1127.
3. Cheng B, Erdos D, Stanley RJ, Stoecker WV, Calcara D, Gomez D. “Automatic detection of basal cell carcinoma using telangiectasia analysis in dermoscopy skin lesion images”. Skin Res Technol 2011, 17, pp.278.
4. Cheng B, Stanley RJ, Stoecker WV, Hinton K. “Automatic telangiectasia analysis in dermoscopy images using adaptive critic design”. Skin Res Technol, 2011, pp.1–8. 5. Cheng B, Stanley RJ, Stoecker WV, Osterwise CTP, Stricklin SM, Hinton KA, Moss RH,
Oliviero M, Rabinovitz HS. “Automatic dirt trail analysis in dermoscopy images”. Skin Res Technol, Jan 2012.
6. Stoecker WV, Gupta K, Shrestha B et al. “Detection of basal cell carcinoma using color and histogram measures of semitranslucent areas”. Skin Res Technol, 2009,15, pp.283– 287.
7. Menzies SW, Altamura D, Menzies SW et al. “Dermatoscopy of basal cell carcinoma: morphologic variability of global and local features and accuracy of diagnosis”. J Am Acad Dermatol,2010,62, pp.67–75.
8. Kennedy J, Eberhart R. “Particle swarm optimization”. Proceedings of the IEEE International Conference on Neural Networks, Piscataway, NJ, 1995, pp. 1942-1948. 9. Holland JH. “Adaptation in Natural and Artificial Systems”, University of Michigan
Press, Ann Arbor, 1975.
10. Cheng B, Stanley RJ, De S, Antani S, Thoma GR. “Automatic detection of arrow annotation overlays in biomedical images”. Int J Healthcare Inform Syst Informatics. 2011, 6, pp.23–41.
11. Yao X, Islam MM. “Evolving artificial neural network ensembles”. Computational Intelligence Magazine, 2008, 3(1), pp.31-42.
12. Liu L, Yao X. “Negatively correlated neural networks can produce best ensembles”, Aust. J. Intell. Inf. Proc. Syst., 1998, 4(3), pp.176–185.
13. Kohavi R. “A study of cross-validation and bootstrap for accuracy estimation and model selection”, Proceedings of the Fourteenth International Joint Conference on Artificial Intelligence, 1995, 14, pp. 1137–1143.
14. Fogarty J, Baker RS, and Hudson SE. “Case studies in the use of ROC curve analysis for sensor-based estimates in human computer interaction”. Proceedings of Graphics interface, Canadian Human-Computer Communications Society, School of Computer Science, University of Waterloo, Waterloo, Ontario Victoria, British Columbia, 2005, 112, pp. 129-136.
II. AUTOMATIC DIRT TRAIL ANALYSIS IN DERMOSCOPY IMAGES
Beibei Chenga, R. Joe Stanleya, William V, Stoeckerb, Christopher T.P. Osterwisea, Sherea M. Stricklinb, Kristen A. Hintonb, Randy H. Mossa, Margaret Olivieroc, Harold S. Rabinovitzc
a
Department of Electrical and Computer Engineering, Missouri University of Science and Technology (S&T), Rolla, MO, 65409, USA
\b
Stoecker & Associates, Rolla MO, 65401, USA
c
Skin and Cancer Associates, Plantation, FL, USA
ABSTRACT
Background: Basal cell carcinoma (BCC) is the most common cancer in the US. Dermatoscopes are devices used by physicians to facilitate the early detection of these cancers based on the identification of skin lesion structures often specific to BCCs. One new lesion structure, referred to as dirt trails, has the appearance of dark gray, brown or black dots and clods of varying sizes distributed in elongated clusters with indistinct borders, often appearing as curvilinear trails.
Methods: In this research, we explore a dirt trail detection and analysis algorithm for extracting, measuring, and characterizing dirt trails based on size, distribution, and color in dermoscopic skin lesion images. These dirt trails are then used to automatically discriminate BCC from benign skin lesions.
Results: For an experimental data set of 35 BCC images with dirt trails and 79 benign lesion images, a neural network-based classifier achieved a 0.902 area under a receiver operating characteristic curve using a leave-one-out approach.
Conclusion: Results obtained from this study show that automatic detection of dirt trails in dermoscopic images of BCC is feasible. This is important because of the large number of these skin cancers seen every year and the challenge of discovering these earlier with instrumentation. Key words: basal cell carcinoma – image analysis – dirt trails –neural network – dermoscopy
1. INTRODUCTION
Basal cell carcinoma (BCC), a slowly growing skin malignancy, is the most common cancer, with an estimate of 3 million new cases annually in the US [1]. To allow early detection of these skin cancers, physicians employ a device called a dermatoscope (3Gen LLC, San Juan Capistrano, CA; Heine Optotechnik, Herrsching, Germany). Classic basal cell carcinoma structures, visible and measurable with the dermatoscope, have been summarized by the BASAL acronym: Blue-gray ovoids and globules, Arborizing telangiectasia, Semitranslucency / Spoke wheel structures, Atraumatic ulcerations, and Leaf-like structures [2]. One newly described feature is brown to black dots/globules, which were found in 132 cases (21.7%) of a series of 609 basal cell carcinomas [3]. The distribution of these tiny pigmented structures has not been previously characterized. In one series of 351 basal cell carcinomas in a previous study, we found 46 cases (13.1%) of 351 BCCs to have the appearance of dark gray, brown or black dots and clods of varying sizes distributed in elongated clusters with indistinct borders, often appearing as curvilinear trails. These clustered objects may be characterized as dirt trails. Figure 1 gives two examples of dirt trails present in dermoscopy skin lesion images. In this research, we explore a dirt trail detection and analysis algorithm for extracting, measuring, and characterizing dirt trails based on size, distribution, and color in dermoscopic skin lesion images. These dirt trails are then used to automatically discriminate basal cell carcinoma from benign skin lesions. The following sections of the paper include: II. Methodology, III. Experimental Results, IV. Conclusion, and References.
Figure 1. Dirt trail examples in dermoscopic skin lesion images, shown by arrows, with dirt trails containing dots and clods of varying sizes.
2. METHODOLOGY
2.1 DATA SET DESCRIPTION
The image set used for this study includes contact, non-polarized dermoscopic images of 35 basal cell carcinomas (BCCs) with dirt trail areas and 79 non-BCC benign lesions collected from two clinics: The Dermatology Center, Rolla, Missouri; and Skin and Cancer Associates, Plantation, Florida. All lesions with any dermoscopy features of malignancy and any benign lesions for which there was any uncertainty were biopsied. All images were contact, non-polarized dermoscopy images taken with a Sony DSC-W70 7.2 megapixel digital camera with a 3Gen DermLite Fluid dermoscopy attachment (3Gen LLC, San Juan Capistrano, CA). The 79-image competitive set to which the BCC set was compared consisted of a variety of lesions encountered in the clinic during the same period in which the BCC images were acquired, included 38 actinic keratoses (pre-cancers), 15 acquired nevocellular nevi (benign moles), 9 cases of sebaceous hyperplasia, and 15 cases of other benign diagnoses.
2.2 DIRT TRAIL DETECTION ALGORITHM OVERVIEW
An overview of the dirt trail detection algorithm is given in Figure 2. First, for the dermoscopy image data set, the individual red, green and blue (R, G, B) color planes were used for skin lesion analysis. Next, a Gaussian bandpass filter was applied to each color plane. To find the small dirt trail dots and clods, the bandpass-filtered image was next subtracted from each 3x3 median-filtered image. A scalarized Otsu threshold was then applied, followed by hair and bubble noise filtering. Features were determined for the resultant objects remaining in the mask. A backpropagation neural network using a leave-one-out method was applied to these features to determine presence or absence of dirt trails. The dirt trail detection algorithm, feature extraction and lesion discrimination are presented in detail in sections II.3 and II.4, respectively.
3. DIRT TRAIL DETECTION ALGORITHM
3.1 GAUSSIAN BANDPASS FILTER
The first step in the dirt trail detection algorithm is to obtain the individual R, G, and B
color planes for the skin lesion image (Figure 3). The second step is to apply Gaussian bandpass filtering to the individual color planes. A Gaussian lowpass filter, denoted as H, defined for each pixel position (u,v) is constructed and is given in Eqs. 1 and 2[4]:
( ) [( ) ( ) ] (1) ( )
( )
(2)
where M and N represent the width and height of the image and (M/2, N/2) is the center of the frequency rectangle. H(u,v) is the resulting lowpass filtered image based on the value for . Two different Gaussian lowpass filters were determined empirically to find dirt trail objects by setting to be 40 and 100. The difference between these lowpass filters, denoted as W(u,v), represents the bandpass filter, as given in Eq. (3):
( ) ( ) ( ) ( )
( ) (3)
Figure 4 shows the representation for the bandpass filter W. W is applied to the spatial frequency domain representation from the discrete Fourier transform for each of the color plane images for the skin lesion (see Figure 3). The Gaussian filtered images for the R, G, and B
planes are determined based on the frequency domain and converted to the spatial domain. The resulting bandpass images for the R, G, and B planes are denoted as , , and respectively. Figure 5 presents examples of the bandpass filter process for each color plane, with the original color plane image on the left side and the filtered image on the right side.
Image (BCC with dirt trails
or benign)
Compute Gaussian bandpass and median
filter images of R,G,B planes
Subtract Gaussian filter from median image of R,G,B
planes
AND thresholded R,G,B difference
images
Filter hair and bubble noise Compute object
size, distribution and color features BCC/benign lesion
discrimination
Figure 2. Overview of the dirt trail detection algorithm.
(a) (b) (c)
Figure 3. RGB plane. (a) Red plane. (b) Green plane. (c) Blue plane.
(a)
(b)
(c)
Figure 5. Bandpass-filtered images converted to spatial domain for R, G, and B planes. (a) Red plane. (b) Green plane. (c) Blue plane. The original color plane images are on the left, and the
filtered images , , and are on the right.
3.2 MEDIAN FILTER
Since the dirt trail resembles small salt-and-pepper noise, a 3x3 median filter is applied to each original color plane image, with median filter results shown in Figure 6 for the individual color plane images from Figure 3. Let , , and denote the median-filtered images for the R, G, and B color planes, respectively.
(a) (b)
(c)
Figure 6. Median filter output images from R, G, B planes. (a) FR, (b) FG, (c) FB.
3.3 IMAGE SUBTRACTION
The small dirt trail objects are found by computing the difference between the bandpass filtered image and the median filtered image for each color plane. Let , , and represent the difference images for the R, G, and B color planes, respectively, with ,
and are similarly defined. This corresponds to subtracting the corresponding color plane images, Figure 5, from the median filtered images, Figure 6.
3.4 HISTOGRAM PROCESSING
Using the difference images , , and for the pixels inside lesion border, the Otsu’s method is implemented for these pixels to find the histogram threshold [5], with the threshold multiplied by a scalar of 2, determined empirically from the experimental data set, in order to increase the sensitivity of dirt trail detection. Let , , and denote the threshold images for the R, G, and B color planes, respectively. These are shown in Figure 7.
(a) (b) (c) Figure 7. Output images from scalarized Otsu’s method for R, G, B planes.
(a) , (b) , (c) .
3.5 LOGIC OPERATION
In order to extract dirt trail-like objects, the threshold images for the different color planes are merged using a logical AND operation, as given in equation 4 and denoted as A. Figure 8 gives an AND image example for the threshold images from Figure 7.
(4)
Figure 8. Otsu’s output image A after logical AND of the threshold color plane images.
3.6 NOISE FILTERING FOR HAIRS AND BUBBLES
The logical AND of the threshold images provides an initial mask for dirt trail-like objects. A mathematical morphological-based approach was applied in order to filter hairs and bubbles commonly observed in dermoscopy skin lesion images [6]. Let B represent the resulting hair and bubble objects detected from A. Then, the resultant mask is given by
3.7 NOISE FILTERING FOR ISOLATED NOISE
A secondary noise filter was applied to R in order to remove isolated objects I. This step was motivated by the fact that dirt trails consist of a cluster of objects (black dots and clods). Each object in R was given a blob label. All objects within an empirically determined radius of 300 pixels of the object’s centroid were counted. If the number of objects within this radius was less than 10, the isolated noise object I was removed from R, to create the final dirt trail mask . Let K represent the final dirt trail mask after performing the clustering operation. An example image is given in Figure 9, with overlays on the original color image in (a) showing the mask R after hair and bubble removal and (b) the dirt trail mask K after hair and bubble and isolated object removal.
(a) (b)
Figure 9. Image overlay. (a) Image overlay R, after hair and bubble removal. (b) Dirt trail image overlay K after isolated object removal.
4. CLASSIFIER INPUT FEATURES AND CLASSIFIER METHODOLOGY
4.1 FEATURES COMPUTED FOR LESION DISCRIMINATION
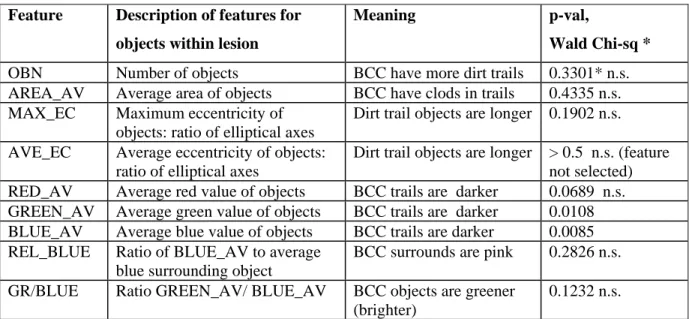
Using the final dirt trail mask K from the previous section and the RGB skin lesion image, nine features were calculated from each dirt trail mask for each image for lesion discrimination, as shown in Table 1. These nine features were selected from known dirt trail features—they are dark elongated areas within a relatively bright, pink area of the BCC.
Table 1. Descriptions for Dirt Trail Dermoscopic Features Feature Description of features for
objects within lesion
Meaning p-val,
Wald Chi-sq *
OBN Number of objects BCC have more dirt trails 0.3301* n.s.
AREA_AV Average area of objects BCC have clods in trails 0.4335 n.s. MAX_EC Maximum eccentricity of
objects: ratio of elliptical axes
Dirt trail objects are longer 0.1902 n.s. AVE_EC Average eccentricity of objects:
ratio of elliptical axes
Dirt trail objects are longer > 0.5 n.s. (feature not selected) RED_AV Average red value of objects BCC trails are darker 0.0689 n.s. GREEN_AV Average green value of objects BCC trails are darker 0.0108 BLUE_AV Average blue value of objects BCC trails are darker 0.0085 REL_BLUE Ratio of BLUE_AV to average
blue surrounding object
BCC surrounds are pink 0.2826 n.s. GR/BLUE Ratio GREEN_AV/ BLUE_AV BCC objects are greener
(brighter)
0.1232 n.s. *p-values from SAS model for all variables in logistic regression model with p < 0.5, maximum likelihood estimate, Wald Chi-sq.
4.2 CLASSIFIER DESCRIPTION
The dirt trail detection algorithm and lesion features presented in the previous section were examined for BCC versus benign lesion discrimination in the data set of 35 BCC images with dirt trails and 79 benign lesion images described above. BCC versus benign skin lesion discrimination was done based on a standard backpropagation neural network classifier. For the neural network classifier, an architecture of 11x5x1 was used: 10 features and a bias for the input layer, 5 nodes in a hidden layer, and one output was employed. Linear transfer functions were used for the input and output layers, and sigmoid transfer functions were utilized in the
hidden layer. A leave-one-out methodology was used for training and testing the neural network with each network being trained for a maximum of 200 epochs (on-line weight updating) or RMSE < 0.001. Discrimination results were generated and examined using a receiver operating characteristic (ROC) curve, varying the neural network threshold and computing the sensitivity vs. 1-specificity (true positive and false negative rates) at each threshold value.