Volume 3, No. 3, May-June 2012
International Journal of Advanced Research in Computer Science
RESEARCH PAPER
Available Online at www.ijarcs.info
ISSN No. 0976-5697
Spatial Outlier Detection for Mobility Profile Mining
Shafqat Ali Shad*
Laboratory of Semantic Computing and Data Mining, Department of Computer Science and Technology, University of Science and Technology of China, Huangshan
Road, Hefei, 230027 Anhui, CHINA [email protected]
Enhong Chen
Laboratory of Semantic Computing and Data Mining, Department of Computer Science and Technology, University of Science and Technology of China, Huangshan
Road, Hefei, 230027 Anhui, CHINA [email protected]
Abstract: With the rigorous growth of cellular network many mobility datasets are available publically, which attracted researchers to study human mobility fall under spatio-temporal phenomenon. Mobility profile mining is main task in spatio-temporal trend analysis which can be extracted from the location information available in the dataset. The location information is usually gathered through the GPS, service provider assisted faux GPS and Cell Global Identity (CGI). Because of high power consumption and extra resource installation requirement in GPS related methods, Cell Global Identity is most inexpensive method and readily available solution for location information. CGI location information is four set head i.e. Mobile country code (MCC), Mobile network code (MNC), Location area code (LAC) and Cell ID, location information is retrieved in form of longitude and latitude coordinates through any of publically available Cell Id databases e.g. Google location API using CGI. However due to of fast growth in GSM network, change in topology by the GSM service provider and technology shift toward 3G exact spatial extraction is somehow a problem in it, so location extraction must dealt with spatial outlier’s problem first for mobility building. In this paper we adopt a methodology for the detection of spatial outliers from GSM CGI data, the LAC-clustering, which is a variant of ahierarchical clustering, based and used the basic GSM network architecture properties.
Keywords: Mobility data mining, Spatial outlier detection, Spatial information retrieval, Spatial clustering.
I. INTRODUCTION
As mobility based applications and communication systems are mobility profile based, where user’s mobility is first studied for the extraction of different trends according to the nature of application like route prediction [1], early warning systems [2], advertisement [3, 4] and social networking [5]. All of the mentioned work needs Mobility profile mining as a main task, so it is trivial to find out the significant locations from user mobility history. Precise extraction of significant places need exact coordinate mapping and dwell time calculation, so extraction of exact coordinates which are spatial outliers free is basic task in any of spatio-temporal natured applications.
The location binding methods are broadly divided into two categories i.e. Active badge [6] which is indoor like Bluetooth, RFID, Infrared and Active bat [7] which is outdoor like GPS, GSM . As indoor methods are limited in nature because of their signal limitations so outdoor methods are mostly used for mobility study. While in case of outdoor methods GPS is less encouraging due to of its high power consumption so only widely used methodology is GSM. GSM retain the location information in four head set i.e. Mobile country code (MCC) assigned to every country, Mobile network code (MNC) assigned to every operator , Location area code (LAC) created by operator for identification of Cells, Cell ID which is given by the Cell to each user connected. So MCC, MNC, LAC, Cell Id provide the unique set of identification for location extraction of any user at particular time span.
CGI provides approximate location information in the form of latitude and longitude using any of publically
available Cell Id databases. But due to of fast growth in the GSM network and technology shift extraction of this information is trivial task, which is likely to be addressed in detail. Due to of change in GSM network topology , introduction of new cells in GSM network, reuse/relabeling of GSM cells, transformation to 3G network, mobility data and Cell id database are not synchronized properly over same set of information, which lead to introduction of spatial outliers during mobility building.
The stated problem is source of outliers in data which is required to be solved, so our work in this paper is focused on spatial outlier removal. Beside this we also studied the detailed location information extraction from CGI header using publically available cell id database, as we are using the MIT reality mining dataset [8] where CGI header has only LAC and Cell ID information.
II. RELATEDWORK
With the immense growth of GSM network many potential applications are developed over a short span of time. Like social networking and human mobility behavior [9, 10, 11] is studied through finding the socially important places from user mobility profiling for determining social relationships between different users. While opportunity based message forwarding projects [12, 13, 14, 15] are based on location marking through user mobility history building. While location prediction and finding is also used in traffic control system [16] thorough usage of camera and mobile phones for location data acquisition.
models, where synthetic model is more commonly used because of public data availability. While user next visit prediction is proposed through user mobility history by Akyildiz et al., [18] and Cayirci et al., [19] using the direction of motion, speed, current. Zanoozi et al., [20] used the cell residence time optimization on through the human mobility analysis while Li et al., [21] introduced the Kalman filter over Markov model for the next location prediction using cell handover residence. Gonzalez et al., [22] used the significance parameter for identification of significant locations and its use in mobile user pattern analysis. Nurmi et al., [23] proposed the graph based prediction approach for spatial-temporal analysis thorough identification of significant locations.
The above mentioned work is mainly focused on the mobility analysis where less emphasis is made on the data pre-processing or spatial outlier is neglected completely. In our presented work we adopt the methodology published in [24] for detection and removal of spatial outlier from data for accurate mobility building from user data. This methodology uses the basic GSM network features and clustering technique for spatial outlier detection and removal.
III. METHODOLOGY
Before going into detail methodology it is necessary to understand the basic GSM architecture so that we can resolve the problem on the logical grounds.
A. GSM Network:
The basic identity of location in GSM network is CGI, where CGI consists of MCC, MNC, LAC and Cell-id. And on the network architecture side Base Transceiver Station (BTS) is the basic unit of GSM network, where each BTS describes its own cell which is meant to allocate multiple Cell IDs within one cell. As shown in Figure 1. Mobile Station (MS) is connected with the Base Transceiver Station (BTS), where BTS is connected with Base Station Controller (BSC) and Mobile Services Switching Center (MSC). The MSC made link between different MSCs and BSCs to provide communication channel between two MS registered to two different cells.
Being the basic unit BTS decided about the number of cells equal in each region. While BTS connected to the same MSC over BSC share the same LAC.
One or more MSCs together define a region identified by unique number called Location Area Code (LAC, result in the polygonal shape of GSM network. Where network topology is defined by the network operator depends on the capacity of equipment and user density as per region.
Figure: 1 Basic functional architecture of GSM network.
As in rural area this density is low so the area covered by the location Area is much broader than that of urban area where density is higher so multiple Location areas are required to be defined by operator. The polygonal shape of the GSM cells is shown in Figure 2.
Figure: 2 Hexagonal cells of GSM network.
B. Removal of Spatial Outliers:
Due to of rapid growth in GSM network many of the cells are reused and due to of its spatial nature, data collected can have spatial outlier hence result in to irregular Mobility profile mining. For identification and removal of these spatial outliers we use a spatial clustering technique called LAC-clustering [24] because of high density of data, it is different from the non-spatial data so we can not apply typical clustering techniques on it. While we used its basic spatial data properties i.e. distance parameter for determining the relative distance between data points [24]. As many of the clustering algorithm defined for spatial outlier detection [25] but they need shape analysis and full detail of network topology, which is most of time hidden from the user because of security reasons. While in our case the dense data is dense so distance is obvious choice for similarity measure[26] as it is recommended to use Euclidean distance for similarity measure when data is dense and spatial in nature. As previous work involved additional determination parameters like time of stay, position change, signal power measurements etc [27-30], the LAC-clustering is different in the way it does not consider user's trajectory or behavioral data, it simply filters out the raw GSM location data so that it can later be used for Mobility profile mining. We are not using any other attribute but only the location information of GSM data for outlier detection and removal.
Let C= {c1, c2, …,cn} be the set of cell id’s in a specific
location area. First we calculate Euclidean distance of all possible pairs of cell ids. Then we define a proximity matrix P=[dij] where 1≤ i , j ≤n and dij is the distance between ci and
cj. for every k ϵ{1,2,…,n}, spot out the smallest value of
dkj. Merge ck and cj. Now again calculate Euclidean distance
and proximity matrix and repeat the steps mentioned above. Continue this process until we get a single cluster with maximum merging and assign it to the location area as representative. The pseudo code of algorithm is as:
This algorithm, described in a detailed manner with in [24], makes sure that all the locations represented by the location area are true, dense and outlier free. As each sub-cluster generated in step 4-6 is true representative of dense location
within the location area, so at step 7-8 only single true most dense representative is assigned to the location area on every iteration. While the Euclidean distance determines that the location points linked or merged together are similar which ensures the removal of any spatial outlier form the data. This algorithm ensures that during the Mobility profile mining these clusters can be used as clean & outlier free set of unique locations (We are considering the profile building as our next step in our framework so it is out of scope of this work).
C. Google API and My Location (Beta) service:
For retrieval of location coordinates there are many publically available Cell-id databases e.g. Open Cell ID database [31] with more than worldwide 620,000 unique cells, CellDB [32] with 180,000 cells and CellSpotting.com [33] with 111,000 cells are publically available databases for Cell IDs, however they differ in term of number of stored cells, data access methodology and content source. While Ericson Cell ID look-up API [34] and Location-API.com [35] are “crowd-sourced” based Cell ID databases, consist of around 7 Million Cell IDs each which are gathered thorough GPS. Main problem with these Cell ID databases is that they are sparse or have limited coverage. In this scenario the Google Cell ID database is more fit to any problem of Cell ID relative longitude and latitude coordinates retrieval.
Google inc. in 2007 went “crowd sourced” by introducing the Beta version of My location [36] service which works well enough for Cell Global Identity (CGI) information. This CGI information is sent to the Google API i.e. longitude and latitude values of location to which CGI belongs to. Beside this location request method many work has been done regarding the direct use of Google API for the translation of CGI [37, 38] into latitude and longitude coordinates.
IV. DATASET
V. EXPERIMENTSANDRESULTS
As mentioned we have chosen the reality mining dataset for our experimental purposes. The results are as under.
A. Location retrieval with Google API:
As reality mining dataset contains incomplete CGI information i.e. MCC and MNC is missing in the location header, so it is only LAC and Cell ID which can be used for the location tracking. The authors of [24] observedthat due to of GSM basic network properties LAC and Cell-id are enough to predict the coordinate of the user location thorough public Cell-id database i.e. Google location API. Further Google Cell ID database is crowd source based and LAC is uniquely distributed among the operators in one country (As discussed in section III.I) so this set of information is enough for location retrieval. The unique cell locations are available in s(n).all_locs table of reality mining data, we used this information for retrieval of location visited by the user, these unique locations are 1744 for the subject user X. We requested the Google Cell –id database using the bath tool and retrieved 680 cells which are 39% of original data because of development of 3G networks across the USA over last years, relabeling of cells, reuse of cells and the reality mining dataset is almost 7 years old. However our assumption made in section III.A about the GSM network architecture is dealt well enough because we retrieved the location information only using the LAC and Cell ID as LAC is most important unit in any GSM network. The Table 1 represents the consolidated information regarding the observations made during experiment.
Table 1: cells retrieved through google location api
# of Cells %
Total number of unique cells against
subject X 1744 100%
# of Cell’s location retrieved thorough
Google API 680 39%
B. Removal of Spatial Outliers:
As discussed and presented in section III.B we implemented the LAC-clustering algorithm on the retrieved cells to remove the outliers from the dataset. Being critical indicator we defined minimum threshold of 10 cells at one location to be considered as cluster place. As mentioned before we used Euclidian distance as the basic distance measure, this worked quite well for dense mobility data regardless of its high distant objects limitation for plane surface because of short distance between cells lies in one LAC. As a result of the LAC-clustering algorithm we retrieved 649 cells finally which are 35% of total unique cells. But these 649 cells are cleaned and are spatial outliers free. We observed two false negative with same LAC because of missing MNC and MCC information in it along with expected change in GSM network for up gradation and re arrangement.
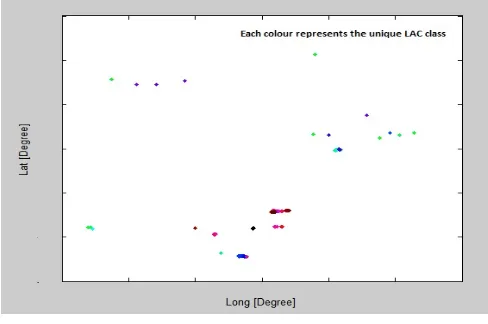
To show the complete comparison we plotted scattered graph for all cells retrieved through the Google API in
Figure 3, where each color represents the unique location area and it is quite clear that there are certain points where cells are unequally scattered over coordinates regardless of their location area class.
Figure: 3 All Unique cells.
While in case of Figure 4 the Cells are retrieved after clustering shows the dense region, cells are tightly bound to their location area class and outlier free.
Figure: 4 Clustered cells
Figure: 5 Area-wise appearances of cells before and after clustering.
For our further analysis we plotted the unique cell’s location information extracted from the Google API on world map as shown in Figure 6. This shows the mobility spread over many regions not limited to USA territory and some places unevenly distributed. However Figure 7 represents the clustered data which is spatial outliers free as a result of proposed clustering algorithms. This figure shows the clear dense form of data, where data is tightly coupled and consolidated in nature. The comparison of results shown in Figure 6 and Figure 7 make it clear that spatial outliers are obvious in GSM data which can lead to wrong Mobility profile mining, these spatial outliers are meant to be dealt well before precise mobility building.
Figure: 6 Unique cells with expected spatial outliers.
Figure: 7 Clustered cells result.
As shown in Figure 8 where clustered location are represented by green spots and red spots are unique cells which were outliers in the data removed through the proposed clustering algorithm. So our result clearly shows that the clustered locations are outlier free, so this finally retrieved data is perfect for concise, accurate and smart Mobility profile mining in later stage for potential applications.
Figure: 8 Result of the clustering.
VI. CONCLUSIONANDFUTUREWORK
As this work only focused on the data pre-processing so we successfully detected and removed the spatial outliers from GSM raw data by using the LAC-clustering algorithm. This data is outlier free, concise and accurate for potential applications i.e. Mobility profile mining, social network analysis, geographical proximity detection, route prediction.
VII. ACKNOWLEDGMENT
The work described in this paper was supported by grants from Natural Science Foundation of China (Grant No. 60775037), The National Major Special Science & Technology Projects (Grant No. 2011ZX04016-071), The HeGaoJi National Major Special Science & Technology Projects (Grant No. 2012ZX01029001-002) and Research Fund for the Doctoral Program of Higher Education of China (20093402110017,20113402110024).
We would like to acknowledge and heartfelt gratitude to Michal Ficek and Lukas Kencl, R&D Centre for Mobile, Applications, Czech Technical University in Prague Czech Republic who have made the completion of this research work possible by providing timely help and support.
VIII. REFERENCES
[1] Kanhere, S.S., Participatory Sensing: Crowdsourcing Data from Mobile Smartphones in Urban Spaces Mobile Data Management (MDM) 12th IEEE International Conference, 2011. 2: p. 3-6.
[2] Changhong, Y., et al., Use of Mobile Phones in an Emergency Reporting System for Infectious Disease Surveillance after the Sichuan Earthquake in China. Bulletin of the World Health Organization, 2009. 87(8): p. 619-623.
[3] Manuel, C., et al., Data Stream Processing on Real-time Mobile Advertisement: Ericsson Research Approach. 12th IEEE International Conference on Mobile Data Management, 2011. 1: p. 313 - 320
[6] Harter, A. and A. Hopper, A distributed location system for
the active office. IEEE Network, 1994. 8: p. 62-70.
[7] Harter, A., et al., The Anatomy of a Context-Aware Application. Wireless Networks, 2002. 8: p. 187-197.
[8]
on 25/3/2012.
[9] A. L. et al. Impact of communication infrastructure on forwarding in pocket switched networks. In SIGCOMM ’06, pages 261–268, 2006.
[10]L. Wang, Y. Jia, and W. Han. Instant message clustering based on extended vector space model. In ISICA, pages 435– 443, 2007.
[11]C.M.MircoMusolesi.Mobilitymodels for systems evaluation a survey. Survey, 2008.
[12]J. B. et al. Participatory sensing. In ACM Sensys World Sensor Web Workshop, 2006.
[13]M. S. Darko Kirovski, Nuria Oliver and D. Tan. Health-os: A position paper. In ACM SIGMOBILE international workshop on Systems and networking support for healthcare and assisted living environments, 2007.
[14]M. Zonoozi and P. Dassanayake. User mobility modeling and characterization of mobility pattern. IEEE J. Selec. Areas Commun., 15 (7):1239–1252, 1997.
[15]E. Daly and M. Haahr. Social network analysis for routing in disconnected delay-tolerant manets. In MobiHoc ’07, pages 32–40, 2007.
[16]K. Laasonen. Clustering and prediction of mobile user routes from cellular data. In PKDD, pages 569–576, 2005.
[17]C.M.MircoMusolesi.Mobilitymodels for systems evaluation a survey. Survey, 2008.
[18]I. F. Akyildiz andW.Wang. The predictive usermobility profile framework for wireless multimedia networks. IEEE/ACM Trans. Netw., 12(6):1021–1035, 2004.
[19]A. Chaintreau, P. Hui, J. Crowcroft, C. Diot, R. Gass, and J. Scott. Impact of human mobility on opportunistic forwarding algorithms. IEEE Trans. Mob.Comput., 6(6):606–620, 2007. [20]M. Zonoozi and P. Dassanayake. User mobility modeling and
characterization of mobility pattern. IEEE J. Selec. Areas Commun., 15 (7):1239–1252, 1997.
[21]J. Markoulidakis, G. Lyberopoulos, D. Tsirkas, and E. Sykas. Mobility modeling in third-generation mobile telecommunication systems. IEEE Personal Communications, pages 41–56, August 1997.
[22]M. Gonzalez, C. Hidalgo, and A. Barabasi. Understanding individual human mobility patterns. Nature, 453(7196):779– 782, 2008.
[23]P. Nurmi and J. Koolwaaij. Identifying meaningful locations. In In Proc. 3rd Annual International Conference on Mobile and Ubiquitous Computing (Mobiquitous, Sun Jose, CA, USA, July 2006), IEEE Computer Society, 2006, 2006. [24]Ficek, M.; Kencl, L.; , "Spatial extension of the Reality
Mining Dataset," Mobile Adhoc and Sensor Systems (MASS), 2010 IEEE 7th International Conference on , vol., no., pp.666-673, 8-12 Nov. 2010 doi: 10.1109/MASS.2010.5663788
[25]Shekhar, C. T. Lu, P. Zhang, R. Liu, “Data mining for selective visualization of large spatial datasets,” Processing of 14th IEEE international conference on tools with artificial intelligence (ICTAI’02), 2002.
[26]
[27]Zhongzhi.L, Xuegang.W, “Spatial Clustering Algorithm Based on Hierarchical-Partition Tree”, International Journal of Digital Content Technology and its Applications,pp.210-215,Volume 4, Number 6, September 2010
[28]V. Bogorny, C. A. Heuser, and L. O. Alvares. A conceptual data model for trajectory data mining. In GIScience, pages 1– 15, 2010.
[29]P. O. V. de Melo, L. Akoglu, C. Faloutsos, and A. A. Loureiro. Surprising Patterns for the Call Duration Distribution of Mobile Phone Users. ECML PKDD: European Conference on Machine Learning and Principles and Practice of Knowledge Discovery in Databases, 2010.
[30]Miklós Kurucz ,András Benczúr, Károly Csalogány, László Lukács (2009): Spectral Clustering in Telephone Call Graphs, ACM 978-1-59593-848-0
[31]Farrahi, K., Gatica-Perez, D.: Discovering human routines from cell phone data with topic models. 2008 12th IEEE International Symposium on Wearable Computers pp. 29–32 (2008)
[32]8motions. (2010) OpenCellId. [Online]. Available:
[33]CellDB. (2008). [Online]. Available
[35]Ericsson Labs. (2010) Mobile location. Available: https://labs.ericsson.com/apis/mobile-location/
[36]Location-API.com. (2009) Combain Mobile AB. [Online]. Available
[37]M. Chu. (2007, November) New magical blue circle on your
map. Google Inc. [Online].
Available:http://googlemobile.blogspot.com/2007/11/newmag ical-blue-circle-on-your-map.html
[38]Plusminus. (2007, November) Poor mans GPS –Cell (Tower)ID / Location Area Code - Lookup. [Online].
Available: