Scholarship@Western
Scholarship@Western
Electronic Thesis and Dissertation Repository
11-21-2017 2:30 PM
Partial Material Strength Reduction Factors for ACI 318
Partial Material Strength Reduction Factors for ACI 318
Tong Zhang
The University of Western Ontario
Supervisor Bartlett, Michael
The University of Western Ontario
Graduate Program in Civil and Environmental Engineering
A thesis submitted in partial fulfillment of the requirements for the degree in Master of Engineering Science
© Tong Zhang 2017
Follow this and additional works at: https://ir.lib.uwo.ca/etd
Part of the Structural Engineering Commons
Recommended Citation Recommended Citation
Zhang, Tong, "Partial Material Strength Reduction Factors for ACI 318" (2017). Electronic Thesis and Dissertation Repository. 5135.
https://ir.lib.uwo.ca/etd/5135
This Dissertation/Thesis is brought to you for free and open access by Scholarship@Western. It has been accepted for inclusion in Electronic Thesis and Dissertation Repository by an authorized administrator of
i
Abstract
The strength reduction factors, , defined in ACI 318-14 for different structural actions and
elements lead to inconsistent results. This study proposes partial material strength reduction
factors for concrete, c, and reinforcing steel, s, that yield similar design strengths and more
consistent reliability indices. Three structural actions are investigated: moment; shear; and,
combined moment and axial force. The first-order, second-moment method is used to
compute reliability indices for moment and shear, and Monte Carlo simulation is used for
combined moment and axial force. The statistical parameters assumed for the professional
factor for shear strength significantly impact the reliability indices. Although no single
combination of s and c is the best for these three actions, the recommended partial material
strength reduction factors are s of 0.90 and c of 0.60, or for spirally reinforced columns,
0.70. Alternatively, for shear, the combination with s of 0.80 and c of 0.65 is
recommended.
Keywords
reinforced concrete; partial material strength reduction factors; moment; shear; slabs; beams;
ii
Acknowledgments
I would like to express my sincere appreciation to my supervisor, Dr. Michael Bartlett for
providing me with the opportunity to do this research. His educational and research
experience allowed me to learn various knowledge, his earnestness and preciseness
encouraged me to be strict with myself, and his patience made me overcome difficulties.
I also appreciate the colleagues and professors who inspired me.
I thank The University of Western Ontario for providing financial support in the form of the
Western Graduate Research Scholarship, Western Graduate Research Assistance, Graduate
Research Assistantship, and Graduate Teaching Assistantship. Financial support through Dr.
Bartlett’s NSERC Discovery Grant is also gratefully acknowledged.
iii
Table of Contents
Abstract ... i
Acknowledgments... ii
Table of Contents ... iii
List of Tables ... vii
List of Figures ... x
List of Appendices ... xii
Notation... xxi
Chapter 1 ... 1
1 Introduction ... 1
1.1 Introduction ... 1
1.2 Objective ... 4
1.3 Outline... 4
Chapter 2 ... 10
2 Derivation of Partial Material Strength Reduction Factors Based on Design Strengths ... 10
2.1 Introduction ... 10
2.2 Methodology ... 10
2.3 Moment ... 11
2.3.1 Geometric and Material Properties ... 11
2.3.2 Design Strength Ratios ... 12
2.3.3 Recommended Partial Material Strength Reduction Factors ... 15
2.4 One-way Shear ... 17
2.4.1 Geometric and Material Properties ... 17
2.4.2 Design Strength Ratios ... 17
iv
2.5.1 Geometric and Material Properties ... 20
2.5.2 Design Strength Ratios ... 21
2.5.3 Recommended Partial Material Strength Reduction Factors ... 28
2.6 Summary and Conclusions ... 29
Chapter 3 ... 50
3 Derivation of Partial Material Strength Reduction Factors for Moment or One-way Shear Based on Reliability Indices ... 50
3.1 Introduction ... 50
3.2 Methodology ... 50
3.2.1 Reliability Model ... 51
3.2.2 Determination of Statistical Parameters for Resistance and Load Effect . 52 3.3 Statistical Parameters ... 53
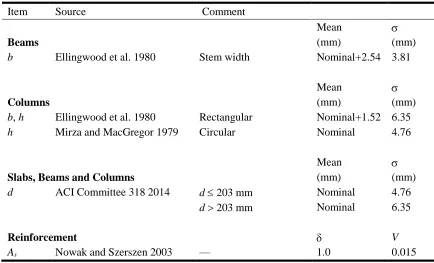
3.3.1 Geometric Properties ... 53
3.3.2 Material Strengths ... 53
3.3.3 Professional Factors ... 54
3.3.4 Load Effects ... 55
3.4 Moment ... 56
3.4.1 Assumptions and Design Criteria ... 56
3.4.2 Reliability Analyses ... 57
3.4.3 Recommended Partial Material Strength Reduction Factors ... 61
3.5 One-way Shear ... 61
3.5.1 Assumptions and Design Criteria ... 61
3.5.2 Reliability Analyses ... 62
3.5.3 Recommended Partial Material Strength Reduction Factors ... 65
v
4 Derivation of Partial Material Strength Reduction Factors for Combined Moment and
Axial Force Based on Reliability Indices... 86
4.1 Introduction ... 86
4.2 Methodology ... 86
4.3 Assumptions and Design Criteria ... 87
4.4 Reliability Analyses ... 87
4.5 Recommended Partial Material Strength Reduction Factors ... 93
4.6 Summary and Conclusions ... 94
Chapter 5 ... 105
5 Summary and Conclusions ... 105
5.1 Summary ... 105
5.2 Conclusions ... 107
5.3 Suggestions for Future Work ... 110
References ... 111
Appendix A-Supplementary Information for Chapter 2 ... 113
A.1 Codes ... 136
A.1.1 Notation ... 136
A.1.2 Column Section 1 ... 139
A.1.3 Column Section 5 ... 153
Appendix B-Supplementary Information for Chapter 3 ... 171
B.1 Supplemtentary Information for Concrete Compressive Strength ... 171
Appendix C-Supplementary Information for Chapter 4 ... 184
C.1 Codes ... 224
C.1.1 Notation ... 224
vi
vii
List of Tables
Table 1.1: Strength reduction factors, , in ACI 318-14 ... 6
Table 1.2: Strength reduction factors, , for moment, axial force, or combined moment and
axial force, in ACI 318-14 ... 6
Table 2.1: Partial material strength reduction factor combinations ... 31
Table 2.2: Means and standard deviations of design flexural strength ratios, M,for fc 25
MPa and 0.003–0.005 ... 31
Table 2.3: Means and standard deviations of design flexural strength ratios, M,for fc 25
MPa and 0.006–0.010 ... 31
Table 2.4: Means and standard deviations of design flexural strength ratios, M, for fc 25
MPa and 0.011–0.018 ... 32
Table 2.5: Means and standard deviations of design flexural strength ratios, M, for fc45
MPa and 0.003–0.005 ... 32
Table 2.6: Means and standard deviations of design flexural strength ratios, M, for fc 45
MPa and 0.006–0.010 ... 32
Table 2.7: Means and standard deviations of design flexural strength ratios, M, for fc 45
MPa and 0.011–0.018 ... 33
Table 2.8: Means and standard deviations of design shear strength ratios, V, for fc 25
MPa and t 0.001–0.007 ... 33
Table 2.9: Means and standard deviations of design shear strength ratios, V, for fc 45
MPa and t 0.001–0.010 ... 33
viii
ratios, PM, for Column Section 1 and 0 e/h 0.3 ... 34
Table 2.12: Means and standard deviations of design combined flexural and axial strength ratios, PM, for Column Section 1 and 0.3 e/h 1.0 ... 34
Table 2.13: Means and standard deviations of design combined flexural and axial strength ratios, PM, for Column Section 1 and 1.0 e/h 10.0 ... 35
Table 2.14: Means and standard deviations of design combined flexural and axial strength ratios, PM, for Column Section 1 and e/h 0 ... 35
Table 2.15: Means and standard deviations of design combined flexural and axial strength ratios, PM, for Column Section 5 and 0 e/h 0.3 ... 35
Table 2.16: Means and standard deviations of design combined flexural and axial strength ratios, PM, for Column Section 5 and 0.3 e/h 1.0 ... 36
Table 2.17: Means and standard deviations of design combined flexural and axial strength ratios, PM, for Column Section 5 and 1.0 e/h 10.0 ... 36
Table 2.18: Means and standard deviations of design combined flexural and axial strength ratios, PM, for Column Section 5 and e/h 0 ... 36
Table 3.1: Statistical parameters for geometric properties used in this study... 67
Table 3.2: Statistical parameters for concrete compressive strength used in this study ... 67
Table 3.3: Statistical parameters for professional factors ... 68
Table 3.4: Statistical parameters for load effects ... 69
Table 3.5: Design conditions for moment ... 70
ix
material strength reduction factors, Mr, for fc 25 MPa and 0.003–0.005 ... 72
Table 3.8: Means and standard deviations of reliability indices for moment using partial material strength reduction factors, Mr, for fc 25 MPa and 0.006–0.010 ... 72
Table 3.9: Means and standard deviations of reliability indices for moment using partial material strength reduction factors, Mr, for fc 25 MPa and 0.011–0.018 ... 73
Table 3.10: Design conditions for shear ... 73
Table 3.11: Statistical parameters for shear reliability analysis... 74
Table 3.12: Statistical parameters for professional factor for shear ... 74
Table 3.13: Means and standard deviations of reliability index ratios for shear, Vu/Vr, for fc 25 MPa and t 0.001–0.007 ... 75
Table 4.1: Statistical parameters for column reliability analysis ... 95
Table 4.2: Means, standard deviations, minima and maxima of reliability indices for combined moment and axial force, PM, for Column Section 1 ... 96
Table 4.3: Means, standard deviations, minima and maxima of reliability indices for combined moment and axial force, PM, for Column Section 2 ... 97
Table 4.4: Means, standard deviations, minima and maxima of reliability indices for combined moment and axial force, PM, for Column Section 3 ... 98
Table 4.5: Means, standard deviations, minima and maxima of reliability indices for combined moment and axial force, PM, for Column Section 4 ... 99
x
List of Figures
Figure 1.1: Strain distribution and net tensile strain in a nonprestressed member (ACI
Committee 318 2014) ... 7
Figure 1.2: Variation of with net tensile strain in extreme tension reinforcement, t (ACI Committee 318 2014) ... 7
Figure 1.3: Interaction diagrams for a square column ... 8
Figure 1.4: Interaction diagrams for a circular tied column ... 8
Figure 1.5: Interaction diagrams for an L-shape wall (Lequesne and Pincheira 2014) ... 9
Figure 2.1: Design flexural strength ratios, M, for fc25 MPa and 0.003–0.018 ... 37
Figure 2.2: Design flexural strength ratios, M, for fc45 MPa and 0.003–0.018 ... 38
Figure 2.3: Design shear strength ratios, V, for fc25 MPa and t 0.001–0.007: (a) s 0.80; (b) s 0.85; (c) s 0.90; (d) s 0.95 ... 40
Figure 2.4: Design shear strength ratios, V, for fc45 MPa and t 0.001–0.010: (a) s 0.80; (b) s 0.85; (c) s 0.90; (d) s 0.95 ... 42
Figure 2.5: Five column cross sections: (a) Column Section 1; (b) Column Section 2; (c) Column Section 3; (d) Column Section 4; (e) Column Section 5... 43
Figure 2.6: Circular segments: (a) ah/2, π/2; (b) ah/2, π/2 (Wight 2016) ... 43
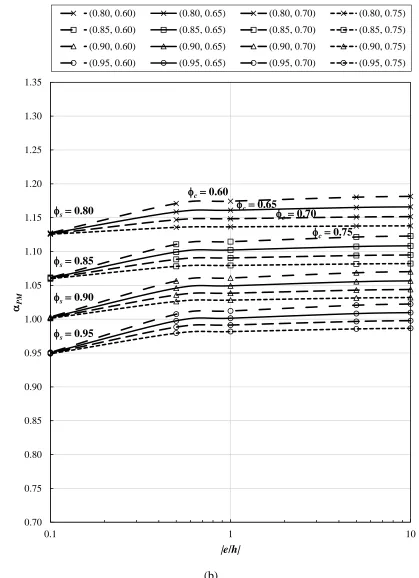
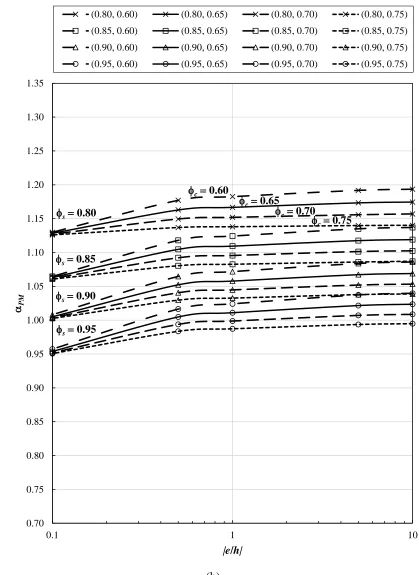
Figure 2.7: Design combined flexural and axial strength ratios, PM, for Column Section 1 and Property Combination 1: (a) e/h 0; (b) e/h 0 ... 45
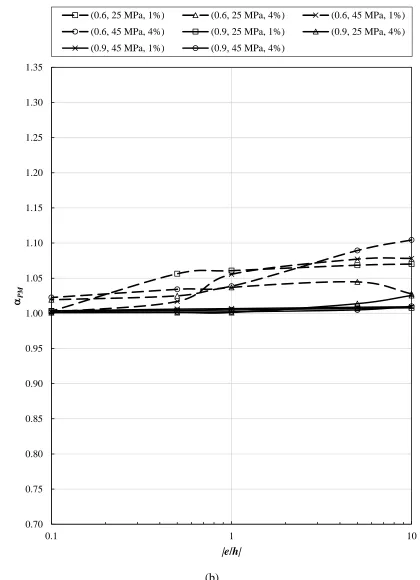
Figure 2.8: Design combined flexural and axial strength ratios, PM, corresponding to ACI 318-14, and s 0.90 and c 0.60, for Column Section 1: (a) e/h 0; (b) e/h 0 ... 47
xi
Figure 3.1: Reliability indices for moment, M, for fc25 MPa, wL/wD 0.5, 0.003–
0.018, and constant coefficients of variation for d ... 76
Figure 3.2: Linear variation of coefficients of variation for d ... 77
Figure 3.3: Reliability indices for moment, M, for fc25 MPa, wL/wD 0.5, 0.003–
0.018, and linear coefficients of variation for d ... 78
Figure 3.4: Reliability indices for moment, M, for fc25 MPa, wL/wD 1.5, 0.003–
0.018, and linear coefficients of variation for d ... 79
Figure 3.5: Reliability indices for shear, V, for fc25 MPa, wL/wD 0.5, and t 0.001–
0.007: (a) s 0.80; (b) s 0.85; (c) s 0.90; (d) s 0.95 ... 81
Figure 3.6: Reliability indices for shear, V, for fc25 MPa, wL/wD 1.5, and t 0.001–
0.007: (a) s 0.80; (b) s 0.85; (c) s 0.90; (d) s 0.95 ... 83
Figure 3.7: Reliability indices for shear, V, for fc25 MPa, wL/wD 0.5, t 0.001–0.007,
bias coefficient for professional factor 1.075, and coefficient of variation for professional
factor 0.10: (a) s 0.80; (b) s 0.85; (c) s 0.90; (d) s 0.95 ... 85
Figure 4.1: Reliability indices for combined moment and axial force using strength reduction
factors in ACI 318-14, PMu, for Column Section 1 and L/D 0.5: (a) e/h 0; (b) e/h 0 . 101
Figure 4.2: Reliability indices for combined moment and axial force, PMr, corresponding to s 0.90 and c 0.60, for Column Section 1 and L/D 0.5: (a) e/h 0; (b) e/h 0 ... 102
Figure 4.3: Reliability indices for combined moment and axial force, PM, for Column
Section 1, Property Combination 1, and L/D 0.5: (a) e/h 0; (b) e/h 0 ... 103
Figure 4.4: Reliability indices for combined moment and axial force, PM, for Column
xii
List of Appendices
Table A.1: Means and standard deviations of design combined flexural and axial strength
ratios, PM, for Column Section 2 and 0 e/h 0.4 ... 113
Table A.2: Means and standard deviations of design combined flexural and axial strength
ratios, PM, for Column Section 2 and 0.4 e/h 1.0 ... 113
Table A.3: Means and standard deviations of design combined flexural and axial strength
ratios, PM, for Column Section 2 and 1.0 e/h 10.0 ... 113
Table A.4: Means and standard deviations of design combined flexural and axial strength
ratios, PM, for Column Section 2 ande/h 0 ... 114
Table A.5: Means and standard deviations of design combined flexural and axial strength
ratios, PM, for Column Section 3 and 0 e/h 0.3 ... 114
Table A.6: Means and standard deviations of design combined flexural and axial strength
ratios, PM, for Column Section 3 and 0.3 e/h 1.0 ... 114
Table A.7: Means and standard deviations of design combined flexural and axial strength
ratios, PM, for Column Section 3 and 1.0 e/h 10.0 ... 115
Table A.8: Means and standard deviations of design combined flexural and axial strength
ratios, PM, for Column Section 3 ande/h 0 ... 115
Table A.9: Means and standard deviations of design combined flexural and axial strength
ratios, PM, for Column Section 4 and 0 e/h 0.3 ... 115
Table A.10: Means and standard deviations of design combined flexural and axial strength
ratios, PM, for Column Section 4 and 0.3 e/h 1.0 ... 116
Table A.11: Means and standard deviations of design combined flexural and axial strength
xiii
ratios, PM, for Column Section 4 ande/h 0 ... 116
Figure A.1: Design combined flexural and axial strength ratios, PM, for Column Section 1
and Property Combination 2: (a) e/h 0; (b) e/h 0 ... 117
Figure A.2: Design combined flexural and axial strength ratios, PM, for Column Section 1
and Property Combination 3: (a) e/h 0; (b) e/h 0 ... 117
Figure A.3: Design combined flexural and axial strength ratios, PM, for Column Section 1
and Property Combination 4: (a) e/h 0; (b) e/h 0 ... 118
Figure A.4: Design combined flexural and axial strength ratios, PM, for Column Section 1
and Property Combination 5: (a) e/h 0; (b) e/h 0 ... 118
Figure A.5: Design combined flexural and axial strength ratios, PM, for Column Section 1
and Property Combination 6: (a) e/h 0; (b) e/h 0 ... 119
Figure A.6: Design combined flexural and axial strength ratios, PM, for Column Section 1
and Property Combination 7: (a) e/h 0; (b) e/h 0 ... 119
Figure A.7: Design combined flexural and axial strength ratios, PM, for Column Section 1
and Property Combination 8: (a) e/h 0; (b) e/h 0 ... 120
Figure A.8: Design combined flexural and axial strength ratios, PM, for Column Section 2
and Property Combination 1: (a) e/h 0; (b) e/h 0 ... 120
Figure A.9: Design combined flexural and axial strength ratios, PM, for Column Section 2
and Property Combination 2: (a) e/h 0; (b) e/h 0 ... 121
Figure A.10: Design combined flexural and axial strength ratios, PM, for Column Section 2
xiv
Figure A.11: Design combined flexural and axial strength ratios, PM, for Column Section 2
and Property Combination 4: (a) e/h 0; (b) e/h 0 ... 122
Figure A.12: Design combined flexural and axial strength ratios, PM, for Column Section 2
and Property Combination 5: (a) e/h 0; (b) e/h 0 ... 122
Figure A.13: Design combined flexural and axial strength ratios, PM, for Column Section 2
and Property Combination 6: (a) e/h 0; (b) e/h 0 ... 123
Figure A.14: Design combined flexural and axial strength ratios, PM, for Column Section 2
and Property Combination 7: (a) e/h 0; (b) e/h 0 ... 123
Figure A.15: Design combined flexural and axial strength ratios, PM, for Column Section 2
and Property Combination 8: (a) e/h 0; (b) e/h 0 ... 124
Figure A.16: Design combined flexural and axial strength ratios, PM, for Column Section 3
and Property Combination 1: (a) e/h 0; (b) e/h 0 ... 124
Figure A.17: Design combined flexural and axial strength ratios, PM, for Column Section 3
and Property Combination 2: (a) e/h 0; (b) e/h 0 ... 125
Figure A.18: Design combined flexural and axial strength ratios, PM, for Column Section 3
and Property Combination 3: (a) e/h 0; (b) e/h 0 ... 125
Figure A.19: Design combined flexural and axial strength ratios, PM, for Column Section 3
and Property Combination 4: (a) e/h 0; (b) e/h 0 ... 126
Figure A.20: Design combined flexural and axial strength ratios, PM, for Column Section 3
and Property Combination 5: (a) e/h 0; (b) e/h 0 ... 126
Figure A.21: Design combined flexural and axial strength ratios, PM, for Column Section 3
and Property Combination 6: (a) e/h 0; (b) e/h 0 ... 127
Figure A.22: Design combined flexural and axial strength ratios, PM, for Column Section 3
xv
Figure A.23: Design combined flexural and axial strength ratios, PM, for Column Section 3
and Property Combination 8: (a) e/h 0; (b) e/h 0 ... 128
Figure A.24: Design combined flexural and axial strength ratios, PM, for Column Section 4
and Property Combination 1: (a) e/h 0; (b) e/h 0 ... 128
Figure A.25: Design combined flexural and axial strength ratios, PM, for Column Section 4
and Property Combination 2: (a) e/h 0; (b) e/h 0 ... 129
Figure A.26: Design combined flexural and axial strength ratios, PM, for Column Section 4
and Property Combination 3: (a) e/h 0; (b) e/h 0 ... 129
Figure A.27: Design combined flexural and axial strength ratios, PM, for Column Section 4
and Property Combination 4: (a) e/h 0; (b) e/h 0 ... 130
Figure A.28: Design combined flexural and axial strength ratios, PM, for Column Section 4
and Property Combination 5: (a) e/h 0; (b) e/h 0 ... 130
Figure A.29: Design combined flexural and axial strength ratios, PM, for Column Section 4
and Property Combination 6: (a) e/h 0; (b) e/h 0 ... 131
Figure A.30: Design combined flexural and axial strength ratios, PM, for Column Section 4
and Property Combination 7: (a) e/h 0; (b) e/h 0 ... 131
Figure A.31: Design combined flexural and axial strength ratios, PM, for Column Section 4
and Property Combination 8: (a) e/h 0; (b) e/h 0 ... 132
Figure A.32: Design combined flexural and axial strength ratios, PM, for Column Section 5
and Property Combination 2: (a) e/h 0; (b) e/h 0 ... 132
Figure A.33: Design combined flexural and axial strength ratios, PM, for Column Section 5
and Property Combination 3: (a) e/h 0; (b) e/h 0 ... 133
Figure A.34: Design combined flexural and axial strength ratios, PM, for Column Section 5
xvi
Figure A.35: Design combined flexural and axial strength ratios, PM, for Column Section 5
and Property Combination 5: (a) e/h 0; (b) e/h 0 ... 134
Figure A.36: Design combined flexural and axial strength ratios, PM, for Column Section 5 and Property Combination 6: (a) e/h 0; (b) e/h 0 ... 134
Figure A.37: Design combined flexural and axial strength ratios, PM, for Column Section 5 and Property Combination 7: (a) e/h 0; (b) e/h 0 ... 135
Figure A.38: Design combined flexural and axial strength ratios, PM, for Column Section 5 and Property Combination 8: (a) e/h 0; (b) e/h 0 ... 135
Table B.1: Statistical parameters for geometric properties ... 172
Table B.2: Statistical parameters for F1 ... 173
Table B.3: Statistical parameters for F2 ... 173
Table B.4: Statistical parameters for Fi-p ... 173
Table B.5: Statistical parameters for in-situ concrete compressive strength ... 174
Table B.6: Statistical parameters for fy 420 MPa ... 174
Table B.7: Means and standard deviations of reliability indices for moment using partial material strength reduction factors, Mr, for fc 45 MPa and 0.003–0.005 ... 175
Table B.8: Means and standard deviations of reliability indices for moment using partial material strength reduction factors, Mr, for fc 45 MPa and 0.006–0.010 ... 175
Table B.9: Means and standard deviations of reliability indices for moment using partial material strength reduction factors, Mr, for fc 45 MPa and 0.011–0.018 ... 176
xvii
Figure B.1: Reliability indices for moment, M, for fc45 MPa, wL/wD 0.5, 0.003–
0.018, and constant coefficients of variation for d ... 177
Figure B.2: Reliability indices for moment, M, for fc45 MPa, wL/wD 0.5, 0.003–
0.018, and linear coefficients of variation for d ... 178
Figure B.3: Reliability indices for moment, M, for fc45 MPa, wL/wD 1.5, 0.003–
0.018, and linear coefficients of variation for d ... 179
Figure B.4: Reliability indices for shear, V, for fc45 MPa, wL/wD 0.5, and t 0.001–
0.010: (a) s 0.80; (b) s 0.85; (c) s 0.90; (d) s 0.95 ... 181
Figure B.5: Reliability indices for shear, V, for fc45 MPa, wL/wD 1.5, and t 0.001–
0.010: (a) s 0.80; (b) s 0.85; (c) s 0.90; (d) s 0.95 ... 183
Figure C.1: Reliability indices for combined moment and axial force using strength
reduction factors in ACI 318-14, PMu, for Column Section 1 and L/D 1.5: (a) e/h 0; (b) e/h 0 ... 184
Figure C.2: Reliability indices for combined moment and axial force, PMr, corresponding to s 0.90 and c 0.60, for Column Section 1 and L/D 1.5: (a) e/h 0; (b) e/h 0 ... 185
Figure C.3: Reliability indices for combined moment and axial force, PM, for Column
Section 1, Property Combination 2, and L/D 0.5: (a) e/h 0; (b) e/h 0 ... 186
Figure C.4: Reliability indices for combined moment and axial force, PM, for Column
Section 1, Property Combination 3, and L/D 0.5: (a) e/h 0; (b) e/h 0 ... 187
Figure C.5: Reliability indices for combined moment and axial force, PM, for Column
xviii
Figure C.6: Reliability indices for combined moment and axial force, PM, for Column
Section 1, Property Combination 5, and L/D 0.5: (a) e/h 0; (b) e/h 0 ... 189
Figure C.7: Reliability indices for combined moment and axial force, PM, for Column
Section 1, Property Combination 6, and L/D 0.5: (a) e/h 0; (b) e/h 0 ... 190
Figure C.8: Reliability indices for combined moment and axial force, PM, for Column
Section 1, Property Combination 7, and L/D 0.5: (a) e/h 0; (b) e/h 0 ... 191
Figure C.9: Reliability indices for combined moment and axial force, PM, for Column
Section 1, Property Combination 8, and L/D 0.5: (a) e/h 0; (b) e/h 0 ... 192
Figure C.10: Reliability indices for combined moment and axial force, PM, for Column
Section 2, Property Combination 1, and L/D 0.5: (a) e/h 0; (b) e/h 0 ... 193
Figure C.11: Reliability indices for combined moment and axial force, PM, for Column
Section 2, Property Combination 2, and L/D 0.5: (a) e/h 0; (b) e/h 0 ... 194
Figure C.12: Reliability indices for combined moment and axial force, PM, for Column
Section 2, Property Combination 3, and L/D 0.5: (a) e/h 0; (b) e/h 0 ... 195
Figure C.13: Reliability indices for combined moment and axial force, PM, for Column
Section 2, Property Combination 4, and L/D 0.5: (a) e/h 0; (b) e/h 0 ... 196
Figure C.14: Reliability indices for combined moment and axial force, PM, for Column
Section 2, Property Combination 5, and L/D 0.5: (a) e/h 0; (b) e/h 0 ... 197
Figure C.15: Reliability indices for combined moment and axial force, PM, for Column
Section 2, Property Combination 6, and L/D 0.5: (a) e/h 0; (b) e/h 0 ... 198
Figure C.16: Reliability indices for combined moment and axial force, PM, for Column
Section 2, Property Combination 7, and L/D 0.5: (a) e/h 0; (b) e/h 0 ... 199
Figure C.17: Reliability indices for combined moment and axial force, PM, for Column
xix
Figure C.18: Reliability indices for combined moment and axial force, PM, for Column
Section 3, Property Combination 1, and L/D 0.5: (a) e/h 0; (b) e/h 0 ... 201
Figure C.19: Reliability indices for combined moment and axial force, PM, for Column
Section 3, Property Combination 2, and L/D 0.5: (a) e/h 0; (b) e/h 0 ... 202
Figure C.20: Reliability indices for combined moment and axial force, PM, for Column
Section 3, Property Combination 3, and L/D 0.5: (a) e/h 0; (b) e/h 0 ... 203
Figure C.21: Reliability indices for combined moment and axial force, PM, for Column
Section 3, Property Combination 4, and L/D 0.5: (a) e/h 0; (b) e/h 0 ... 204
Figure C.22: Reliability indices for combined moment and axial force, PM, for Column
Section 3, Property Combination 5, and L/D 0.5: (a) e/h 0; (b) e/h 0 ... 205
Figure C.23: Reliability indices for combined moment and axial force, PM, for Column
Section 3, Property Combination 6, and L/D 0.5: (a) e/h 0; (b) e/h 0 ... 206
Figure C.24: Reliability indices for combined moment and axial force, PM, for Column
Section 3, Property Combination 7, and L/D 0.5: (a) e/h 0; (b) e/h 0 ... 207
Figure C.25: Reliability indices for combined moment and axial force, PM, for Column
Section 3, Property Combination 8, and L/D 0.5: (a) e/h 0; (b) e/h 0 ... 208
Figure C.26: Reliability indices for combined moment and axial force, PM, for Column
Section 4, Property Combination 1, and L/D 0.5: (a) e/h 0; (b) e/h 0 ... 209
Figure C.27: Reliability indices for combined moment and axial force, PM, for Column
Section 4, Property Combination 2, and L/D 0.5: (a) e/h 0; (b) e/h 0 ... 210
Figure C.28: Reliability indices for combined moment and axial force, PM, for Column
Section 4, Property Combination 3, and L/D 0.5: (a) e/h 0; (b) e/h 0 ... 211
Figure C.29: Reliability indices for combined moment and axial force, PM, for Column
xx
Figure C.30: Reliability indices for combined moment and axial force, PM, for Column
Section 4, Property Combination 5, and L/D 0.5: (a) e/h 0; (b) e/h 0 ... 213
Figure C.31: Reliability indices for combined moment and axial force, PM, for Column
Section 4, Property Combination 6, and L/D 0.5: (a) e/h 0; (b) e/h 0 ... 214
Figure C.32: Reliability indices for combined moment and axial force, PM, for Column
Section 4, Property Combination 7, and L/D 0.5: (a) e/h 0; (b) e/h 0 ... 215
Figure C.33: Reliability indices for combined moment and axial force, PM, for Column
Section 4, Property Combination 8, and L/D 0.5: (a) e/h 0; (b) e/h 0 ... 216
Figure C.34: Reliability indices for combined moment and axial force, PM, for Column
Section 5, Property Combination 2, and L/D 0.5: (a) e/h 0; (b) e/h 0 ... 217
Figure C.35: Reliability indices for combined moment and axial force, PM, for Column
Section 5, Property Combination 3, and L/D 0.5: (a) e/h 0; (b) e/h 0 ... 218
Figure C.36: Reliability indices for combined moment and axial force, PM, for Column
Section 5, Property Combination 4, and L/D 0.5: (a) e/h 0; (b) e/h 0 ... 219
Figure C.37: Reliability indices for combined moment and axial force, PM, for Column
Section 5, Property Combination 5, and L/D 0.5: (a) e/h 0; (b) e/h 0 ... 220
Figure C.38: Reliability indices for combined moment and axial force, PM, for Column
Section 5, Property Combination 6, and L/D 0.5: (a) e/h 0; (b) e/h 0 ... 221
Figure C.39: Reliability indices for combined moment and axial force, PM, for Column
Section 5, Property Combination 7, and L/D 0.5: (a) e/h 0; (b) e/h 0 ... 222
Figure C.40: Reliability indices for combined moment and axial force, PM, for Column
xxi
Notation
a depth of equivalent rectangular stress block in ACI 318-14
ar depth of equivalent rectangular stress block for partial material strength
reduction factors format
av shear span, equal to distance from center of concentrated load to either: (a) face
of support for continuous or cantilevered members, or (b) center of support for
simply supported members
A area of compression segment of circular section
Ag gross area of section
Ai structural load
As area of nonprestressed longitudinal tension reinforcement
Asi area of the ith layer of reinforcement
Ast total area of nonprestressed longitudinal reinforcement
Av area of shear reinforcement within spacing s
Ay moment of compression segment about center of circular section
b width of compression face of member
bw web width
Bi modeling parameter
c distance from extreme compression fiber to neutral axis
ci influence coefficient
Cc nominal compressive force in concrete
Cij name of strength reduction factor combination
Crc factored compressive force in concrete for partial material strength reduction
factors format
d effective depth, equal to distance from extreme compression fiber to centroid
of longitudinal tension reinforcement
di distance from extreme compression fiber to the ith layer of reinforcement,
where i 1 refers to the reinforcement located furthest
dt distance from extreme compression fiber to extreme layer of tension steel
D effect of service dead load
xxii
ei simulated value of eccentricity
er design eccentricity for partial material strength reduction factors format, equal
to Mr/Pr
erbal eccentricity corresponding to balanced failure for partial material strength
reduction factors format
(erbal)max maximum eccentricity corresponding to balanced failure for partial material strength reduction factors format
(erbal)min minimum eccentricity corresponding to balanced failure for partial material
strength reduction factors format
eu design eccentricity for ACI 318-14, equal to Mn/Pn
eubal eccentricity corresponding to balanced failure for ACI 318-14
(eubal)max maximum eccentricity corresponding to balanced failure for ACI 318-14 (eubal)min minimum eccentricity corresponding to balanced failure for ACI 318-14
Es modulus of elasticity of reinforcement
f() function of resistance or load effect in limit state function
fc specified compressive strength of concrete
fc reduced compressive strength of concrete
fc,i-p in-place compressive strength of concrete
fs stress in reinforcement at service loads
fs reduced stress in reinforcement
fsi stress in the ith layer of reinforcement
fy specified yield strength for nonprestressed reinforcement
fy reduced yield strength for nonprestressed reinforcement
fyt specified yield strength of transverse reinforcement
Fi-p factor to account for variation of in-place strength
Fr factor to account for rate-of-loading effects
Frsi factored force in the ith layer of reinforcement for partial material strength
reduction factors format
Fsi nominal force in the ith layer of reinforcement
xxiii
g() limit state function
G geometric property
h overall thickness, height, or depth of member
l span length of member
L effect of service live load
Li simulated value of live load
M material strength property
Mi simulated value of flexural strength
Mn nominal flexural strength at section
Mr design flexural strength for partial material strength reduction factors format
Mu factored moment at section
n number of samples
P professional factor
Pf probability of failure
Pi simulated value of axial strength
Pn nominal axial strength of member
Pn,max maximum nominal axial compressive strength of member
Pnt nominal axial tensile strength of member
Pr design axial strength for partial material strength reduction factors format
Pr,max maximum design axial compressive strength for partial material strength
reduction factors format
Prt design axial tensile strength for partial material strength reduction factors
format
Pu factored axial force
Q load effect in limit state function, mean Q, standard deviation Q,
coefficient of variation VQ
Qi load effect for the ith type load
QM load effect in limit state function for flexural member
QV load effect in limit state function for member resisting shear force
xxiv
coefficient of variation VR
RM resistance in limit state function for flexural member
RV resistance in limit state function for member resisting shear force
s center-to-center spacing of transverse reinforcement
Sn nominal strength
TD factor to account for transformation from dead load to dead load effect
TDi simulated value of transformation from dead load to dead load effect
TL factor to account for transformation from live load to live load effect
TLi simulated value of transformation from live load to live load effect
U required strength computed using factored load combinations
V coefficient of variation
Vc nominal shear strength provided by concrete
Vn nominal shear strength
Vr design shear strength for partial material strength reduction factors format
Vrc design shear strength provided by concrete for partial material strength
reduction factors format
Vrs design shear strength provided by shear reinforcement for partial material
strength reduction factors format
Vs nominal shear strength provided by shear reinforcement
Vu factored shear force at section
wD specified dead load per unit length
wL specified live load per unit length
Xi resistance or load variable, mean i
X , standard deviation
i X
Xi resistance or load variable at linearizing point
Z ratio of strain in extreme tension layer of reinforcement to yield strain
Z limit state function, mean Z, standard deviation Z
M design flexural strength ratio, equal to design flexural strength obtained using
strength reduction factors in ACI 318-14 to that obtained using partial material
strength reduction factors
PM design combined flexural and axial strength ratio, equal to design combined
xxv
V design shear strength ratio, equal to design shear strength obtained using
strength reduction factors in ACI 318-14 to that obtained using partial material
strength reduction factors
reliability index
M reliability index for moment
Mr reliability index for moment obtained using partial material strength reduction
factors
Mu reliability index for moment obtained using strength reduction factors in ACI
318-14
PM reliability index for combined moment and axial force
PMr reliability index for combined moment and axial force obtained using partial
material strength reduction factors
PMu reliability index for combined moment and axial force obtained using strength
reduction factors in ACI 318-14
V reliability index for shear
Vr reliability index for shear obtained using partial material strength reduction
factors
Vu reliability index for shear obtained using strength reduction factors in ACI
318-14
1 factor relating depth of equivalent rectangular compressive stress block to
depth of neutral axis
ratio of distance between outer layers of reinforcement in column to overall column depth
bias coefficient
cu maximum usable strain at extreme concrete compression fiber
si strain in the ith layer of reinforcement, where i 1 refers to the reinforcement
located furthest from extreme compression fiber
t net tensile strain in extreme layer of longitudinal tension reinforcement at
nominal strength
xxvi
y
angle used to calculate compression segment of circular column
modification factor to account for reduced shear strength of lightweight concrete
longitudinal reinforcement ratio, equal to ratio of As to bd
g total reinforcement ratio, equal to ratio of total longitudinal reinforcement area
to cross-sectional area of column
t transverse reinforcement ratio, equal to ratio of area of distributed transverse
reinforcement to gross concrete area perpendicular to that reinforcement
standard deviation
strength reduction factor in ACI 318-14
c partial material strength reduction factor for concrete
s partial material strength reduction factor for reinforcing steel Mn design flexural strength in ACI 318-14
Pn design axial strength in ACI 318-14
Pn,max maximum design axial compressive strength in ACI 318-14
Pnt design axial tensile strength in ACI 318-14
Vn design shear strength in ACI 318-14
Chapter 1
1
Introduction
1.1 Introduction
In the current Building Code Requirements for Structural Concrete (ACI 318-14) and
Commentary (ACI 318R-14) (ACI Committee 318 2014), the basic requirement for
strength design is
n
S U
[1.1]
where: is the strength reduction factor; Sn is the nominal strength; and, U is the required
strength computed using the factored load combinations. The overall strength reduction
factor, , accounts for “the probability of understrength due to variations of in-place
material strengths and dimensions, the effect of simplifying assumptions in the design
equations, the degree of ductility, potential failure mode of the member, the required
reliability, and significance of failure and existence of alternative load paths for the
member in the structure” (ACI Committee 318 2014).
For members resisting moment, axial force, combined moment and axial force, or shear,
Table 1.1 shows strength reduction factors, , defined in Chapter 21 of ACI 318-14. The
strength reduction factor for shear equals 0.75, while for moment, axial force, or
combined moment and axial force, the strength reduction factor ranges from 0.65 to 0.90.
The additional requirements shown in Table 1.2, which is identical to Table 21.2.2 in
ACI 318-14, need to be applied to determine the exact value for a specific combination of
moment and axial force for spirally reinforced or tied columns. The strength reduction
factor in these cases depends on the net tensile strain in the extreme layer of longitudinal
reinforcement, t, which is determined assuming a linear strain distribution and a strain in
the extreme compression fiber of 0.003 at nominal strength. This is shown in Figure 1.1,
which is identical to Fig. R21.2.2a in ACI 318R-14. If t is greater than or equal to 0.005,
the section is defined as tension-controlled, or if it is less than or equal to ty, the section
reinforcement, equal to fy/Es for deformed reinforcement, fy is the specified yield strength
for nonprestressed reinforcement, and Es is the modulus of elasticity of reinforcement.
Between the two limits of 0.005 and ty, a transition occurs between the strength
reduction factor for moment for lightly reinforced sections, 0.90, and that for axial force
combined with moment, 0.65 or 0.75 for tied or spirally reinforced columns, respectively.
This is shown in Figure 1.2, which is identical to Fig. R21.2.2b in ACI 318R-14.
The overall strength reduction factor presented in ACI 318-14, , has some shortcomings
that have been identified by others, as follows:
1. For a member subjected to combined moment and axial force, an odd variation
happens within the transition region (e.g., Gamble 1998, 2015). Figure 1.3, which is
similar to figures generated by Gamble (2015) shows the interaction diagrams for a
325 mm square column with eight bars distributed equally in four faces. The ratio of
the distance between the outer layers of reinforcement in a column to the overall
column depth, , is 0.6 and the ratio of total reinforcement area to the cross-sectional
area of column, g, is 0.01. The specified compressive strength of concrete, fc, and fy
are 25 MPa and 420 MPa, respectively. The interaction diagram derived using the
strength reduction factors in ACI 318-14 shows an inconsistency in the transition
region compared to the nominal strength interaction diagram. If partial material
strength reduction factors are applied, e.g. fc 0.6fc and fy 0.9fy (fs 0.9fs)
recommended by Gamble (2015), the inconsistency disappears, where fc is the
reduced compressive strength of concrete, fy is the reduced yield strength for
nonprestressed reinforcement, fs is the stress in reinforcement at service loads, and fs
is the reduced stress in reinforcement.
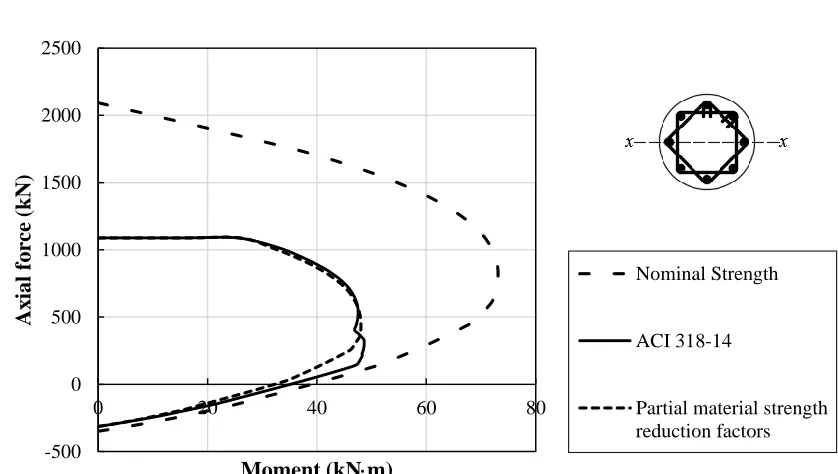
Similarly, Figure 1.4 is generated for a 325 mm diameter circular column with eight
evenly distributed bars and ties. Similar to the square column, the current ACI 318-14
strength reduction factors create an awkward transition that is eliminated when the
2. Figure 1.5, originally created by Lequesne and Pincheira (2014), shows the design
interaction diagram obtained using ACI 318-11 strength reduction factors which are
identical to those for ACI 318-14, for an L-shaped wall section. In this case and for
other sections with wide flanges, the results are again unreasonable: on the right side
of point B, the flexural and axial strengths increase simultaneously with the
increasing eccentricity when the compression zone stress block extends into the web
and tyt 0.005. The reason for the increasing design axial strength, Pn, with the
increasing eccentricity is that increases at a proportionally higher rate than the
nominal axial strength, Pn, decreases. This results in non-unique moment capacities
for one axial strength level between points A and B as shown (Lequesne and
Pincheira 2014).
3. For members subjected to shear, the statistical parameters for professional factor have
significant changed. The professional factor is defined as a value observed
experimentally divided by the value predicted using the actual geometric and material
properties and so quantities the accuracy of an equation for resistance. For example,
the bias coefficient and coefficient of variation of the professional factor reported by
Somo and Hong (2006) are equal to 1.47 and 0.36, respectively, for beams with
stirrups and shear span-to-depth ratio larger than or equal to 2. In the original
calibration of the ACI strength reduction factors, values of 1.09 and 0.12 were
adopted by Israel et al. (1987). Similar values of 1.075 and 0.10 were recommended
by Nowak and Szerszen (2003). These changes may significantly affect the
reliability, so the strength reduction factor needs to be reevaluated. Specifically the
higher bias coefficient reported by Somo and Hong (2006) will increase the reliability
and so permit use of a greater strength reduction factor. The higher coefficient of
variation, however, has the opposite effect.
4. A single overall value of cannot clarify the contributions of concrete and
reinforcing steel, and variabilities of their strengths, so partial material strength
It is noteworthy that Canadian Standard CSA-A23.3 “Design of Concrete Structures”
(CSA 2014) has used partial resistance factors for the concrete and steel material
strengths since 1984.
1.2 Objective
The objective of this study is to select partial material strength reduction factors for
concrete and reinforcing steel that yield similar design strengths to those obtained using
the current ACI 318-14 provisions. Similarly, the reliability indices corresponding to the
proposed strength reduction factors should be similar to or more appropriate than those
corresponding to the current provisions.
Three structural actions acting on nonprestressed members shall be investigated: moment;
one-way shear; and, combined moment and axial force. For members subjected to
moment, the full range of flexural reinforcement ratios, corresponding to those in
two-way slabs, one-two-way slabs and beams shall be investigated. Similarly, for members
subjected to one-way shear, a realistic range of shear reinforcement ratios shall be
investigated. For members subjected to combined moment and axial force, realistic total
reinforcement ratios and reinforcement arrangements in the cross sections shall be
investigated. Design strengths will be compared based on the current and partial material
strength reduction factors. Statistical parameters related to the reliability index
calculation will be collected from the literature. The first-order, second-moment (FOSM)
reliability analysis method will be applied for members subjected to moment or shear.
Monte Carlo simulation will be used to determine the reliability of members subjected to
combined moment and axial force because of the complexity of the equations necessary
to generate interaction diagrams.
1.3 Outline
In Chapter 2, potential partial material strength reduction factors that yield similar design
strengths as the current ACI 318-14 provisions are investigated. For members subjected
to moment, the design strengths of singly reinforced two-way slabs, one-way slabs and
are calculated for different concrete compressive strengths, fc, and ratios of
nonprestressed longitudinal tension reinforcement, . For members subjected to one-way
shear, the design strengths of beams with different transverse reinforcement ratios, t, and fc are studied. For members subjected to combined moment and axial force, five column
sections are investigated: square section with three bars in each face; square section with
three bars in two end faces only; square section with three bars in two side faces only;
circular section with eight evenly distributed bars and ties; and, circular section with eight
evenly distributed bars and spiral reinforcement. For each column section, different , fc,
and g are studied. For each structural action, appropriate partial material strength
reduction factors are proposed.
Chapter 3 presents the reliability model and the first-order, second-moment (FOSM)
method. It then summarizes statistical parameters for geometric properties, material
strengths, professional factors and load effects collected from the literature. The
calculated reliability indices for members subjected to moment or one-way shear are
presented for the different geometric and material properties, and two live-to-dead load
ratios. Partial material strength reduction factors are then proposed based on the
reliability analyses and the results obtained in Chapter 2.
Chapter 4 presents the reliability analyses for columns conducted by Monte Carlo
simulation. Different geometric and material properties, and two live-to-dead load ratios
are investigated. The applied moment and axial force are assumed perfectly correlated
and reliability indices are computed for a range of specific eccentricities. Again,
appropriate partial material strength reduction factors are proposed based on the
reliability analyses and the results obtained in Chapter 2.
Chapter 5 presents the summary, conclusions, and suggestions for future work.
Appendices A, B and C present supplementary tables, figures and Matlab (Version
R2016b; The Mathworks, Inc. 2016) codes that complement the material presented in
Table 1.1: Strength reduction factors, , in ACI 318-14
Action or structural element
Moment, axial force, or
combined moment and axial force 0.65 to 0.90
Shear 0.75
Table 1.2: Strength reduction factors, , for moment, axial force, or combined moment
and axial force, in ACI 318-14
Type of transverse reinforcement
Net tensile strain t Classification Spiral Other
t ty
Compression-controlled 0.75 0.65
0.005
ty t
Transition
0.75 0.15 0.005
t ty
ty
0.65 0.25 0.005
t ty
ty
0.005
t
Tension-
Figure 1.1: Strain distribution and net tensile strain in a nonprestressed member (ACI
Committee 318 2014)
Figure 1.2: Variation of with net tensile strain in extreme tension reinforcement, t
Figure 1.3: Interaction diagrams for a square column
Figure 1.4: Interaction diagrams for a circular tied column
-1000 -500 0 500 1000 1500 2000 2500 3000
0 50 100 150
A
x
ial
f
orc
e
(kN
)
Moment (kNm)
Nominal Strength
ACI 318-14
Partial material strength reduction factors
-500 0 500 1000 1500 2000 2500
0 20 40 60 80
A
x
ial
f
orc
e
(kN
)
Moment (kNm)
Nominal Strength
ACI 318-14
Chapter 2
2
Derivation of Partial Material Strength Reduction
Factors Based on Design Strengths
2.1 Introduction
Chapter 21 of Building Code Requirements for Structural Concrete (ACI 318-14) and
Commentary (ACI 318R-14) (ACI Committee 318 2014) specifies an overall strength
reduction factor, , for reinforced concrete elements, based on the structural action being
resisted. The overall objective of this thesis is to propose partial material strength
reduction factors for concrete and reinforcing steel that are independent of the structural
action.
The objective of this chapter is to identify suitable partial material strength reduction
factors that best duplicate the design strengths obtained using the current ACI 318-14
provisions. The preliminary results obtained in this chapter indicate the potential ranges
of the best partial material strength reduction factors, and the final decision will be made
after conducting reliability analyses presented in Chapters 3 and 4.
2.2 Methodology
This chapter develops partial material strength reduction factors for cross sections
resisting three structural actions: moment; one-way shear; and, combined moment and
axial force. For each action, design strengths are computed using ACI 318-14 and various
partial material strength reduction factors, c for concrete and s for reinforcing steel.
Table 2.1 shows the sixteen partial material strength reduction factor combinations
considered in this study. The Cij notation shown represents a particular combination,
where i is the i-th value of s and j is the j-th value of c.
The calculations are conducted using Microsoft Excel (Version 2013; Microsoft 2013)
and Matlab (Version R2016b; The Mathworks, Inc. 2016) to compute the design strength
ratio, which is defined as the design strength obtained using the strength reduction factor
reduction factors. Design strength ratios greater than 1 represent cases where the ACI
318-14 design strengths exceed those computed using the proposed values, and so
indicate that the proposed values are more conservative. For this investigation, the best
combination of partial material strength reduction factors will give design strengths that
most closely approximate those obtained using the current ACI 318-14 provisions. This
corresponds to the mean design strength ratio approaching 1 with the least standard
deviation. Reliability analyses based on these preliminary results will be presented in
Chapters 3 and 4.
2.3 Moment
This section presents proposed partial material strength reduction factors that most
closely approximate the design flexural strengths obtained using the ACI 318-14 criteria.
The ranges of geometric and material parameters are quantified and the design flexural
strength equations corresponding to the current ACI 318-14 and the partial material
strength reduction factors formats are presented. Typical design flexural strength ratios,
M, for each combination of partial material strength reduction factors are presented, and
the means and standard deviations for each combination are quantified. The sensitivities
of the design flexural strength ratios to the partial material strength reduction factors, for
various geometric and material properties are investigated. The best factor combinations
are recommended.
2.3.1
Geometric and Material Properties
The investigation of moment is limited to rectangular singly reinforced cross sections
designed based on ACI 318-14 with a specified reinforcement yield strength, fy,of 420
MPa and specified concrete compressive strengths, fc, of 25 and 45 MPa. These material
strengths represent the range of strengths commonly used in flexural members. Three
ranges of reinforcement ratio are investigated: 0.003 to 0.005, which is representative of
two-way slabs; 0.006 to 0.010, which is representative of one-way slabs; and, 0.011 to
0.018, which is representative of beams. The reasons for selecting these three ranges are:
they reflect typical reinforcement ratio ranges for slabs and beams; minimum and
the studied range of beams is defined by the maximum reinforcement ratio for a beam
with fcof 25 MPa. The same maximum reinforcement ratio is used for beams with fc of
45 MPa. One layer of reinforcing steel is assumed.
2.3.2
Design Strength Ratios
Design flexural strength equations corresponding to the current ACI 318-14 and partial
material strength reduction factors formats are defined in this section. The equations and
definitions below refer to ACI 318-14, MacGregor and Bartlett (2000), and Wight
(2016).
In ACI 318-14, the depth of the equivalent rectangular stress block, a, is computed as
(Wight 2016)
0.85
s y
c
A f a
f 'b
[2.1]
where: As is the area of the nonprestressed longitudinal tension reinforcement; fy is the
specified yield strength for nonprestressed reinforcement; fc is the specified compressive
strength of concrete; and, b is the width of the compression face of the member. The
design flexural strength, Mn, is (Wight 2016)
2
n s y
a
M A f d
[2.2]
where: is the strength reduction factor in ACI 318-14; Mn is the nominal flexural
strength at a section; and, d is the distance from the extreme compression fiber to the
centroid of the longitudinal tension reinforcement.
For the proposed method, the depth of the equivalent rectangular stress block, ar, based
on the partial material strength reduction factors format presented in MacGregor and
Bartlett (2000), is assumed to be
0.85
s s y
r
c c
A f a
f 'b
where: s is the strength reduction factor for reinforcing steel; and, c is the strength
reduction factor for concrete. The design flexural strength for partial material strength
reduction factors method, Mr, is (MacGregor and Bartlett 2000)
2
r
r s s y
a
M A f d
[2.4]
For the longitudinal reinforcement ratio, , defined as (ACI Committee 318 2014)
s
A bd
[2.5]
the design flexural strength ratio, M, is
1 1.7 1 1.7 y c n M y r s s c c f f ' M f M f ' [2.6]
For each strength reduction factor combination, design flexural strength ratios, M, were
calculated with respect to longitudinal reinforcement ratios, . Also, each calculation was
done twice because two specified compressive strengths of concrete, fc, were studied. In
particular, for fc of 25 MPa, the strength reduction factors in ACI 318-14, , are not
always equal to 0.90 in the range of reinforcement ratios studied, e.g., is equal to 0.86
for of 0.017 and is equal to 0.83 for of 0.018. As mentioned in Chapter 1, when the
section is tension-controlled, i.e. the net tensile strain in the extreme layer of longitudinal
tension reinforcement at nominal strength, t, is larger than or equal to 0.005, is equal to
0.90. Moreover, less than 0.90 implies that t is less than 0.005, but at least 0.004
(minimum requirement, used to control the upper limit of longitudinal reinforcement
ratio) and the section is in the transition region between the tension-controlled and
compression-controlled regions (ACI Committee 318 2014). The equation to compute the
net tensile strain in the extreme layer of longitudinal tension reinforcement at nominal