A Systematic Approach for Classification of
Knee Osteoarthritis Using PNN Algorithm
Chennuboina Sowjanya1
M. Tech (Communication Engineering & Signal Processing), Department of ECE, VR Siddhartha Engineering College,
Vijayawada, Andhra Pradesh, India.
ABSTRACT: Osteoarthritis (OA) is a type of arthritis generally influences the cartilagethat covers the bones. The effect of OA tends to break the cartilage layer thatrub the bones causing pain, swelling and loss of movements. The proposed method uses the knee x-ray images of the effected person and detects the severity of osteoarthritis.The data base consist 25 images of various persons. TheTemplate matching method is used to identify the region of interest (ROI). TheSobel operator is used to detect the knee joint edges.The gap between the femur and tibia is identified at 7 different locations and the grades are assigned according to the severity of OA. The data points of the images are applied to the Probabilistic Neural Network (PNN) classifiers. The PNN classifier classifies the image data with a kappa value of 0.459 and classification based on KL grades for 5 (normal, doubtful, minimal, moderate, sever) accuracyis 58.3%.
KEYWORDS: Osteoarthritis (OA), X-ray, Templatematching, Edge detection, Probabilistic Neural Network (PNN)
I. INTRODUCTION
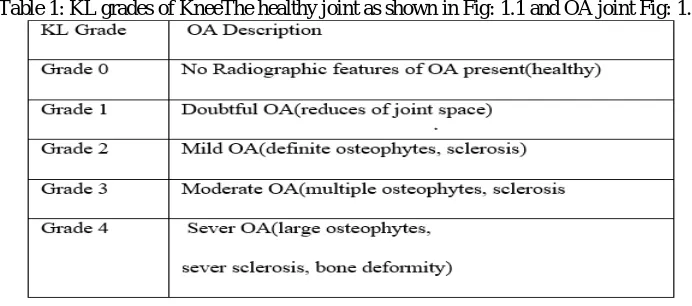
Osteoarthritis (OA) is a long-lasting, widespread and degenerative disease in India and Worldwide that affects 80% of the population above the age group of 45 years [1]. The latest report reveals that knee OA is likely to become the Fourth most common in women and eight most common in men. If OA occurs at the knee joint the space between two joints narrows drastically [2] andthe surface layer of the ligaments break and wears away. Synovial fluid is present between the femur and tibia. This broken ligaments floating on the synovial fluid then it starts paining. The edges of the joint bony growth is called Osteophytes are sclerosis. Some normal causes that can prompts the improvement of OA are age related ligament degeneration [3][4], hereditary[5],[6], injury, past proactive conditions, weakness [7],[8] and vascular changes [9]. Most commonly OA can be observed at the knee joint. In rural areas OA signs are most common than in urban and suburban population [10]. Due to the obesity and getting older Osteoarthritis may occur. So many methods are proposed but Kellgren –Lawrence algorithm is gold standard validation method grades depends on severity of the knee joint of 5 grades are Normal, Doubtful, Minimal, Moderate, Sever of OA joints as shown below in table 1
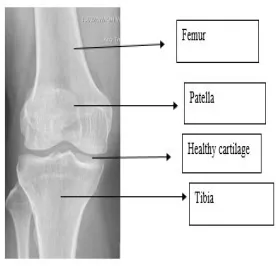
Fig 1.1: Healthy knee joint Fig 1.2: Osteoarthritis joint
The main goal of this paper is to detect a method for the analysis of Osteoarthritis of knee joint. This paper consists of 5 Sections. In section-1 describes the Introduction of Knee Osteoarthritis, Section-2 various works done on Knee Osteoarthritis, Section-3 tells about various techniques used to detect the Osteoarthritis of knee, Section-4 shows Experimental Results and analysis, Section-5 consist of conclusion and future scope.
II. RELATED WORK
From the past few decades X-ray images are very helpful for finding cracked bones, cancer bones, mostly in all types of bones by this examination. We can identify different diseases that shows which is impossible for naked eye. Because of its complexity, knee joint image segmentation became a crucial task. So many researches and work can be done and still the process is going on. Image segmentation take an active role in Medical imaging application. As per the Literature survey.Lior Shamir et al used Image analysis method for Automatic detection of OA. Feature extraction algorithms like Zernike feature, multistate histograms, first four moments, Tamara texture features, etc are calculated. Classification can be done by using Nearest Neighbour rule feature. The authors concluded that different stages of OA and its accuracy are for moderate OA was 95% and distinguish from normal OA and 80% of minimal OA was distinguish from normal OA.Tat1 L. Mengko et al: In this papermachine vision method is used to perform unimpaired joint space. Pre-processing is used for contrast stretching, and in Image rough rotation they derived angle parameter for rotation using linear regression of the resulting binary image. By determining the arrays local minima position of the joint space can be calculated. In the image fine translation method here the image smoothing using Gaussian function and convolving the image with first order Gaussian function and then use edge detection method for detection of edge and ROI detection is used to find the osteophytes. Feature extraction classification can be done by using neural networks.
III. METHODOLOGY
This methodology consists of Data set, region of Interest, template matching, edge detection, and calculation of knee distances.
3.1 Data set:
Database is attained with the help of reference paper total 25 normal subjects.
3.2 Region of interest detection:
3.3 Template matching method
Template Matching is a method used to identify the knee joint.Template matching is a method used for the identification of the region of interest that matches (or comparative) the template image (fix). For template matching first select an original image that can be converted from RGB to grey scale and given to the cropped image and the full image scanning process starts from block by block throughout the image and then apply correlation to theoriginal image and cropped image and after correlation the region of interest is shown in a rectangular box using boxing properties.
Cross–Correlation and normalized correlation are the types in image correlation technique in a template matching method.
a.Cross-Correlation:
Cross Correlation refers to the complete correlation between the two images i,e the template image(ROI) and original image.
Cross-Correlation of two images (image1, image2)=∑image1 x, y×x,y image2 x,y
Here we have taken two pixels i.e image1 refers to full image and image2as theROI image and their pixel arranges x and y.By this correlation of two images where the knee joint is present it shows the peak value of an image as shown in Fig: 3.3
b. Normalized Cross-Correlation:In NCC, face recognition and template matching technique is used.First image can be normalized and due to lighting and exposure conditions the template image may vary theirmean and standard deviation that could be applied to the image. In NormalizedCrossCorrelation NCC(image1,image2)=1/ 1 2 ∑ , [( 1( , )− 1) × ( 2( , )− 2)]
Where
Two images1 and image2 and u, v are pixel coordinates and is some constant [11]. By using Surf function the similarity can be shown in a graph in Fig: 3.4.
3.4 Edge detection:
Edge detection is used to identify the sharp discontinuities of an image without noise. In Edge detection method Sobel operator is used. Because Sobel operator method shows fine edge in all stages of knee joint then canny, prewitt, Log, as shown in Fig 3.5 and then apply histograms to these edge detection method as shown in Fig:3.6
3.5 Knee Distance Calculation:
Osteophytes or sclerosis is formed in between the femur and tibia edges of the bone. It is used for finding the knee joint space detection process not for grading schemes.
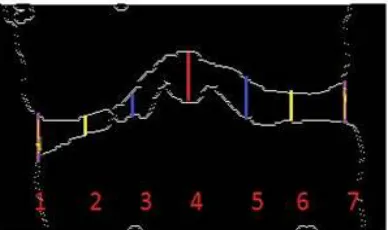
In the knee joint imagetotal 7 symmetrical point are be taken from that 1st point is symmetric to the 7th point and 2nd point is symmetric to the 6th point like that we can take as shown in Fig 3.7
After taking those points consider femur edge of the bone value as point X1and tibia edge of the joint bone can be taken as point X2. When the point X2 is subtracted from point X1 then the distance value is obtained. This value can be taken as knee space. [12]
3.6 Assigning Grades and stage detection of the knee joint:
In this step knee area can be calculated by using binarization method. Image having two pixel either black (0) or white (1). For that we can calculate pixel values of knee space
Pixels = Width (W)*Height (H).[13][14]
In this width is 1 unit for one point and Height is as shown above Where, 1 Pixel = 0.264mm
The area calculation formula is
Size of knee joint is, S = [pixel*0.264] mm mm = milli meter
IV. CLASSIFICATION
Classification is the separation of two classes. Here we are using two classifiers SVM and Probabilistic Neural Network. SVM abbreviated as Support vector machine it is machine learning system that use a hypothesis space of linear function in a hyperspace [15] SVM is used for single stage classification. Firstly data can be given to the training data and then enter into the testing data the combination of both is given to the SVM classifier. Probabilistic Neural Network (PNN) is a feed forward neural network that’s widely used in classification and pattern recognition problem [16]. It is used for multi-stage classification.
V. RESULT
For the result analysis a total 25 x-ray images are examined and tested based on the assigned spaces. Classification can be done by using Probabilistic Neural Network (PNN)is employed for 5 stage classification and its accuracy is 58.3%.
1) Knee joint area is cropped.
Fig -3.1: Region of interest image
2) By using Template matching method
3) For Cross –Correlation and normalized cross correlation the output graph shows as below
Fig-3.3: Cross correlation Fig -3.4: Normalized cross correlation
4) In Edge detection horizontal mask is used in Sobel operatormethod.
Fig -3.5: Sobel edge detection Fig- 3.6: Histogram image
6) Grades can be assigned to the knee joint space as shown in table 2.
7) The values are assigned to SVM for its classification accuracy is 36% so we go to Probabilistic Neural Network for multistage classification
Kappa value is 0.459 and itsAccuracy is 56%
In case of less amount of data in multistage classification PNN suits better than SVM
Table 2: Knee joint Spaces and its grade
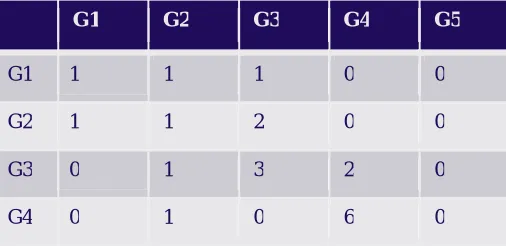
Table 3: Confusion Matrix for PNN
G1 G2 G3 G4 G5
G1 1 1 1 0 0
G2 1 1 2 0 0
G3 0 1 3 2 0
Where G1, G2, G3, G4, G5 are grades
VI. CONCLUSION
Our paper is used to detect the severity of Osteoarthritis. For doctors examination of x-ray is difficult to find the disease present in 1 stage or 2 stage because mild difference and no symptoms of pain. By this paper we can detect the disease and find OA in which stage by using knee distance calculation method. Classification accuracy of PNN accuracy is 58%.
REFERENCES
[1] G. Blumenkrantz, C. T. Lindsey, T. C. Dunn, H. Jin, M. D. Ries, T. M. Link ,L. S. Steinbach, and S. Majumdar. “A pilot, two-year longitudinal study of the interrelationship between trabecular bone and articular cartilage in the osteoarthritic knee. Osteoarthritis and Cartilage,” vol 12(12):997–1005, December 2004.
[2] Ismail Anas, Tabari Abdulkdir Musa Isyaku Kabiru ,Abdulkadir Adekunle Yisau , Idris Sulaiman Kazaure ,Suwaid Muhammad Abba , Saleh Muhammad Kabir “Digital radiographic measurement of normal kneejoint space in adults at Kano, Nigeria” Received 2 April 2012; accepted 27 March 2013Available online 15 April 2013 0378-603X _ 2013 Production and hosting by Elsevier B.V. on behalf of Egyptian Society of Radiology and Nuclear Medicine
[3] P. D. Byers, F. T. Hoaglund, G. S. Purewal and A. C. Yau, "Articular cartilage changes in Caucasian and Asian hip joints," Ann rheum
Dis, vol. 33, no. 2, pp. 157-161, 1974.
[4] M. V. Foss and P. D. Byers, "Bone density, osteoarthrosis of the hip, and fracture of the upper end of the femur," Ann Rheum Dis, vol. 31, no. 4, pp. 259-264, 1972.
[5] J. H. Kellgren, J. S. Lawrence and F. Bier, "Genetic factors in generalized osteoarthrosis," Ann Rheum Dis, vol. 22, pp. 237-255, 1963. [6] R. G. Knowlton, E. J. Weaver, A. F. Struyk, W. H. Knobloch and R. A. N. K. e. a. King, "Genetic linkage analysis of hereditary
arthro-ophthalmopathy (Stickler syndrome) and the type II procollagen gene," Am J Hum Genet, vol. 45, no. 5, pp. 681-688, 1989.
[7] S. C. O’Reilly, A. Jones, K. R. Muir and M. Doherty, "Quadriceps weakness in knee osteoarthritis: the effect on pain and disability," Ann Rheum Dis, vol. 57, p. 588–594, 1998.
[8] M. D. Lewek, K. S. Rudolph and L. Snyder-Mackler, "Quadriceps Femoris muscle weakness and activation failure in patients with symptomatic knee osteoarthritis," J Orthop Res, vol. 22, no. 1, p. 110–115, 2004.
[9] M. H. Harrison, F. Schajowicz and J. Trueta, "Osteoarthrits of the hip: a study of the nature and evolution of the disease," J Bone Joint Surj Br, vol. 35, pp. 598-626, 1953.
[10] A. A. Andrianakos, L. K. Knotless, D. G. Karamitsos, S. I. Aslanidis, A. I. Georgountzos and G. O. e. a. Kaziolas, "ESORDIG Study Group. Prevalence of symptomatic knee, hand, and hip osteoarthritis in Greece," The ESORDIG study.J Rheumatology, vol. 33, no. 12, pp. 2507-2513, 2006
11) Paridhi Swaroop “An Overview of Various Template Matching Methodologies in Image Processing” International Journal of Computer Applications (0975 – 8887) Volume 153 – No 10, November 2016 12) ','Tat1 L. Mengko, 'Rachmat G. Wachjudi, '.'Andriyan B. Suksmono, 'Qonny Danudirdjo Automated Detection of Unimpaired Joint Space 0-7803 -8940-9/05/$20.O0 02005 IEEE.for Knee Osteoarthritis Assessment
[13] Sunil Bangare, madhura patil,pallavi st bangare, s.t. patil patil “Implementing Tumor Detection and Area Calculation in Mri Image of Human Brain Using Image Processing Techniques” Int. Journal of Engineering Research and Applications www.ijera.com
ISSN : 2248-9622, Vol. 5, Issue 4, ( Part -6) April 2015, pp.60-65 [14] https://www.translatorscafe.com/u - converter/en/typography/7-4/
[15] Maneela Jain Pushpendra Singh Tomar Lnct, Bhopal, Lnct, Bhopal,“Review of Image Classification Methods and Techniques” International Journal of Engineering Research & Technology (IJERT)
Vol. 2 Issue 8, August – 2013 ISSN: 2278-0181
[16] Yasha Zeinali and Brett A. Story”Competitive probabilistic neural network Integrated Computer-Aided” Engineering -1 (2017) 1–14 1DOI 10.3233/ICA-170540IOS Press
G5 0 0 0 3 0