© 2020, IJCSMC All Rights Reserved 107
Available Online atwww.ijcsmc.com
International Journal of Computer Science and Mobile Computing
A Monthly Journal of Computer Science and Information Technology
ISSN 2320–088X
IMPACT FACTOR: 6.199
IJCSMC, Vol. 9, Issue. 1, January 2020, pg.107 – 115
Customers Churn Prediction Model Comprising
of Clustering and Classification: An Application
of Improvised Kmeans Clustering Algorithm
and Non Linear Support Vector Machine
Anuradha; Shaveta Kalsi
Research Scholar, Computer Science and Engineering, DAV Institute of Engineering and Technology, Jalandhar,
Punjab 144022, India, [email protected]
Assistant Professor, Computer Science and Engineering, DAV Institute of Engineering and Technology, Jalandhar,
Punjab 144022, India, [email protected]
Abstract-Customer churn is a significant issue that is regularly related with the existence cycle of the business. At the point when the business is in a development period of its life cycle, deals are expanding exponentially and the quantity of new clients to a great extent dwarfs the quantity of churners. On the other side, organizations in a develop period of in their life cycle, set their attention on lessening the rate of customer churn. This research work proposes an efficient computational intelligence model comprising of clustering achieved through improvised K-Means algorithm and classification achieved through Non Linear Support Vector Machine.
Keywords–data mining, customer churn, clustering, k-means, classification, non-linear support vector machine.
I. INTRODUCTION
Data mining is the computing process of discovering patterns in large data sets involving methods at the intersection of machine learning, statistics, and database systems. It is an essential process where intelligent methods are applied to extract data patterns. Data mining is the analysis step of the "knowledge discovery in databases" process. The knowledge discovery in databases (KDD) process is commonly defined with the stages are Selection, Pre-processing, Transformation, Data mining and Interpretation/evaluation. Before data mining algorithms can be used, a target data set must be assembled. As data mining can only uncover patterns actually present in the data, the target data set must be large enough to contain these patterns while remaining concise enough to be mined within an acceptable time.
© 2020, IJCSMC All Rights Reserved 108
interpersonal organization examination, web based gaming, banking part, and media transmission area, are always concentrating on setting up and keeping up the long haul associations with their current clients. Faithful clients can be viewed as long haul clients that are gainful for the organization as well as are extraordinary representatives in the market [1].
Churn prediction procedure is an exceedingly discussed research zone for over ten years. Specialists from various controls have attempted to dissect this issue from their very own points of view to make sense of a reasonable comprehension and to prescribe a successful answer for churners in numerous business zones. Churn prediction is a valuable device to anticipate client at stir hazard. Customary beat forecast strategies have the benefit of being basic and strong as for deformities in the information, they have genuine constraints to the elucidation of purposes behind stir. In this way, estimating the adequacy of an expectation model depends likewise on how well the outcomes can be translated for construing the potential reasons of churn [2]. The reason for forecast is to envision the worth that an irregular variable will expect later on or to evaluate the probability of future occasions. Most DM methods get their expectations from the estimation of a lot of factors related with the substances in a database. DM models might be utilized to anticipate client stir created in numerous controls, for example, statistic information or potentially conduct information. There are numerous DM procedures that can be utilized in characterization and bunching client information to foresee churners sooner rather than later. These techniques may use Decision Tree (DT), Support Vector Machine (SVM) in addition to Neural Networks (NN), Genetic Algorithms (GA) or Fuzzy Logic (FL) to predict churners [2].
Types of Churners
As figure 1 shows; There are two principle classes of churners which are voluntary and involuntary. Involuntary churners are the simplest to distinguish. These are the clients that Telco chooses to expel from the endorsers list. Subsequently' this classification incorporates individuals that are stirred for misrepresentation, non-installment, and clients who don't utilize the telephone. Voluntary churner is increasingly hard to decide; it happens when a client settles on a choice to end his/her administration with the supplier. At the point when individuals consider Telco stir it is generally the voluntary kind that comes to mind.
Figure 1: churn taxonomy [2]
Voluntary churn can be sub-separated into two fundamental classes, incidental churn and deliberate churn. Incidental churn happens, not on the grounds that the clients anticipated it but rather on the grounds that something occurred in their lives. For instance: change in budgetary condition beat, change in area agitates, and so forth. Purposeful beat occurs for reasons of innovation (clients needing more current or better innovation), financial aspects (value affectability), administration quality components, social or mental elements, and accommodation reasons. Deliberate churn is the issue that most stir the executive arrangements attempt to tackle [2].
II. BACKGROUND
Amina et al. displayed a novel CCP approach dependent on the above idea of classifier's conviction estimation utilizing separation factor. The dataset is assembled into various zones dependent on the separation factor which are then isolated into two classifications as; (I) information with high sureness, and (ii) information with low assurance, for foreseeing clients displaying Churn and Non-beat conduct. Utilizing diverse cutting edge assessment measures (e.g., exactness, fmeasure, exactness and review) on various freely accessible the Telecommunication Industry (TCI) datasets demonstrate that (I) the separation factor is firmly co-related with the assurance of the classifier, and (ii) the classifier got high precision in the zone with more prominent separation factor's worth (i.e., client agitate and non-beat with high sureness) than those put in the zone with littler separation factor's worth (i.e., client stir and nonchurn with low conviction) [1].
© 2020, IJCSMC All Rights Reserved 109
informal organization in the expectation model by removing Social Network Analysis (SNA) highlights. The utilization of SNA improved the exhibition of the model from 84 to 93.3% against AUC standard. The model was arranged and tried through Spark condition by taking a shot at an enormous dataset made by changing huge crude information given by SyriaTel telecom organization [2].
Xiao et al. has clarified agitate forecast displaying, illustrating, the path toward selecting imprints to customers is extravagant and dull, and along these lines there are more unlabelled than named tests. To deal with this issue, this examination joins semi regulated learning, cost-sensitive learning procedure Metacost with troupe methodology self-assertive subspace to propose a semi-oversaw gathering model reliant on Metacost. This model joins the going with three stages: (1) use the Metacost method to adjust the class name of the hidden stamped getting ready set to secure another readiness set; (2) name the unlabelled models explicitly; (3) train a couple of fundamental classifiers with the last planning set and use them to gather the models in the test set. The precise results for two customer mix figure enlightening files display that the proposed model raises customer shake desire execution differentiated and by and large used coordinated assembling and semi regulated models [3].
Veglio et al. have proposed non linear Support vector machines that classify linear as well as non linear input from market data set with the help of radial basis kernel function. It shows best prediction when compared to other classifiers results such as logistic regression, multilayer perceptron neural network and support vector machine with linear kernel function [4].
Huang et al. took into account evaluating the performance of Exhaustive Algorithm and Genetic Algorithm for churn prediction. Results show that Genetic Algorithm is the most efficient technique. Genetic algorithm will take two fit individuals and mate them (a process called crossover). The offspring of the mated pair will receive some of the characteristics of the mother. Genetic algorithm repeatedly modifies a population of individual solutions. The importance of retention for companies becomes even clearer in the e-commerce context, where customers make larger and more frequent purchases with higher transactional values [5].
Andjelkovic et al. proposed a Gradient Boosting model that performs best when compared to Decision trees and Logistic Regression. Binary classification followed by push notifications and tracking user activity decrease churn rate up to 28%.Value is low which means little or no mistakes should be done by model in classifying customers. Correct classification of customers lead to very few errors. Thus reducing the penalty associated with wrong classification. Gradient boosting is a machine learn ing technique for regression and classification problems, algorithm for primarily reducing bias. Decision rules are defined with purpose of separating the classes by making a hyperplane. Electronic commerce and social media also come with their own set of challenges [6].
Khandge et al. have proposed Logistic regression which uses a linear function to estimate the value of dependent variable by estimating the parameters for linear equation. Predictions are made from rules obtained from decision trees in contexts where churn israrer.Logistic regression is a classification method for predicting dependent variable say Y which presents the outcome (y = 1 if true churners, y = 0 otherwise).A 10-fold cross validation procedure is used having 70% training data and 30% testing data [7].
Ewing et al. have took into account evaluation of parametric (probability distribution of data) and non parametric techniques (ranking of data) to identify optimal modelling approach. Boosting technique (assumption free method), a non parametric method, delivers superior predictability where the size of the customer base is very small. Parametric statistics is a branch of statistics which assumes that sample data comes from a population that follows a probability distribution based on a fixed set of parameters. Most well-known elementary statistical methods are parametric include, among others distribution free methods, which do not rely on assumptions that the data are drawn from a given probability distribution. As such it is the opposite of parametric statistics. It includes non-parametric descriptive statistics, statistical models, inference and statistical tests [8].
Petkovski et al. explored the primary purposes behind beat in media transmission area in Macedonia. The proposed technique for examination of beat expectation covers a few stages: understanding the business; determination, investigation and information handling; actualizing different calculations for grouping; assessment of the classifiers and picking the best one for forecast. The acquired outcomes for the information from a media transmission organization in Macedonia, ought to be of incredible incentive for the board and advertising branches of other telecom organizations in the nation and more extensive [9].
© 2020, IJCSMC All Rights Reserved 110
Tamaddoni et al. took into account several modelling techniques are compared in terms of their ability to predict true churners. The best performing data-mining technique (boosting) is then applied to develop a profit maximizing retention campaign. Results confirm that the model driven approach to churn prediction and developing retention strategies outperforms commonly used managerial heuristics. Once all these models are constructed, their performance is evaluated based on AUC and cumulative lift measures [11].
Coussemet et al. have examined the prediction of cost sensitive methodology by considering thresholding procedure. It is the most robust approach in any situation. It perform well in situations with low to medium churn levels. It calculates minimum expected cost by defining a variable called as decision threshold. 0.5 value between 0 to1 define threshold cut off. 0 to 0.4 are non churners and 0.6 to1 are values of churners. Sum of Churners and non churners subtracted from 1 is defined as threshold [12].
Mestre Maria Rosario et al. depicted the examination of client conduct to discover stir clients. They tell that from the profiles of assortment of clients and their changing conduct after some time, associations can make promoting methodologies to know the gathering of clients and to choose whether those clients are gainful or not. They proposed a calculation which is cross breed from various leveled grouping and hidden markov model (HMM). They contrast increased technique and the non-expanded strategy with genuine information and engineered information to speak to that their proposed model performs better in foreseeing client conduct. They utilize diverse bunching calculations for division of the clients [13].
Wang C. et al. proposed another system to anticipate clients' obtaining conduct utilizing buy arrangements of clients. At that point consecutive buy examples are removed utilizing affiliation rule. Utilizing buy value-based records of clients, profile of the clients is manufacture that depicts the preferences of the clients. At that point a gathering of clients recognized who have comparative acquiring conduct utilizing the figurings of relationships among clients. Exchange grouping is utilized to bunch every one of the exchanges of the clients. At that point SOM procedure is utilized to recognize client buy successions. Successive buy examples are removed utilizing affiliation principle mining. They foresee the client conduct utilizing client's buy succession base on exchange information [14].
Shaaban et al. displayed another expectation model dependent on Data Mining (DM) strategies. The proposed model is made out of six stages which are; distinguish issue space, information determination, examine informational collection, arrangement, grouping and learning use. An informational collection with 23 characteristics and 5000 examples is utilized. 4000 occasions utilized for preparing the model and 1000 examples utilized as a testing set. The anticipated churners are bunched into 3 classes if there should be an occurrence of utilizing in a maintenance methodology. The information mining procedures utilized in this paper are Decision Tree, Support Vector Machine and Neural Network all through an open source software known as WEKA [15].
© 2020, IJCSMC All Rights Reserved 111
III. PROPOSED WORK
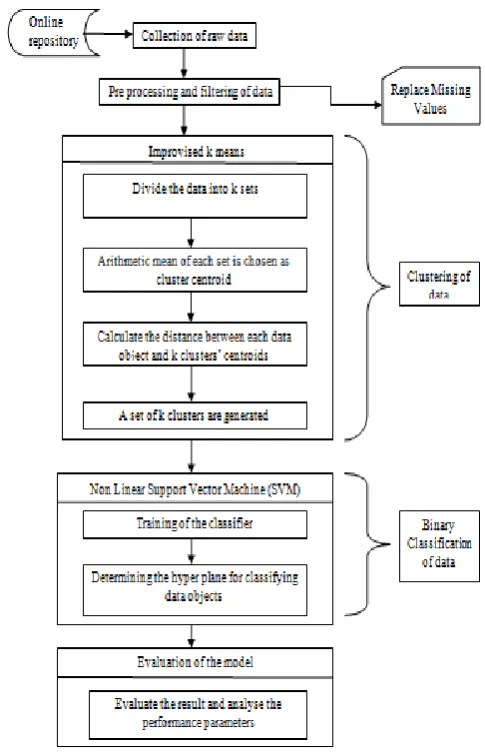
This research work proposes an efficient computational intelligence model comprising of clustering achieved through improvised K-Means algorithm and classification achieved through Non Linear Support Vector Machine.
The flowchart of the proposed technique is as follows:
Figure 2: Flowchart of Proposed Technique
The Algorithm steps for proposed Approach are as follows:
Step1: collect dataset from UCI machine repository.
D ( , ... ) specifies a data set containing n objects.
Step 2: apply pre processing and filtering process on the data by using replace missing value filter.
Step 3: Read the authenticated dataset.
Step 4: Choose a value of k for the data.
Step 5: Partition the dataset into k equal parts.
Step 6: The arithmetic mean of each part is taken as the centroid point.
Mean = ( )/ n
Where ∑ = sum of all data instances or records
© 2020, IJCSMC All Rights Reserved 112
Step 7: Compute the Euclidean distance of each data point to all the centroids as
edist ( , ). Euclidean distance of data record 1 to data record 2 is calculated as follows:
D ( = √
Where = ( , ) and = ( , )
Step 8: For each , examine the closest centroid and assign to that centroid.
Step 9: Set Near_ edist[i] = edist ( , ) // : nearest centroid.
Step 10: For each cluster j, recalculate the centroids.
Step 11: Repeat
Step 12: For each data-point
12.1 Compute its distance from the new centroid of the present nearest cluster.
12.2 If this distance is less than or equal to the previous distance, the data-point stays in that cluster,
Else
12.2.1 Compute edist ( , ) from all cluster centroids; End for.
12.2.2 Assign the data-point di to the cluster with the nearest Centroid.
12.2.3 Set Near_ edist [i] = edist ( , ); End for loop.
Step 13: Take best average sum of all Euclidean distances and obtain the final output.
Step 14: Train the classifier using reduced dataset.
Step15: Evaluate the performance on the basis of the following parameters:
a. Precision = TP / TP+FP
b. Recall = TP / TP+FN
c. F-Measure = 2*Recall*Precision / Precision+Recall
d. Accuracy = TP+TN / TP+FP+TN+FN
Where TP is True Positive, TN is True Negative, FP is False Positive and FN False Negative.
IV. EXPERIMENTAL RESULTS
The results have been simulated in Java Netbeans IDE using weka as an external library for data mining. The data used for analysis contains 2135 instances and contains attributes related to customer shopping in a particular market. The parameters calculated for the analysis of performance of proposed and existing techniques are classification accuracy, error rate of clustering and precision. The calculations of these parameters is mentioned in proposed work section.
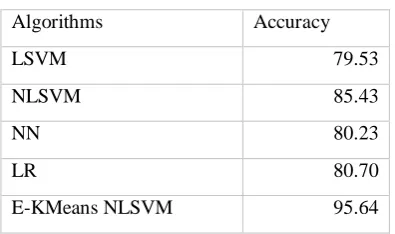
Table 1: Accuracy comparison
Algorithms Accuracy
LSVM 79.53
NLSVM 85.43
NN 80.23
LR 80.70
© 2020, IJCSMC All Rights Reserved 113
Figure 3: Accuracy comparison of proposed algorithm with existing base techniques
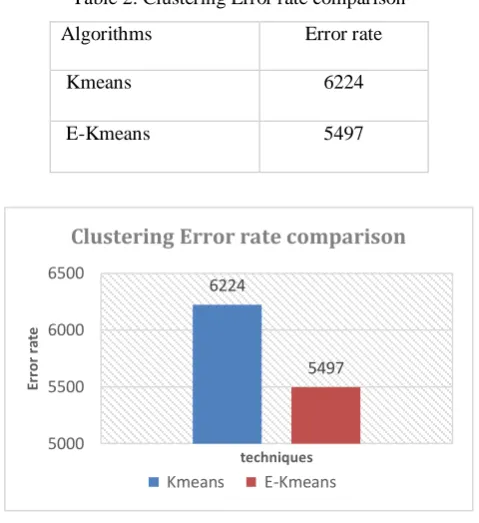
Table 2: Clustering Error rate comparison
Algorithms Error rate
Kmeans 6224
E-Kmeans 5497
Figure 4:Error rate comparison of E-Kmeans with standard Kmeans
The figures above show the comparison of the proposed Enhanced Kmeans with Non-Linear Support vector machine with the existing base techniques. The parameter Classification accuracy is better in case of proposed technique which is 95.64 i.e. highest among all the existing techniques. Figure 4 shows the clustering error rate comparison between Kmeans and E-Kmeans i.e. error of E-Kmeans is less which 5497 and in case of Kmeans it is 6224. Therefore, the proposed technique is better than the existing base techniques.
79.53 85.43 80.23 80.7 95.64
0 20 40 60 80 100 120
Accuracy
Acc
u
ra
cy
in
%
age
Accuracy Comparison
LSVM NLSVM NN LR E-KMeans NLSVM
6224
5497
5000 5500 6000 6500
Er
ro
r
ra
te
techniques
Clustering Error rate comparison
© 2020, IJCSMC All Rights Reserved 114
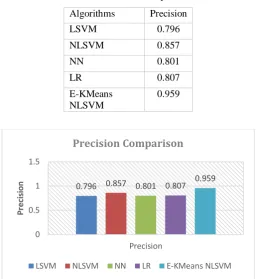
Table 3: Precision Comparison
Algorithms Precision LSVM 0.796
NLSVM 0.857
NN 0.801
LR 0.807
E-KMeans NLSVM
0.959
Figure 5: Precision Comparison of proposed technique with the existing techniques
Figure above shows the precision comparison of proposed technique with the existing base techniques. The precision values is calculated on a scale between [0-1]. The value closer to 1 is better. The proposed technique E-Kmeans with NLSVM is having value 0.959 which is highest among all other techniques. The parameters shown in form of graphs and tables depicts that the proposed technique is better than the existing techniques.
V. CONCLUSION AND FUTURE SCOPE
Organizations need to be more concern about customers and always work for Customer Relationship Management. Losing present customers causes additional costs due to the loss in sale and it generated the need of attracting more new customers. Retention is the most valuable asset for organization. So, this paper proposed a new approach to enhance the performance of existing classification base techniques including Neural Networks, Logistic Regression, Linear Support Vector Machines and Non Linear Support Vector Machine with the proposed technique Improvised Kmeans with Non Linear Support Vector Machine. Then this enhanced approach is used for predicting customer churn. So that proactive measures could be taken by company for churn prevention. The experimental results show that the proposed technique performs better than the existing base techniques in terms of accuracy, error rates and precision. In future, Some feature selection techniques can also be used with the proposed technique to optimize the attributes of the data and improve the performance to some more extent.
REFERENCES
[1] Adnan Amina, Feras Al-Obeidat, Babar Shah, Awais Adnan, Jonathan Loo, Sajid Anwar, “Customer churn prediction in telecommunication industry using dataCertainty”,Elsevier, Journal of Business Research, 2019, pp. 290–301.
[2] Abdelrahim Kasem Ahmad, Assef Jafar, Kadan Aljoumaa, “Customer churn prediction in telecom usingmachine learning in big data platform”, Springer, Journal of Big Data, 2019, pp. 1-24.
[3] Jin Xiao, Lan Huang and Ling Xie, “ Cost-Sensitive Semi-Supervised Ensemble Model for Customer Churn Prediction”, 15th International Conference on Service Systems and Service Management (ICSSSM), 2018
[4] Valerio Veglio, Gordini, Niccolo, "Customers churn prediction and marketing retention strategies. An application of support vector machines based on the AUC parameter-selection technique in B2B e-commerce industry." Industrial Marketing Management 62, 2017, pp. 100-107.
0.796 0.857 0.801 0.807 0.959
0 0.5 1 1.5
Precision
P
re
ci
si
o
n
Precision Comparison
© 2020, IJCSMC All Rights Reserved 115
[5] Kaizhu Huang,Amin, Adnan, Sajid Anwar, Awais Adnan, Muhammad Nawaz, Khalid Alawfi, Amir Hussain, "Customer churn prediction in the telecommunication sector using a rough set approach", Neurocomputing 237,2017, pp. 242-254.
[6] Igor Andjelkovic, Milosevic, Milos, Nenadzivic, "Early churn prediction with personalized targeting in mobile social games", Expert Systems with Applications 83,2017, pp. 326-332.
[7] Siddhi Khandge, Dalvi, Preeti Kanade, Ashish Deomore and Aditya Venkatesh Bankar."Analysis of customer churn prediction in telecom industry using decision trees and logistic regression." IEEE, In Colossal Data Analysis and Networking (CDAN), Symposium on, 2016, pp. 1-4.
[8] Michael Ewing, Ali Tamaddoni, Stanislav Stakhovych,, "Comparing churn prediction techniques and assessing their performance: A contingent perspective", Journal of service research 19, no. 2 ,2016, pp. 123-141.
[9] Aleksandar J. Petkovski, Biljana L. Risteska Stojkoska, Kire V. Trivodaliev, Slobodan A. Kalajdziski, “Analysis of Churn Prediction: A Case Study onTelecommunication Services in Macedonia”, IEEE, Telecommunications forum TELFOR, 2016
[10] Rokhmatul, Insani, Hira Laksmiwati Soemitro, "Data mining for marketing in telecommunication industry", IEEE, In Region 10 Symposium (TENSYMP), 2016, pp. 179-183.
[11] Ali Tamaddoni, Jahromi, Stanislav Stakhovych, and Michael Ewing, "Managing B2B customer churn, retention and profitability", Industrial Marketing Management 43, no. 7, 2014, pp. 1258-1268.
[12] Coussement, Kristof, "Improving customer retention management through cost sensitive learning", European Journal of Marketing48, no. 3/4 , 2014, pp. 477-495.
[13]Mestre Maria Rosario and Victoria Pedro., “Tracking of consumer behaviour in e-commerce”. 16th International Conference on Information Fusion, Istanbul, Turkey, 2013, pp. 1214-1221
[14]Wang Chong and Wang Yanqing, “Discovering Consumer’s Behaviour Changes Based on Purchase Sequences”. 9th IEEE-International Conference on Fuzzy Systems and Knowledge Discovery (FSKD 2012), 2012, pp. 642-645
[15]Essam Shaaban, Yehia Helmy, Ayman Khedr, Mona Nasr,“A Proposed Churn Prediction Model”, International Journal of Engineering Research and Applications, Vol. 2, Issue 4, June-July 2012, pp.693-697.
![Figure 1: churn taxonomy [2]](https://thumb-us.123doks.com/thumbv2/123dok_us/1888491.1246744/2.595.175.420.333.467/figure-churn-taxonomy.webp)