P R O C E E D I N G S
Open Access
Improved power by collapsing rare and common
variants based on a data-adaptive forward
selection strategy
Yilin Dai, Ling Guo, Jianping Dong, Renfang Jiang
*From
Genetic Analysis Workshop 17
Boston, MA, USA. 13-16 October 2010
Abstract
Genome-wide association studies have been used successfully to detect associations between common genetic variants and complex diseases, but common single-nucleotide polymorphisms (SNPs) detected by these studies explain only 5–10% of disease heritability. Alternatively, the common disease/rare variants hypothesis suggests that complex diseases are often caused by multiple rare variants with moderate to high effects. Under this hypothesis, the analysis of the cumulative effect of rare variants may thus help us discover the missing genetic variations. Collapsing all rare variants across a functional region is currently a popular method to find rare variants that may have a causal effect on certain diseases. However, the power of tests based on collapsing methods is often impaired by misclassification of functional variants. We develop a data-adaptive forward selection procedure that selectively chooses only variants that improve the association signal between functional regions and the disease risk. We apply our strategy to the Genetic Analysis Workshop 17 unrelated individuals data with quantitative traits. The type I error rate and the power of different collapsing functions are evaluated. The substantially higher power of the proposed strategy was demonstrated. The new method provides a useful strategy for the association study of sequencing data by taking advantage of the selection of rare variants.
Background
Genome-wide association studies (GWAS) have been used successfully to detect associations between com-mon genetic variants and complex diseases. However, common single-nucleotide polymorphisms (SNPs) detected by current GWAS explain only at most 5–10% of disease heritability [1]. One possible reason could be that another type of variant, rare variants, has not been considered in the current GWAS. Recent studies have shown that common diseases can be caused by func-tional variants with a wide spectrum of allele frequen-cies, including rare alleles [2-4]. GWAS on common SNPs are based on the currently popular common dis-ease/common variants hypothesis for complex disease etiology; these studies are well suited for detecting genetic variants with high allele frequencies and
relatively small to modest genetic effects. There are some difficulties in identifying variants based on the alternative common disease/rare variants hypothesis, which suggests that complex traits are caused collec-tively by multiple rare variants with moderate to high effects. Under this hypothesis, the analysis of the cumu-lative effect of rare variants may become crucial for dis-covering the missing genetic variation from traditional GWAS.
With the development of next-generation sequencing technologies, more rare variants can be genotyped, so the analysis of associations between rare variants and diseases becomes possible. It is well known that tradi-tional GWAS lack power for detecting rare variants. More powerful tests are needed to analyze resequencing genetic data. Recently, Li and Leal [5] proposed a strat-egy that collapses all the rare variants across a func-tional region. The idea behind this strategy is to assume that each rare variant in a functional region contributes * Correspondence: [email protected]
Department of Mathematical Sciences, Michigan Technological University, 1400 Townsend Drive, Houghton, MI 49931, USA
to a disease, and collapsing genotypes across variants will result in enriched association signals.
Several tests based on different collapsing strategies for case-control studies have been proposed. One is the cohort allelic sum test (CAST) [6], in which the number of individuals with one or more mutations in a group (e. g., a gene) are compared between case subjects and con-trol subjects. Because CAST deals only with rare var-iants, the combined multivariate collapsing (CMC) method [5] generalized it by performing a multivariate test with common variants and collapsing scores of rare variants. A weighted-sum statistic [7] is another method that collapses both common and rare variants by adding different weights based on allele frequencies, assuming that rare variants have a high effect compared with common variants. With the regression approaches pro-posed by Morris and Zeggini [8], these methods can also be extended to quantitative phenotypes. In addition, the power of a single-marker test is usually low because of the lack of genetic variant information and the need to adjust for multiple corrections. Multiple-marker tests might also lose power as a result of higher degrees of freedom. The collapsing methods can avoid drawbacks from both single-marker tests and multiple-marker tests by considering all the genetic variant information with only 1 degree of freedom.
However, the collapsing methods may not be robust and could be seriously impaired by misclassification of collapsing regions [5]. Regions can usually be defined by genes, SNP allele frequencies, or variant functionality. If all rare variants within a collapsing region have the same positive or negative effect on a disease, then the associa-tion signal could be amplified; however, if collapsing combines functional and nonfunctional variants, this would adversely affect power. To address this problem, we develop a data-driven forward selection strategy in which a common variant is first chosen as a base to col-lapse a specific region and then rare variants are selected to be collapsed with the base SNP. The proposed method is well suited for detecting regions in which common and rare variants have the same genetic effect on a disease, especially when the association signal of common var-iants cannot be identified by traditional GWAS. The new method is robust to the size of the region and can effi-ciently deal with noise caused by misclassification of non-causal rare variants. We apply our method to the Genetic Analysis Workshop 17 (GAW17) unrelated individuals data with quantitative traits Q1 and Q2. The proposed method works for quantitative traits.
Methods
Data preprocessing
We analyze the GAW17 unrelated individuals data set, with 200 replicates of simulated phenotypes Q1 and Q2,
to compare the power of different tests. There are 697 samples consisting of 209 case subjects and 488 control subjects. The data set contains 24,487 SNPs within 3,205 genes generated using real sequence data from the 1000 Genomes Project. We define rare variants as SNPs with a minor allele frequency less than 0.01 and perform collapsing within each gene. Because collapsing methods do not work well if the region includes too few SNPs, we first filter the genes according to a criterion of hav-ing at least 10 variants with one or more common SNPs. After filtering, we have 553 genes for analysis. The analysis is performed with the knowledge of the underlying simulating model.
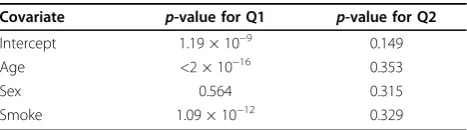
To control the false-positive rate, we adjust pheno-types for the effects of confounding variables and popu-lation stratification. We perform a linear regression of the phenotypes from the first replicate on the variables Sex, Age, and Smoking status to select confounding variables. The results are shown in Table 1. Variables with a p-value greater than 0.05 are selected as covari-ates for the adjustment. The top five eigenvectors from Eigenstrat [9,10] are also considered covariates. For each replicate, residuals of the multivariate linear regression of phenotypes on all the selected covariates are regarded as the adjusted phenotypes.
Data-adaptive forward selection
In brief, our strategy is as follows. We start with the most significant common SNP within one region. Rare variants are then added to the collapsed set one at a time until there are no variants remaining or until there is no visible improvement in the goodness-of-fit of the fitted model. More specifically, assume that there arem common variants and n rare variants within a certain predefined genomic region. Letx denote the genotype for all samples of a certain common variant, and let g denote the rare variant. Our strategy consists of the fol-lowing steps.
Step 1.Build a linear model on each common SNP. The SNP with the largest genetic effect as measured by theFstatistic of the linear regression is selected as the base of the collapsing function for this region:
Table 1p-Value for the selection of covariates for Q1 and Q2
Covariate p-value for Q1 p-value for Q2
Intercept 1.19 × 10⁻⁹ 0.149
Age <2 × 10⁻¹⁶ 0.353
Sex 0.564 0.315
Smoke 1.09 × 10⁻¹² 0.329
S E y x i m
xi i i i
=arg max
{
b ( )= +a b}
, =1, ..., . (1)Fis calculated based on:
E y( )= +a bS. (2)
Step 2.Collapse each rare variant with the base SNP in this region according to a specific collapsing function. Perform a linear regression on each collapsed score Col-lapse(S, gi). Based on the Fstatistics, variants with the most significant values are then selected as the base for the next procedure:
Fnewis calculated based on:
E y( )= +a bSnew. (4)
Step 3.If Fnew>F, then updateS, F, andn withSnew, Fnew, andn−1. Repeat step 2 until eitherF no longer
increases orn= 0.
When the selection procedure is finished, the test sta-tistic FS is defined as:
FS= ˆ ,
ˆ b
b
S (5)
which is the absolute value of the t statistics in the linear regression model:
E y( )= +a bSfinal, (6)
whereSfinalis the final collapsed score after the
selec-tion. Under the null hypothesis, the selection procedure drives the statistics in two different directions; taking the absolute value allows us to proceed with the nor-malization step, described in the next subsection.
Genome-wide permutation test
To correct the bias resulting from selection and obtain the global empiricalp-value, we perform a genome-wide per-mutation test. Assume thatMpermutations are performed forkcandidate genes. Let FSibe the observedtstatistics for theith gene, and let FSnull j i be the observedtstatistics for theith gene on thejth permutation. To compare the genetic effect across genes, we normalize the statistics using the estimated mean and variance from the permuta-tion and obtain the adjusted statistic FSadji:
FSadj i FSi i
be the maximum value of the observed statistics in the jth permutation. The global p-value of the ith gene is the proportion ofmj> FSadji:
We investigate the performance of our forward selection strategy with three collapsing methods: (1) the indicator method, (2) the sum method, and (3) the weighted-sum method. Letrijrepresent the genotype for theith indivi-dual at the jth locus. The collapsing functions are then defined as follows. The indicator function:
f ri I rij
j
( )=
∑
(13)is a function of the presence or absence of any minor allele in any region within an individual, which was first used in CAST [6]. The sum function:
f ri rij
j
( )=
∑
(14)f ri w rj ij
j
( )=
∑
, (15)where the weight is calculated by:
w
(there is one unreadable character of the right side of (16) in my computer. Please make sure it is same as before. It is q hat)
andnis the total number of individuals.
We estimate allele frequencies by jointly considering all subjects, because we could not follow the suggestion to estimate allele frequencies from unaffected individuals [7] when dealing with quantitative traits.
The test statistics of the indicator, sum, and weighted-sum functions without a forward selection strategy are denoted Tind, Tsum, and Tws, respectively, and theirp
-values can be calculated from the t distribution and adjusted by the Bonferroni correction. StatisticsTindand Tsumdeal only with the rare variants, whereas Tws
con-siders both common and rare variants.
The corresponding statistics obtained with our for-ward selection strategy are denoted FSind, FSsum, and
FSws. Another test statistic, denoted Tcom, is also
obtained by using linear regression on the most signifi-cant common variant in a region. A comparison of the proposed strategy with Tcom allows us to access the
effect of adding rare variant information to common variant information in a specific genetic region.
Results
Type I error and power
We analyzed 553 filtered genes on the 200 replicates for phenotypes Q1 and Q2. The type I error rate of the test and the power of the test are defined as follows. Take Q1 as an example; there are 4 functional and 549 nonfunc-tional genes. At a given significance levela, if the adjusted or globalp-value for a gene is greater thana, we would reject the null hypothesis. Next, we consider (number of tests that rejected the null hypothesis)/[200(549)] for the 549 nonfunctional genes as the type I error rate of the test. Because different tests should adapt to different types of genes, power is calculated by (number of tests rejected at the null hypothesis)/200 for each functional gene.
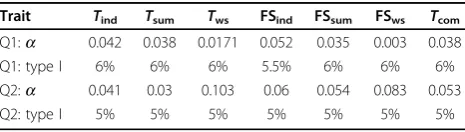
We found that the type I error of tests using the weighted-sum function was inflated for Q1. To have a
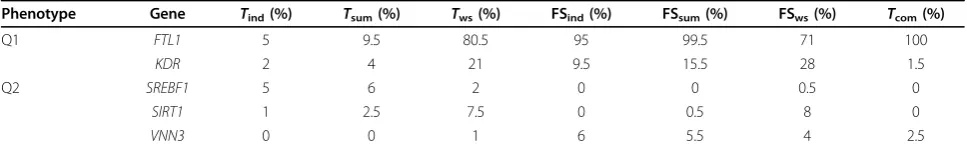
fair comparison, we selected a different significance level for each test to have the type I error rates of all tests at the same level. Some permutation tests cannot have exact 5% type I error because there were only 1,000 per-mutations. Therefore we chose a significance level so that all tests had a well-controlled false-positive rate of about 6% for Q1 and 5% for Q2 (Table 2). The power of the tests was calculated based on the same signifi-cance levels as the type I error. Table 3 lists all the genes with power greater than 5% according to at least one test.
For Q1,FTL1 was detected byTcomwith 100% power,
which indicated that the common SNP had a strong effect on the disease. However,Tcomis not optimal for
evaluating the proposed strategy. GeneKDRis the case we want to consider, because Tcom became
underpow-ered, which indicated that the effects of common SNPs were not significant. ForKDR, FSwsachieved the highest
power, followed byTws, FSsum, and FSind. We also found
that tests considering both common and rare variants achieved higher power than those that considered only rare variants (Tind and Tsum) or common variants
(Tcom). All forward-selection-based tests were ranked at
the top for KDR, which demonstrates the potential power of the forward selection strategy. For Q2, all tests became underpowered. Three genes (SREBF1, SIRT1, and VNN3) were detected by at least one test with power greater than 5%. FSwsachieved the highest power
(8%) in detectingSIRT1.
Discussion
We have proposed a data-adaptive forward selection strategy for genetic association studies with multiple common and rare variants. The proposed test is aimed at selecting rare variants for collapsing that best amplify the association signal between functional regions and phenotypes. Traditional collapsing methods do not have the option of selectively collapsing only functional rare variants with the same effects on the risk of disease; thus they may be underpowered by misclassification in collapsing regions. The major advantage of our method is that it can selectively collapse rare variants with the same genetic effect as the common variant in the
Table 2 Significance level (a) and type I error rate for Q1 and Q2
Trait Tind Tsum Tws FSind FSsum FSws Tcom
Q1:a 0.042 0.038 0.0171 0.052 0.035 0.003 0.038
Q1: type I 6% 6% 6% 5.5% 6% 6% 6%
Q2:a 0.041 0.03 0.103 0.06 0.054 0.083 0.053
Q2: type I 5% 5% 5% 5% 5% 5% 5%
functional region, thus leading to a more significant association signal. To correct the bias resulting from selection and to alleviate the computational burden, we performed a genome-wide permutation test. We evalu-ated the power of our method using different collapsing functions, based on the same type I error. The results show that the proposed method has substantially higher power across different collapsing strategies. The way to select rare variants for each functional region also sug-gests that our method may have higher power to detect functional regions with an either positive (damage) or negative (protective) effect on the disease traits, even if no common variant is associated with the disease, so long as enough rare variants collectively affect the dis-ease. The forward selection strategy could also be a powerful tool by adding different weights based on allele frequencies in order to lower the effect of common variants.
Conclusions
We developed a data-adaptive forward selection proce-dure by collapsing a common variant with selected rare variants. The validity and substantially higher power of the proposed strategy were demonstrated using the GAW17 data. The method provides a useful strategy for association studies of sequencing data by taking advan-tage of the selection of rare variants.
Acknowledgments
We would like to thank the organizers of GAW17 for providing the data for the analysis. The Genetic Analysis Workshops are partially supported by National Institutes of Health grant R01 GM031575. We also thank the reviewers for their careful reading of the manuscript and their thoughtful comments.
This article has been published as part ofBMC ProceedingsVolume 5 Supplement 9, 2011: Genetic Analysis Workshop 17. The full contents of the supplement are available online at http://www.biomedcentral.com/1753-6561/5?issue=S9.
Authors’contributions
YD contributed in the development of the statistical test, provided data analysis strategies, and drafted the manuscript. LG carried out part of the programing work. RJ and JD both supervised the whole process and participated in drafting the manuscript. All authors read and approved the manuscript.
Competing interests
The authors declare that they have no competing interests.
Published: 29 November 2011
References
1. Asimit J, Zeggini E:Rare variant association analysis methods for complex traits.Annu Rev Genet2010,44:293-308.
2. Bodmer W, Bonilla C:Common and rare variants in multifactorial susceptibility to common diseases.Nat Genet2008,40:695-701. 3. Cirulli ET, Goldstein DB:Uncovering the roles of rare variants in common
disease through whole-genome sequencing.Nat Rev Genet2010,
11:415-425.
4. Schork NJ, Murray SS, Frazer KA, Topol EJ:Common vs. rare allele hypotheses for complex diseases.Curr Opin Genet Dev2009,19:212-219. 5. Li BS, Leal SM:Methods for detecting associations with rare variants for
common diseases: application to analysis of sequence data.Am J Hum Genet2008,83:311-321.
6. Morgenthaler S, Thilly WG:A strategy to discover genes that carry multiallelic or mono-allelic risk for common diseases: A cohort allelic sums test (CAST).Mutat Res2007,615:28-56.
7. Madsen BE, Browning SR:A groupwise association test for rare mutations using a weighted sum statistic.PLoS Genet2009,5:e1000384.
8. Morris AP, Zeggini E:An evaluation of statistical approaches to rare variant analysis in genetic association studies.Genet Epidemiol2010,
34:188-193.
9. Price AL, Patterson NJ, Plenge RM, Weinblatt ME, Shadick NA, Reich D:
Principal components analysis corrects for stratification in genome-wide association studies.Nat Genet2006,38:904-909.
10. Price AL, Zaitlen NA, Reich D, Patterson N:New approaches to population stratification in genome-wide association studies.Nat Rev Genet2010,
11:459-463.
doi:10.1186/1753-6561-5-S9-S114
Cite this article as:Daiet al.:Improved power by collapsing rare and
common variants based on a data-adaptive forward selection strategy.
BMC Proceedings20115(Suppl 9):S114.
Submit your next manuscript to BioMed Central and take full advantage of:
• Convenient online submission
• Thorough peer review
• No space constraints or color figure charges
• Immediate publication on acceptance
• Inclusion in PubMed, CAS, Scopus and Google Scholar
• Research which is freely available for redistribution
Submit your manuscript at www.biomedcentral.com/submit Table 3 Power of seven tests for Q1 and Q2
Phenotype Gene Tind(%) Tsum(%) Tws(%) FSind(%) FSsum(%) FSws(%) Tcom(%)
Q1 FTL1 5 9.5 80.5 95 99.5 71 100
KDR 2 4 21 9.5 15.5 28 1.5
Q2 SREBF1 5 6 2 0 0 0.5 0
SIRT1 1 2.5 7.5 0 0.5 8 0
VNN3 0 0 1 6 5.5 4 2.5