212
©IJRASET: All Rights are Reserved
Jaundice Detection using Image Processing
U. N. Subhadra Devi1, Dr. M. Satyanarayana2 1
Assistant Professor, 2Associate Professor, Department of Electronics and Communication Engineering, MVGR College of Engineering, Vizianagaram-535002
Abstract: Jaundice is a yellow discoloration of the skin and/or whites of the eyes that are often seen in humans. The main symptom of jaundice is yellow coloring of the skin and conjunctiva of the eyes. Jaundice is not a disease but is a symptom of an elevated blood bilirubin level. Jaundice is not painful, but serious complications can occur if elevated bilirubin levels are not treated in a timely manner. Because many of these patients who are suffering from Jaundice require care from multiple medical disciplines, coordination of care is another important role for the family physician. Thus, the goal of this project is to detect jaundice in the humans at early stage. A simple edge detection and color detection method in image processing through MATLAB program was employed to study the behavior of the patient..
Index Terms: Jaundice, Image Acquisition, Preprocessing, Color Classification, Histogram.
I. INTRODUCTION
AUNDICE (also called icterus) is when the skin and the whites of the eyes become a yellow color. People with jaundice have a problem with their liver, which stops it from removing dead red blood cells properly. These blood cells contain a chemical called bilirubin. Bilirubin causes the yellow coloring of the skin. Jaundice is common in newly born babies. It usually starts the second day after birth. Jaundice can also be caused by other diseases, like malaria, hepatitis, or gallstones. Jaundice is the most common of all liver problems. The yellow color of the skin and mucous membranes happens because of an increase in the bile pigment, bilirubin, in the blood. The bile, made by the liver, is a vital digestive fluid needed for proper nutrition. It also stops decaying changes in food. If the bile is stopped from entering the intestines there is an increase in gases and other products. Normally, the production of bile and its flow is constant.
Thus, the goal of this work is to detect jaundice in the humans at early stage. A simple edge detection and color detection method in image processing through MATLAB program was employed to study the behavior of the patient.
II. SCLERAOFHUMANEYE
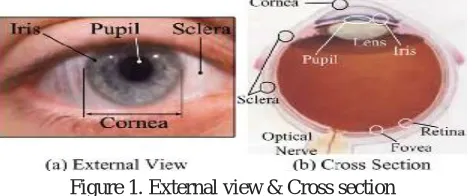
[image:1.612.190.426.566.664.2]The sclera, also known as the white of the eye, is the opaque, fibrous, protective, outer layer of the eye containing mainly collagen and some elastic fiber. In humans, the whole sclera is white, contrasting with the colored iris, but in other mammals the visible part of the sclera matches the color of the iris, so the white part does not normally show. In the development of the embryo, the sclera is derived from the neural crest. In children, it is thinner and shows some of the underlying pigment, appearing slightly blue. In the elderly, fatty deposits on the sclera can make it appear slightly yellow. Many people with dark skin have naturally darkened sclera, the result of melanin pigmentation.
Figure 1. External view & Cross section
The human eye is relatively rare for having an iris that is small enough for its position to be plainly visible against the sclera. This makes it easier for one individual to infer where another individual is looking, and the cooperative eye hypothesis suggests this has evolved as a method of nonverbal communication.
213
©IJRASET: All Rights are ReservedIII. PROPOSEDWORK
A. Jaundice Detection
For the detection of jaundice by using MATLAB software. This detection process involves mainly four steps as given below
1)Image acquisition
2)Image segmentation
3)Color classification
4)Apply regression
[image:2.612.178.439.262.335.2]To acquire the image from the data base available with us or take the image directly using some electronic device like camera. After acquisition we need to separate the white gray matter in the eye from the lens where we can observe the yellowness of the eye Color of the white gray matter is estimated and each pixel’s R, G, B components are estimated with respect to the yellow shade. By estimating the pixel intensities and comparing them with the available knowledge base and concluding the results about jaundice presence.
Figure 2. Steps for Jaundice detection
a) Image Acquisition: The types of images in which we are interested are generated by the combination of an “illumination” source and the reflection or absorption of energy from that source by the elements of the “scene” being imaged. For example, the illumination may originate from a source of electromagnetic energy such as radar, infrared, or X-ray energy. But it could originate from less traditional sources, such as ultrasound or even a computer-generated-illumination-pattern.
b) Pre-Processing: In pre-processing applying Gaussian filtering to input image. Gaussian filtering is commonly used to remove the noise from the image. Here used wiener function to the input image. Gaussian filter is windowed filter of linear category; by its nature is weighted mean. The Gaussian Smoothing Operator performs a weighted average of surrounding pixels based on the Gaussian distribution. It is used to remove Gaussian noise and may be a realistic model of defocused lens. Sigma defines the amount of blurring.
c) Image Segmentation: Image segmentation is the division of an image into regions or categories, which correspond to different objects or parts of objects. Every pixel in an image is allocated to one of a number of these categories. A good segmentation is typically one in which pixels in the same category have similar greyscale of multivariate values and form a connected region, neighboring pixels which are in different categories have dissimilar values.
d) Color Classification: The process is composed of two stages of the basic classification by sequential cluster detection in a color space and the reclassification of the extracted representative colors. At the stage of the basic classification, color clusters in a uniform color space are detected sequentially by a histogram analysis. Image regions with the corresponding uniform colors are extracted, and then labeled in the image plane. Once a color class is determined, the data identified with the class are removed from the data set. The cluster detection is repeated on the remaining image data. This sequential process is closed when no cluster remains in the color space.
[image:2.612.200.419.637.719.2]214
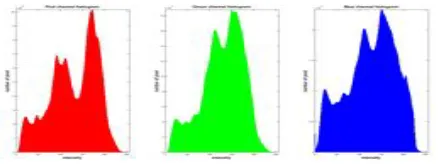
©IJRASET: All Rights are ReservedThe horizontal axis of the graph represents the tonal variations, while the vertical axis represents the number of pixels in that particular tone. The vertical axis represents the size of the area that is captured in each one of these zones.
e) Statistical Analysis: In statistical modeling, regression analysis is a set of statistical processes for estimating the relationships among variables. It includes many techniques for modeling and analyzing several variables, when the focus is on the relationship between a dependent variable and one or more independent variables (or 'predictors'). More specifically, regression analysis helps one
IV. MATHEMATICALANALYSIS
A. Mean Calculation
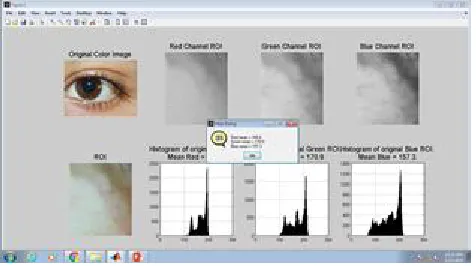
In this work calculating individual means for all three RGB channels using inbuilt MATLAB functions like mean2 and mean. Mean2 function is used for calculating mean of all pixels in the selected portion of the image. It is observed that the mean of all the channels (red channel, green channel, blue channel) is almost of same value for the part of image which contains grey scale values. Also we have observed that the mean of red channel and green channel are almost equal when the selected portion of the image is having yellow part in it. But mean of the blue channel is low when compared to the means of red and green channels understand how the typical value of the dependent variable (or 'criterion variable') changes when any one of the independent variables is varied, while the other independent variables are held fixed.
B. Histogram
An image histogram is a type of histogram that acts as a graphical representation of the tonal distribution in a digital image. It plots the number of pixels for each tonal value. By looking at the histogram for a specific image a viewer will be able to judge the entire tonal distribution at a glance. Image histograms are present on many modern digital cameras.
From the above observations concluded that for jaundice effected eye red and green channel means are similar and high when compared to blue channel mean of the selected portion of the image. Whereas, for normal person there is a negligible difference among the means of three channels.
Hence calculating the combined mean of red and green channels and comparing it with the blue channel mean. Here considered the threshold difference value between red and green channel mean to the blue channel mean as sixty by trial and iteration method
V. RESULTS
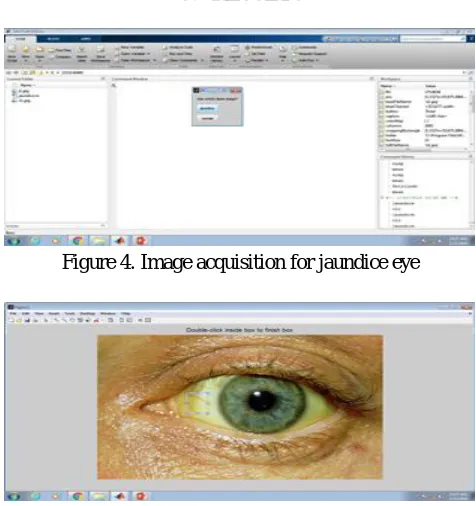
[image:3.612.186.424.466.719.2]A. Jaundice Effected Eye
Figure 4. Image acquisition for jaundice eye
215
©IJRASET: All Rights are ReservedFigure 6. Segmentation of sclera for jaundice eye
[image:4.612.188.424.242.374.2]Figure7. Histograms for RGB channels of the segmented jaundice image
Figure 8. Means of RGB channels of jaundice eye
[image:4.612.190.425.564.716.2]216
©IJRASET: All Rights are ReservedB. Normal Eye
Figure10. Image acquisition for normal eye
Figure11. Contour drawing for normal eye
Figure12. Segmentation of sclera for normal eye
217
©IJRASET: All Rights are ReservedFigure 14. Means of RGB channels of normal eye
Figure15. Command Window output for normal eye
Results Of Jaundice Detection On Different Samples
S.No Image Channel Mean Difference
=Avg. of red and green-Blue
Result
Red Green Average of Red and
green
Blue
1) 144.1 127.3 135.7 99.0 36.7 Normal
person
2) 163.7 131.7 147.7 19.7 128
Jaundice effected
person
3) 136.3 115.0 125.65 60.9 64.75
Jaundice effected
person
4) 165.3 155.2 160.25 142.6 17.65 Normal
218
©IJRASET: All Rights are Reserved5) 212.2 157.1 184.65 46.4 138.25
Jaundice effected
person
6) 172.0 159.4 165.7 110.4 55.3 Normal
person
7) 187.2 124.5 155.85 21.8 134.05
Jaundice effected
person
8) 249.2 203.7 226.45 76.8 149.65
Jaundice effected
person
Table1. Results of different samples
VI. CONCLUSION
The outcome of this work will represent the major achievements and promising avenues for future enhancements in the jaundice detection using image processing, which are likely to yield useful results. Image processing can be used for different color classification problems in the medical field. Sometime it becomes difficult to recognize a user directly as noise may be present in jaundice images. MATLAB paves a user friendly path for solving the color image processing techniques. Sometimes the images taken may contain some disturbances regarding the color of the sclera part of the eye due to some external factors like morphing of database images.
The basic approach of this study is to design a simple process for the detection of jaundice through color change of the sclera of the eye. The proposed method mainly consists of four modules, namely acquisition of the image from the external or internal sources, segmentation of sclera part of the image, color classification of segmented part of the image, applying regression techniques to make the jaundice detection accurate.
The results clearly demonstrate that the proposed jaundice detection technique provides better accuracy and execution time rather than existing techniques. This is a new method which was implemented on eye rather than skin and blood test for the jaundice detection. This will help for the future advancements in the medical field for time saving and early treatment. During the whole process, the RGB image is processed for the yellow color intensity identification which is the important feature for jaundice detection. This method of detection of jaundice for adults is easier and proper treatment can be assured for the patients at early stages leading to low mortality.
REFERENCES
[1] A. Arulmozhi, M. Ezhilarasi, "GA Based Feature Ranking Mechanism To Detect New Born Infants Jaundice With An Ensemble Tree Strategy", Journalof TheoreticalandApplied Information Technology, vol. 65, no. 2014, July 2014.
[2] P.V. Puppalwar, Kalyan Goswami, Archana Dhok, "Review on Evolution of Methods of Bilirubin Estimation", IOSR Journal of Dental and Medical Sciences, vol. 1, no. 3, pp. 17-28, 2012.
[3] Jaundice in new born monitoring using color detection method a MN Mansor, S Yaacob, M Hariharan, SN Basah… Procedia.., 2012 – Elsevier. [4] Giovanna Bertini, "Non-invasive bilirubinometry in neonatal jaundice", Semin Neonatol, vol. 7, pp. 129-133, 2002.
[5] Gilbert syndrome accelerates development of neonatal jaundice JD Bancroft, B Kreamer, GR Gourley - The Journal of pediatrics, 1998.