Data Mining: Architecture, Techniques and its uses
ANJU DEVI
Abstract
Data Mining refers to extracting useful information or knowledge from large amount of data. It is beneficial in every field like business, medicine, education sectors, health care, industrial, management, engineering, web data, banking, customer relationship management, fraud detection etc. It is also known as knowledge discovery process. Data mining is an integral part of Knowledge Discovery in Database (KDD). In this paper different types, architecture of data mining are describe in details with the help of block diagram. Its techniques also define which are summarization, classification, association rules, prediction, clustering and regression etc.
Keywords: Data mining, Architecture, Aspects, Techniques and uses
Introduction of Data Mining
Data mining is a field of research which are very popular today. A large amount of data is available in every field of life such as: banking, medicine, insurance, education sectors etc. due to advances of digitization techniques. Data mining is a process of selecting interested pattern to from a large amount of data or information. Data Mining is similar to Data science. It is an interdisciplinary turf about scientific methods, process, and system to take out knowledge from data in various forms.
Data mining is defined as a set of techniques for automatically analyzing interesting data in the data. Many organizations now have huge amounts of data stored in databases that needs to be analyzed. Traditionally, data has been analyzed by hand to discover interesting knowledge. In general, data mining techniques are designed understand the past or predict the future. Data mining techniques are used to take decisions based on facts rather than instinct. There are various types of techniques are used classification, association rules, prediction, clustering and regression etc. In this paper data mining is introduce in details.
Aspects of Data Mining
The sequences of steps identified in extracting knowledge from data are:
Data mining is just one part of the process of discovering useful knowledge from data, referred to collectively as Knowledge Discovery in Databases (KDD). In brief, KDD outlines a process of knowledge discovery as a series of iterative steps:
1) Data Cleaning
2) Data Integration
3) Data selection,
4) Data transformation,
5) Data Mining,
6) Pattern Evaluation, and
7) Knowledge
1. Data Cleaning
Basically, we collect the different types of data which includes errors, noise, value missing etc. So, we need to clean up the data. In data cleaning step, noisy and inconsistent data is removed.
2. Data Integration
In this step integrate or combines the different sources.
3. Data Selection
In this step, data relevant to the analysis task are retrieved from the database. In the first step we are unable to collect the data. For this, we select only those data which we think useful for data mining.
4. Data Transformation
Basically, the data even after cleaning is not ready for mining. In this step, data is transformed into appropriate forms for mining. Thus, the techniques used in data transformation are: aggregation, normalization etc.
5. Data Mining
After transformation the data mining steps has come. Now we can apply data mining techniques on the data. It takes only the interesting patterns. Data mining uses the techniques clustering and association analysis.
6. Pattern Evaluation
Generally in this step, data patterns are evaluated.
7. Knowledge Presentation
As this step is beneficial to us. Generally, in this step, knowledge is represented.
Data Mining Techniques
(I) Classification
Classification is a derivation of a model to determine the class of an object based on its attributes. A collection of records will be available, each record with a set of attributes. A classification model has relationships between attributes and objects of the class. Additionally, you can use classification as a feeder to, or the result of, other techniques.
(II) Prediction
Prediction derives the relationship between a thing you know and a thing you need to predict for future reference. Prediction is nothing but finding out the knowledge or some pattern from the large amounts of data.
(III) Time - Series Analysis
Time series analysis comprises methods for analyzing time series data in order to extract meaningful statistics and other characteristics of the data. Time series is important because it imparts knowledge about what has taken place in the past and what will take place in time to come. Examples of time series are heights of ocean tides etc. Time series are drawn by line charts. Time series are used in signal processing, pattern recognition, weather forecasting, earthquake prediction, control engineering and largely in any domain of applied science and engineering which involves temporal measurements. Stock market prediction is an important application of time- series analysis.
(IV) Association
Association discovers the connection among a set of items. Association identifies the relationships between objects. Such type of connections of objects is called association rules.
(V) Clustering
Cluster or you can say groups are used to identifying the classes, for a set of objects whose classes are unknown. Clustering is used to identify data objects that are similar to one another. The main advantage of clustering over classification is that, it is flexible to change and helps single out useful features that differentiate groups. Clustering requirements in scalability, high dimensionality, ability to handle noisy data etc. There are various types of clustering methods like as: density based, hierarchy, partitioned, model based etc.
(VI) Summarization
A set of relevant data is summarized which result in a smaller set that gives aggregated information of the data. Data Summarization is a term for a short winding up of a big paragraph. Data summarization has the great importance in the data mining.
Data Architecture
1. Data Sources
There are so many documents present. That is a database, data warehouse, World Wide Web. That is the actual sources of data. Sometimes, data may reside even in plain text files or spreadsheets. World Wide Web or the Internet is another big source of data. Organizations usually store data in databases or data warehouses. Data warehouses may contain one or more databases.
2. Database or Data Warehouse Server
The database data warehouse server contains the actual data that is ready to be processed. Hence, the server handles retrieving the applicable information. That is based on the data mining request of the user.
3. Data Mining Engine
In data mining system data mining engine is the interior component. As It consists a number of modules. That we used to perform data mining tasks that includes: association, classification, clustering, prediction, etc.
4. Pattern Evaluation Modules
This module is mainly responsible to take only interesting pattern. It interacts with the data mining engine. Its main focus is to search only interesting patterns.
5. Graphical User Interface
Graphical user interface to communicate between the data mining system and user. Also, this module helps the user use the system easily and efficiently. When the user specifies a job, this element interacts with the data mining system. Thus, displays the result in an easily understandable manner.
6. Knowledge Base
In whole data mining process, the knowledge base is beneficial. It might be useful for guiding the search or evaluating the interestingness of the result patterns. The knowledge base might even consist of user plan and data from user experiences. That can be useful in the process of data mining. The data mining engine might get inputs from the information. That is the base to make the result more accurate and reliable. The pattern estimation module interacts with the knowledge base.
Uses of Data Mining
Its scope is vast. It is used in various fields by various organizations which are given below:
Healthcare: Data mining holds to improve healthcare systems. This will also allow healthcare professionals to improve the quality of care and reduce costs.
Education: There is a new emerging field, called Educational Data Mining. Data mining can be used by an organization to take accurate decision and also to calculate the results of the student. The institution can focus on what to teach and how to teach.
Investigate analysis: Data mining is helpful in data cleaning, data pre-processing and integration of databases. The researchers can get any related data from the database that may bring any change in the research.
Business analysis: Business analysis is the most needed practice to know status of your business and its competitors and the domain where improvement is needed.
Digital Security: Analyzing the vast data allows you to prevent fraud and unauthorized people from signing in to accounts by identifying anomalies and creating algorithms to sort the frauds from the normal profiles.
Conclusions
We have learned aspects of Data Mining and knowledge discovery, Elements of Data Mining and applications or uses etc. Data mining is a powerful tool that used in the field of medical, health care, banking, security or fraud detection, education, managerial businesses etc. This paper provides a new perspective of a researcher regarding applications of data mining in social welfare/ benefits.
References
[1]. https://www.tutorialspoint.com/data_mining/dm_knowledge_discovery.htm
[2]. https://data-flair.training/blogs/data-mining-and-knowledge-discovery/
[3]. https://data-flair.training/blogs/data-mining-architecture/
[4]. http://www.wideskills.com/data-mining-tutorial/data-mining-architecture
[5]. http://www.wikipidea.com/
[6]. www.google.com/data mining uses and aspects/
[7]. https://www.quora.com/What-are-the-uses-of-data-mining
Financial Performance of DCC Bank with Special Reference To
Shivamogga District
DR. VEERSHETTY G RATHOD
ASHOKA M
Abstract
A cooperative bank is a financial entity which belongs to its members, who are at the same time the owners and the customers of their bank. Co-operative banks are often created by persons belonging to the same local or professional community or sharing a common in tersest. Cooperative banks generally provide their members with a wide range of banking and financial services (loans, deposits, banking accounts etc.).Co-operative banks differ from stockholder banks by their organization, their goals, their values and their governance. Present paper attempts to examine the financial performance of DCC Bank of Shivamogga district through selective indicators. This paper also studies the percentage and growth rate of investment, working Capital, Shares, Loan Distribution and Profit in DCCB. To achieve the objectives of the paper data has been collected from various secondary sources and analyzed by using simple statistical tools.
Keywords: Credit, deposit, cooperative bank, district central cooperative banks (DCCBs), interest
Introduction
A co-operative bank is a financial entity which belongs to its members, who are at the same time the owners and the customers of their bank. Co-operative banks are often created by persons belonging to the same local or professional community or sharing a common interest. Co-operative banks generally provide their members with a wide range of banking and financial services (loans, deposits, banking accounts etc.). Co-operative banks differ from stockholder banks by their organization, their goals, their values and their governance. In most countries, they are supervised and controlled by banking authorities and have to respect prudential banking regulations, which put them at a level playing field with stockholder banks. Depending on countries, this control and supervision can be implemented directly by state entities or delegated to a co-operative federation or central body. Co-operative banking is retail and commercial banking organized on a co-operative basis. Co-co-operative banking institutions take deposits and lend money in most parts of the world. Co-operative banking, includes retail banking, as carried out by credit unions, mutual savings and loan associations, building societies and co-operatives, as well as commercial banking services provided by manual organizations (such as co-operative federations) to co-operative Businesses.
The structure of commercial banking is of branch banking type; while the cooperative banking structure is a three tier federal one as follows,
1. A State Co-operative Bank works at the apex level (i.e. works at State level).
Assistant Professor, Dept. of Commerce and Management, Sahyadry Commerce and Management College, Shivamogga
577203, Karnataka
Lecturer, Dept. of Commerce and Management, Sahyadri Commerce and Management College, Shivamogga 577203,
2. The Central operative Bank works at the Intermediate Level. (i.e. District Co-operative Banks ltd. works at district level)
3. Primary co-operative credit societies at base level (At village level).
The Shivamogga district cooperative central bank has been registered under Cooperatives Societies Act in the year 1953 vide register No: ARS/1041/18-10-1953 as a central financing agency of PACS. The area of operation of the bank is confined to Shivamogga District consisting of 7 taluks. The district is divided into 2 revenue sub division, namely; Malanad and semi malanad areas. The Malanad area is covered by Thirthahalli, Hosanagar, Sagar and Sorabtaluks. The semimalanad area is covered by Shivamogga, Bhadravathi and Shikaripurataluks. The financial needs of the farmers and the financial operations of the bank could vary across these regions. The enquiry into the working of the DCC bank could reveal interesting facts about the bank’s performance according to the geographical variations. The Bank aimed at providing financial assistance to the public of shivamogga District especially agriculturist & help for the effective functioning of rural cooperative societies and other societies / institutions in the cooperative field.
About the Bank
1) It was established in 1953.
2) It is a co-operative bank.
3) D.C.C. means (District central co-operative bank).
4) The area of operation at that time was undivided Shivamogga district.
5) The bank bifurcated on 28th Feb 2003.
6) The area of operation of the existing bank restricted to newly shivamogga district with effect from 1st March 2003.
7) The main branch is in shivamogga city. In shivamogga district there are 196 villages & talukas are here.
8) There are 18 branches throughout shivamogga district
9) There are 416 co-operative credit societies they got their membership. In that 182 are primary Co-operative credit society & the bank except the membership & nominations.
10) The bank will accept 4 types of membership. a) State government. b) Co-operative society in shivamogga district. C) Associate members (both individual & other than co-operative societies).
11) Co-operative means it is voluntary association of person who join together to safe guard their interests.
12) It is based on the principles of mutual self-help quality democracy & freedom.
13) They started bank with Rs. 25,000 share capital &Rs. 20,000 as deposit.
14) In the board of Director there are 13 members.
15) Representative of apex bank ---01.
16) State Government nominee----04.
17) Period of Board of management is 5 years.
18) Board of Directors elects President & Vice-President.
Table 1: Financial Performance of DCC Bank, Shivamogga since 2013-14 to 2017-18
Particulars 2013-14 2014-15 2015-16 2016-17 2017-18
Shares 91.30 91.30 91.30 91.30 91.30
Funds 96.99 96.99 96.99 96.99 96.99
Deposits 90.60 90.60 90.60 90.60 90.60
Borrowing loans 88.88 88.88 88.88 88.88 88.88
liabilities 73.91 73.91 73.91 73.91 73.91
Balance loans 94.03 94.03 94.03 94.03 94.03
Loans distribution 88.57 88.57 88.57 88.57 88.57
Working capital 90.63 90.63 90.63 90.63 90.63
Profit 77.89 77.89 77.89 77.89 77.89
Source: Annual Report 2013-14 to 2017-18
The financial performance like target was not reached at every year except 2015-16& 2016-17 which comes under fund mobilized i.e., 101.13% & 104.45%. Other hand achievement always lacking behind the target at every items in general profit in particular heights 104.45% of achievement has been achieved in funds during 2016-17 and lowest 66.26%, and 67.63% in profit during the year 2015-16& 2016-17 followed by 73.91% in reserves in the year 2013-14. On the Basis of above Table if can be concluded that target has not been reached it shows that bank is not working properly in the financial matter due to lack of in efficiency of administrations recovery of loan, generation of funds & distribution of fund, awareness of the people etc. Year wise total percentage of financial performance of DCC Bank, Shivamogga since 2013-14 to 2017-18 is shows in table no. 2.
Table 2: Year wise Total Percentage of Financial Performance of DCC bank Particulars 2013-14 2014-15 2015-16 2016-17 2017-18 Total
Shares 15.52 16.28 20.55 21.27 26.38 100
Funds 18.03 18.1 19.76 21.64 22.46 100
Deposits 12.99 15.45 18.19 24.33 29.04 100
Borrowing loans 12.2 14.37 26.94 17.18 29.39 100
liabilities 8.53 14.3 24.7 25.08 27.39 100
Balance loans 14.85 15.48 20.29 20.75 28.63 100
Loans distribution 12.73 18.29 21.12 18.96 28.91 100
Working capital 13.15 15.39 21.39 22.06 28.01 100
Profit 21.88 17.57 18.61 19 22.94 100
Source: Annual Report 2013-14 to 2017-18
Table 3: Year wise Growth rate of Financial Performance of DCC Bank
Particulars 2015-15 2015-16 2016-17 2017-18
Shares 4.90 27.56 4.64 32.93
Funds 0.38 9.18 10.45 4.56
Deposits 18.98 21.10 47.24 36.23
Borrowing loans 17.74 102.98 -79.91 99.36
liabilities 67.72 122.01 4.35 27.18
Balance loans 4.22 32.42 3.11 53.03
Loans distribution 43.69 22.23 -16.99 78.17
Working capital 17.09 45.62 5.12 45.21
Profit -19.67 4.73 1.76 18.05
Source: Annual Report 2013-14 to 2017-18
The highest 67.72% of growth rate was reserve followed by 18.98% in deposits and lowest 0.38% imp fund generation in the year 2015-16 in the same year there where negative growth rate that is -19.67% in profit on the other hand the
growth rate of Bank loan & Reserves has bank increased tremendously that is 102.98% & 122.01% in the year 2016-17 there is positive growth rate among all particulars during the same year, Negative rate can see in bank loan that is -
79.91% in 2016-17 which was highest in previous year followed by -16.99% in loan distribution s, The growth rate in financial performance increased among all particulars during 2017-18 highest 99.36% growth rate was bank loan followed by 78.17% in loan distribution & lowest growth rate 4.56% in funds there was no negative growth rate in same year. It is summarize that growth rate financial performance is better for every year on the other hand there is always positive growth among all particulars except Bank loan, loan distribution and profit positive growth rate is good indicator for financial traction of DCC Bank, Shivamogga.
Weakness
• High oriented cause due to excessive labour force. • Low turnover of funds resulting in low profits
• Defective marketing strategy lacks effective advertising and publicity. • Needs updating with the times in terms of effective utilization of funds
• R&D is not effective in as much as it has not made any brake through in new Products& policies.
• The large proportion of the target area is formers. It has very few offers to General loans like house loans & other loans.
• Unskilled labour coupled with excess labour hampers profitability and Product lies under utilized
Findings and Conclusion
It is point out that DCC Bank working in Such & good way which got award for 3 times concern to financial performance especially Shivamogga is one backward districts among 29 districts of Karnataka, DCC bank play very vital role at grass root level in general agricultural in particular which helps to Come up from financial problem particular agricultural formers that back bone of Indian economic if it works in the some directions there is no doubt if will become Nationalized Bank in future.
Suggestions
1. The banks should adopt the modern methods of banking like internet banking, credit cards, ATM, etc.
2. The banks should plan to introduce new schemes for attracting new customers and satisfying the present ones.
3. The banks should plan for expansion of branches.
4. The banks should improve the customer services of the bank to a better extent.
Reference
1. Harish Kumar Singla. Financial performance of banks in India. The ICFAI Journal of Management. 2008, 7(1).
2. Fulbag Singh, Balwinder Singh. Funds management in the central cooperative banks of Punjab-an analysis of financial margin, The ICFAI Journal of Management. 2006; 5:74-80.
3. Chander Ramesh, Chandel Jai Kishan. Financial Viability of an Apex Cooperative Credit Institution-A Case Study of the HARCO Bank, Asia-Pacific Business Review. 2010; VI (2):61-70.
4. Ved Pal, NS Malik. A multivariate analysis of the financial characteristics of commercial banks in India. The ICFAI Journal of Management. 2007, 6(3).
5. Golden, S. A. R., & Regi, S. B. (2014). Customer Preference Towards E-Channels Provided By State Of Bank Of India. Kongunadu College Of Arts And Science, Special Edition 1 (1).
6. DuttaUttam, BasakAmit. Appraisal of financial performance of urban cooperative banks-a case study The Management Accountant, case study, 2008, 170-174.
7. Regi, S. B. Challenges Faced by the Select Urban Public Sector Bank Customer’s
While Using ATM/Debit Card–A Descriptive Analysis. In International conference on Recent Innovations in Engineering and Technology (p. 1). EduPedia Publications (P) Ltd.
8. Bhaskaran R, Praful Josh P. Non-Performing Assets (NPAs) in Co-operative Rural Financial System: A major challenge to rural development, BIRD‟s Eye View, 2000
Experimental Study on Bubble Deck Slab with Spherical
Hollow Balls
Y.Monika
Dr. Gopala Krishna Sastry K.V.S
Abstract
Concrete is the most important construction material. Slab is a major element of structure which consumes more concrete. The middle portion of slab does not perform any structural function. The concrete in the middle of slab can be reduced by inserting voids. Voids can be inserted by using hollow spherical balls. This new technology named as bubble deck slab.
Bubble deck slab is a reinforced concrete slab with spherical shaped bubbles. In this experimental program, reinforced concrete slabs are cast with and without spherical hollow balls of different diameter. The slabs are experimentally tested by line load applied along the length in central portion. Deflections are measured at different location, i.e. L/4, L/2 and 3L/4 with respect to loads. From this study it was concluded that bubble deck slab with 80mm diameter hollow bubble showed performance nearly equal to conventional slab with 10% saving in concrete.
Keywords: Bubble deck slab;Hollow spherical balls
1. Introduction
Concrete which is an artificial kind of stone, and is a most common construction material. Slab is one of the largest structural member consuming concrete. A concrete slab is a common structural element which is most often used in floors and ceiling constructions, supported by beams or walls. Slabs are of two types, when bends in one direction then it is referred as one way slab, while bends in two directions known as two way slab.
Deflection of slabs will be more when span of slab or load on slab is more. To reduce the deflection of slab, increasing thickness is one of the solutions, which leads to increase self-weight of slab. To overcome this issue Jorgen Bruenig invented the first biaxial slab system in 1990’s in Denmark.
Bubble deck slab is an in-situ slab which is created by inserting voids by using plastic hollow bubbles in the slab. These plastic bubbles can be made by waste plastic material, which make use of non-degradable waste plastic. The main use of these plastic hollow bubbles is to reduce dead weight of bubble deck floor slab by 1/3 to that of solid slab with same thickness [1]. Construction of Bubble deck floors can be 20% faster than traditional floor slabs. Construction cost of bubble deck slab can be reduced to maximum of 35% [2]. Voids in middle of slab eliminate 30 % to 50% of concrete which reduces self-weight [3-4]. Bubble deck slab did not influence crack pattern compared to solid slab, and punching resistance was smaller than solid deck slab [5]. In future if building is demolished, the spheres could be recycled. This technique reduces concrete usage in construction by 30% or more [6]. Surendar and Ranjitham [7] analyzed slabs numerically and experimentally
using the ANSYS software with appropriate support conditions that provide a uniformly distributed load, with bubble diameter of 100 mm. The stress and strain results were evaluated and compared with the bubble deck slab and the conventional slab. The following conclusion was made. The bubble slab offers much better performance than conventional slab, but there has been a slight variation in numerical investigations. The numerical and experimental results show that the bubble deck can withstand 75% of the load capacity compared to the conventional slab. Immanuel Joseph Chacko et al [8] conducted tests on slab using 60 mm and 65 mm diameter bubbles. They concluded that while Comparing bubble deck and conventional slab, performance of bubble deck slab with 60 mm diameter was good. Harshit varshney, et al [9] done a review study on bubble deck slab and stated that the durability of bubble deck slab was not essentially different from ordinary solid slabs and bubble deck achieves 17% to 39% higher thermal resistance than solid slab. Muhammad shafiq mushfiq and shikha saini [10] carried out an experimental study on bubble deck slab using 90 mm and 120 mm diameter bubbles. The results of the test showed negligible load capacity between them and the weight reduction of 10.55% and 17% using the bubble deck slab.
There is also number of advantages like use of recycled materials, lower energy consumption, reduction in total construction materials, reduced CO2 emission, less transportation that make bubble deck more environmental friendly than other concrete construction techniques .
The main aim of the present work is to investigate structural behavior of bubble deck slab.
2. Materials Used
The following are the materials used in the current experimental investigation
2.1 Cement: Ordinary Portland cement 53 grade (ultra tech brand) conforming to code IS: 12269-1987 having specific gravity of 3.13 was used.
2.2 Coarse Aggregate: The maximum size of coarse aggregate used in this project was of 20mm. Angular shaped coarse aggregate with specific gravity of 2.762 was obtained from the local crushing plants.
2.3 Fine Aggregate: In the present investigations, river sand available in the local area was used as fine aggregate having a specific gravity of 2.632. Fine aggregate used in this study falls under category zone- II
2.4 Water: Potable water has been used in this study for both mixing and curing.
2.5 Reinforcement: Steel bar of 8mm diameter of Fe415 grade was used.
2.6 Hollow plastic bubbles: Hollow plastic balls used here are made up of nonporous material and have enough strength and stiffness to bare load while casting. The hollow balls do not react chemically with steel and concrete. The ball diameters used in this project are 40mm, 60mm and 80mm.
2.7 Mix design: Mix design for M30 grade concrete was carried out using IS 10262:2009 code with water cement ratio 0.4. Mix proportions of M30 grade concrete are shown in Table 1
Table 1: Mix proportions of M30 grade concrete Cement in (kg) Coarse aggregate
(kg)
Fine aggregate(kg) Water (lit.)
3. Experimental Programme
3.1 Conventional slab
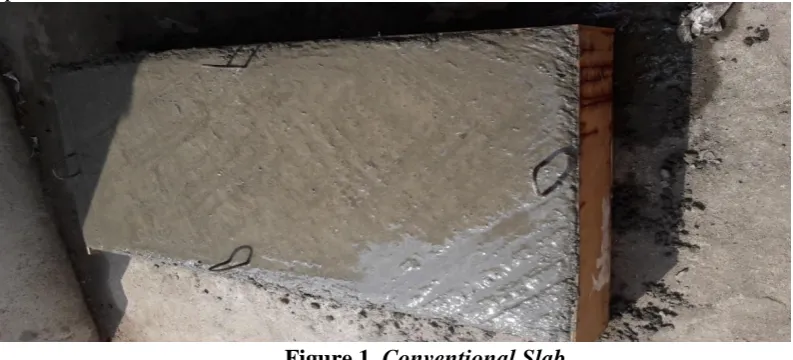
Rcc Slab was cast using wooden form work of inner dimensions 1.5m×0.7m×0.15m with Clear cover of 25mm. Compaction is done by using needle vibrator. 8mm diameter Fe415 grade steel bars were used at 270mm c/c in both directions as reinforcement. Fig.1 represents the conventional slab cast.
Figure 1. Conventional Slab
3.2 Slab with bubbles
Three Rcc slabs using Plastic balls of 40 mm, 60 mm and 80 mm diameter were cast separately, and were placed in tension zone as shown in Fig.2. Number of bubbles of each diameter used in bubble deck slab is shown in Table.2. Curing was done by ponding method for 28 days.
Figure 2. Slab with Bubbles
Table 2: Number of bubbles used in slabs
Sl.no. Samples Bubble diameter No. of spheres
1 Slab1 - -
2 Slab2 40mm 112
3 Slab3 60mm 78
3.3 Test setup
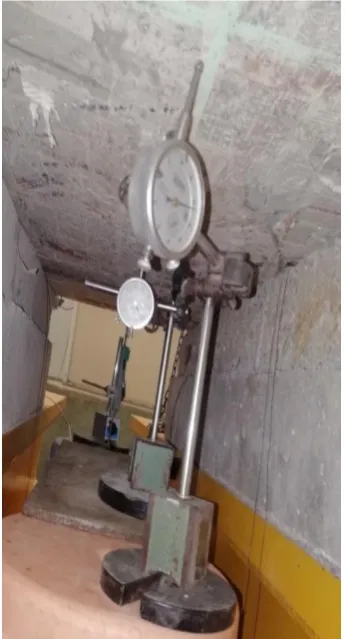
Rcc slabs were tested using 100T loading frame. Test setup is as shown in Fig.3. Supporting system of slabs were simply supported along two longer edges and loaded in central portion as line load, length wise as shown in Fig 3. Dial gauges and LVDT were used to measure deflections at L/4, L/2, 3L/4 and its arrangements are as shown in Fig 4. The deflections of slabs at respective places were measured at their mid span beneath the bottom face of the tested slab.
Figure 3. Test setup Figure 4. Arrangement of Deflectometers
And LVDT
4. Results and Discussion
It was observed that conventional slab had an ultimate load carrying capacity of 330 KN whereas slabs with 40 mm, 60 mm and 80 mm bubbles have 325 KN, 295 KN and 280 KN respectively. It was noticed that not much difference in load carrying capacities of conventional and bubble deck slabs.
It was observed that deflections in bubble deck slab with 80 mm diameter balls found to be less when compared with other bubble deck slabs and nearly equal to conventional slab. From the limited experimental study, it was observed that slab with 80mm diameter bubbles gives better results and are nearer to conventional slab.
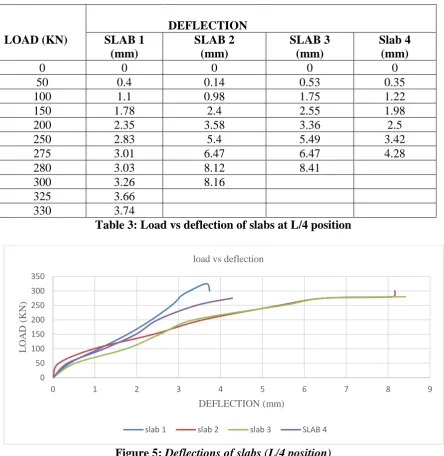
Load and deflection of all slabs with and without bubbles at L/4 are shown in Table 3. Load vs deflection graph at L/4 is plotted as shown in Fig5.
Table 3: Load vs deflection of slabs at L/4 position
Figure 5: Deflections of slabs (L/4 position)
Load vs deflection graph is plotted taking load on y-axis and deflections along x-axis. Deflection graph shows that slab without bubbles suffers less deflection among all category slabs. Slab 1 (conventional) and slab 4 (80mm diameter bubbles) shows similar pattern with less deflection whereas others have very large deflections.
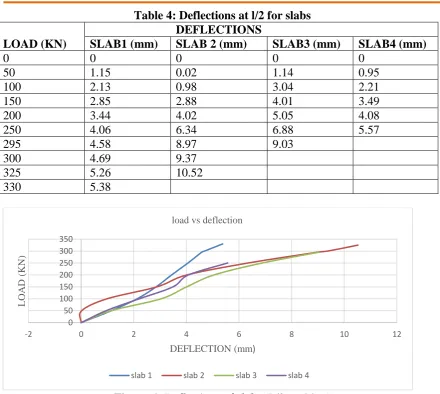
Table 4 shows Load and deflection values at a distance of l/2. Load vs deflection graph is represented in Fig 6.
0 50 100 150 200 250 300 350
0 1 2 3 4 5 6 7 8 9
L
OA
D
(KN)
DEFLECTION (mm) load vs deflection
slab 1 slab 2 slab 3 SLAB 4
DEFLECTION
LOAD (KN) SLAB 1
(mm)
SLAB 2 (mm)
SLAB 3 (mm)
Slab 4 (mm)
0 0 0 0 0
50 0.4 0.14 0.53 0.35
100 1.1 0.98 1.75 1.22
150 1.78 2.4 2.55 1.98
200 2.35 3.58 3.36 2.5
250 2.83 5.4 5.49 3.42
275 3.01 6.47 6.47 4.28
280 3.03 8.12 8.41
300 3.26 8.16
325 3.66
Table 4: Deflections at l/2 for slabs DEFLECTIONS
LOAD (KN) SLAB1 (mm) SLAB 2 (mm) SLAB3 (mm) SLAB4 (mm)
0 0 0 0 0
50 1.15 0.02 1.14 0.95
100 2.13 0.98 3.04 2.21
150 2.85 2.88 4.01 3.49
200 3.44 4.02 5.05 4.08
250 4.06 6.34 6.88 5.57
295 4.58 8.97 9.03
300 4.69 9.37
325 5.26 10.52
330 5.38
Figure 6: Deflections of slabs (L/2 position)
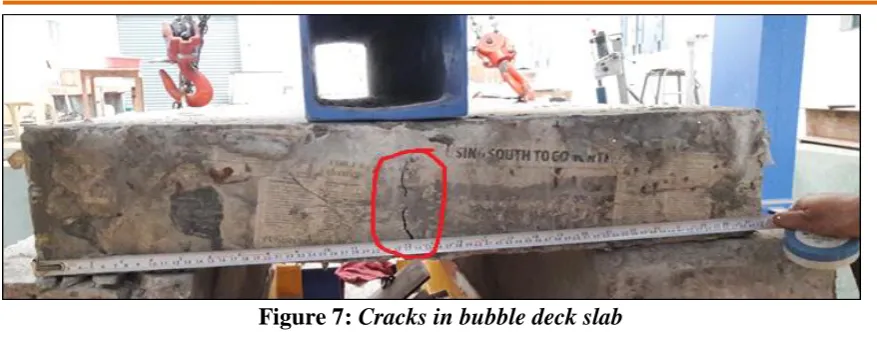
Load deflection pattern occurred at L/2 span was similar to pattern of L/4 span. Here also deflection of slab with 80mm diameter bubbles was less and nearer to conventional slab. Fig 7 shows the cracks developed at mid span in bubble deck slab. Weight of bubble deck slabs are reduced when compared to conventional slab. Percentage reduction in weight between conventional and bubble deck slabs are shown in Table 5. Maximum percentage reduction in weight is 10.66% in case of bubble deck slab with 80 mm diameter bubble besides maintaining strength and deflection criteria nearly equal to conventional slab. Weight reduction is important criteria to be observed in bubble deck slab. From the literature also, it was noticed that nearly 30% of weight reduction can also be possible using bigger size of bubbles.
0 50 100 150 200 250 300 350
-2 0 2 4 6 8 10 12
L
OA
D
(KN)
DEFLECTION (mm) load vs deflection
Figure 7: Cracks in bubble deck slab Table 5: Percentage weight reduction
5. Conclusion
From the limited experimental study carried out, following conclusion are made
1. Weight reduction can be achieved up to 10% compared to solid slabs
2. Bubble deck slab is new technology to be implemented avoiding cement and its products.
3. In bubble deck slab volume of concrete consumed is reduced, so that dead weight of slab decreased compared to conventional slab.
4. Deflection of bubble deck slab with 80mm diameter bubbles is nearly equal to that of conventional slab.
5. Maximum difference in load carrying capacity of bubble deck slab and conventional slab was found to be 17%.
6. References
[1] Neeraj Tiwari, Sana Zafar, “Structural behavior of bubble deck slabs and its application: Main paper”, International Journal for Scientific Research and Development vol. 4, Issue 02, 2016.
[2] Bhagyashri G.Bhade and S.M barelikar, “An experimental study on two way bubble deck slab with spherical hollow balls”, International Journal of Recent Scientific Research, vol: 7, Issue, 6, pp.11621-11626, 2016.
[3] K.R.Deepan, S.Saranya and S.Aswini, “Experimental study on bubble deck slab using polypropylene balls”, International Journal of Engineering Development and Research, volume 5, Issue 4, 2017.
[4] Arati Shetkar and Nagesh Hanche, “An experimental study on bubble deck slab system with elliptical balls”, proceedings of NCRIET-2015.
Specimen name Bubble
diameter used
Volume of concrete
Weight of slab % weight reduction
Slab1 - 0.1575 393.75 kg -
Slab2 40mm 0.1537 384.25 kg 2.4
Slab3 60mm 0.1487 371.75 kg 5.58
[5] Martina Schnellen bach-held, karsten pfeffer, “Punching behavior of biaxial hollow slabs”, Cement & Concrete Composites 24 551—556, 2002
[6] Rittik Bhowmik, Sourish Mukharjee, Aparna Das, “Review on bubble deck with spherical hollow balls”, International Journal of Civil Engineering and Technology Volume 8, Issue 8, pp.979-987, 2017.
[7] M.surendar , M.Ranjitham, “Numerical and experimental study on bubble deck slab, International Journal of Engineering Science and Computing, Volume 6 Issue No.5, 2016
[8] Er.immanuel joseph Chacko, Er.sneha M.varghese, “Study on Structural Behavior of Bubble Deck Slab using Indian Standards”, International Journal of Innovative Research In Technology, Volume 3 Issue 4, 2016.
[9] Harshit Varshney, Nithin Jauhari, and Himanshu Bhatt ,“A review on bubble deck slab”, International Journal For Research in Applied Science & Engineering Technology Volume 5, Issue X , 2017.
Financial Performance Evaluation of the Hyderabad District
Co-Operative Central Bank Ltd., Hyderabad (TS)– A Case
Study
Yasmeen Banu
Dr. Varun Kumar
Abstract
Co-operation is the universal instrument of creation .The principle of Cooperation is as old as human society.. The Cooperative banks and credit societies perform banking services among the exactly outlined framework of principles. This paper presents to review the expansion of the Hyderabad District Co-operative Central Bank Ltd., through selective indicators. To achieve the objectives of this paper, secondary data has been used. For analysis various statistical tools were applied. Analysis is focused on Deposits, credits outstanding, Borrowings, Investment, Capital, Reserves and Profit and losses of the HDCCB to evaluate the financial performance.
Keywords: Hyderabad District Co-operative Central Banks (HDCCBs), Deposits, Loan outstanding, Capital, Borrowings, Investment, Reserves and profit and Loss.
Introduction
A Co-operative Bank is a financial entity which belongs to its members, who are the owners and the customers of their bank. Simultaneously Cooperative banks and Credit Societies perform mainly banking services within the precisely defined framework of noble principles. Just like commercial banks, they accept all types of deposits and lend loans of different types usually to farmers and rural traders. The New Economic Policy, 1991, under the agreement established by World Trade Organization (WTO) came into force in 1995 brought Growth of District Co-operative Banks in India after New Economic Policy.
Definitions
Dr. C. R. Fay1 from the socio-economic standpoint defines co-operative society as “an
association for the purpose of joint trading, organizing among the weak & conducted always in an unselfish spirit, on such terms that all who are prepared to assume the duties of membership may share in its rewards in proportion to the degree in which they make use of their association.”
According to Mr. Herrick2 “Co-operation is the act of persons voluntarily united, of
utilizing reciprocally their own forces, resources, or both under their mutual management to their common profit or loss.”
Co-operative Banking Structure - A three tier Positioning
Source: Compiled by the Researcher
Hyderabad District Co-operative Central Bank(HDCCB)
The Hyderabad District Co-operative Central Bank was established on 20.12.1957 in Andhra Pradesh and operation began from 17.04.1958. The HDCCB at present is falls within the territorial jurisdiction of the newly formed 29th State of India the “TELANGANA STATE”. At present the bank serving two districts namely Hyderabad (Urban) and Ranga Reddy District. There is no Agricultural lending’s in Hyderabad District as there is no agriculture cultivation being Urban. Most of the Agricultural needs of the Ranga Reddy District are being met by the District Co-operative Central Bank (DCCB).
The Bank has been mobilizing funds by way of deposits from individuals, Institutions and Societies and borrowing funds from Telangana State Co-operative Apex Bank(TSCAB) in order to meet the credit needs of members Agriculturists, weavers, consumers, employees through respective Co-operative Societies.
HDCCB sanctions Loans for the following activities
The Bank has also extending credit to individual’s and for other activities
• Gold Loans
• Personal Loan,
• Non Farm Sector Loans
• Housing Loans
• CMEY
• Self Help Groups(Women)
• Weavers
• Agriculturists
• Consumers
• employees
• Education Loans.
A part from these facilities bank also extending facilities such as lockers, issue of Pay Orders & Demand Draft and other Banking Services. The network of HDCCB is through Twenty Six Branches.
HDCCB’s Network
HDCCB is working through its net work spread in two districts namely Hyderabad urban and Rangareddy districts. The State of Telangana has thirty one districts; however its operations are limited to two districts only. The banks net working is shown below:
1 •Apex at State level.
2 •District Co-operativeCentral Banks Ltd at District level
3
Source: The Hyderabad District Co-operative Central Bank handbook and Compiled by the Researcher
Review of Literature
Tirupathi Kanchu (2012) 3 in his research paper "Performance Evaluation of DCCBs in
India – A Case Study " examined the growth of DCCBs in India through selective indicators. It Analysis the deposits, credits and C/D ratios of DCCBs. This research paper also studies the growth of investment, working capital and cost of management which reflect the position in DCCBs.
Dr. Mrs. Ratna and K.Nimbalkar (2011)4 analyzed on “A Study of NPA's - Reference to Urban Co-Operative Banks” Focused on urban co-operative banks facing keen competition with public sector banks and private sector banks, particularly after globalization in 1991. At the same time these banks are facing the problem of Non-Performing Assets also.
Dr.Gurcharan Singh and Sukhmani (2011)5 studied on “An Analytical Study of
Productivity and Profitability of District Central Cooperative Banks in Punjab"
focused on evaluating performance of cooperative banks in the state of Punjab.
Kumar Sabina (2008)6 analyzed on “Management of Non-Performing Advances − A
Study of District Central Co-operative Banks of Punjab”. An Unpublished Ph.D Thesis, Submitted to HP University, Shimla. Study based on a sample of ten DCCBs, i.e., five with high level of NPAs and five with low level of NPAs, was taken for the study.
HYDERABAD DISTRICT(Urban)
NAMPALLY BRANCH(HEAD OFFICE)
MADANNAPET BRANCH
WEST MARREDPALLY BRANCH
BAHADUR PURA BRANCH(ATTAPUR)
RANGA REDDY DISTRICT
A.HYDERABAD (Rural)
1. HAYAT NAGAR BRANCH 2. IBRAHIMPATNAM BRANCH 3. MAHESHWARAM BRANCH 4. VANASTHALIIPURAM BRANCH 5. BALAPUR X ROAD 6. RAMANTHAPUR
B. CHEVELLA DIVISION (Rural)
1. CHEVELLA BRANCH 2. SHANKARPALLY 3. MEDCHAL BRANCH 4. KUKATPALLY BRANCH 5. SANATHNAGAR BRANCH 6. KARWAN BRANCH 7. VASANTHNAGAR
C. VIKARABAD DIVISION (Rural)
Dutta Uttam and Basak Amit (2008)7 “Appraisal of financial performance of urban
cooperative banks- a case study.” The Management Accountant, case study, in his paper suggested that Co-operative banks should improve their recovery performance, adopt new system of computerized monitoring of loans, implement proper prudential norms and organize regular workshops to sustain in the competitive banking environment.
Harish Kumar Singla (2008)8 "Financial performance of banks in India", emphasized on financial management and examined the financial position of sixteen banks by considering profitability, capital adequacy, debt-equity and NPA.
Pal and Malik (2007)9 investigated the differences in the financial characteristics of 74 banks in India based on factors, such as profitability, liquidity, risk and efficiency. It is suggested that foreign banks were better performers, as compared to other two categories of banks, in general and in terms of utilization of resources in particular.
Singh and Singh (2006)10 studied on Funds Management in DCCBs of Punjab with special reference to analysis of financial margin. It noted that higher performance of own funds and the recovery concerns have resulted in increasing margin to the Cooperative Banks.
Mavaluri, Boppana and Nagarjuna (2006)11 suggested that performance of banking in terms of probability, productivity, asset quality and financial management has become important to stable the economy. They found that public sector banks have been more efficient than other banks operating in India.
According to Wim Fonteyne12, explains the continuing success of Co-operative Banks in European Countries through evolving comparative advantages. The paper concludes that some form of independent external oversight of corporate governance is warranted and that cooperatives need mechanisms enabling them to better manage their capital.
Objective of the Study
The study is based on the following objectives:
✓ To evaluate the growth of the HDCCB through selective indicators.
✓ To analyze the Deposits, credits outstanding, Borrowings, Investment, Capital and Reserves of the HDCCB.
Methodology of the Study
The methodology of the present study is based on secondary data, collected from NABARD, RBI bulletins, Government of India reports and online sources like TSCAB.org, Hyderabaddccb.org, NAFCOB etc. Covering a period of 2006-2016 i.e a period of ten years.
Statistical Tools
For the purpose of analysis of the data, various statistical tools like Mean, Standard Deviation, Covariance, CAGR, etc., were used to arrive at scientific conclusion.
Analysis of the Study
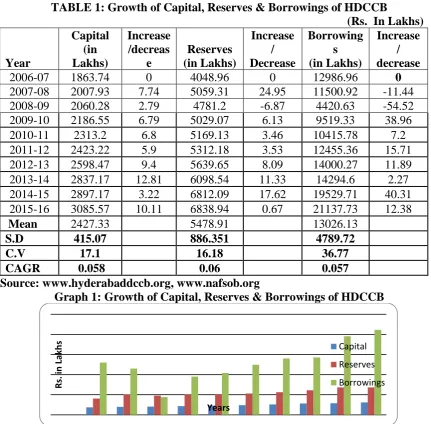
TABLE 1: Growth of Capital, Reserves & Borrowings of HDCCB
(Rs. In Lakhs)
Year
Capital (in Lakhs)
Increase /decreas
e
Reserves (in Lakhs)
Increase / Decrease
Borrowing s (in Lakhs)
Increase / decrease
2006-07 1863.74 0 4048.96 0 12986.96 0
2007-08 2007.93 7.74 5059.31 24.95 11500.92 -11.44
2008-09 2060.28 2.79 4781.2 -6.87 4420.63 -54.52
2009-10 2186.55 6.79 5029.07 6.13 9519.33 38.96
2010-11 2313.2 6.8 5169.13 3.46 10415.78 7.2
2011-12 2423.22 5.9 5312.18 3.53 12455.36 15.71
2012-13 2598.47 9.4 5639.65 8.09 14000.27 11.89
2013-14 2837.17 12.81 6098.54 11.33 14294.6 2.27
2014-15 2897.17 3.22 6812.09 17.62 19529.71 40.31
2015-16 3085.57 10.11 6838.94 0.67 21137.73 12.38
Mean 2427.33 5478.91 13026.13
S.D 415.07 886.351 4789.72
C.V 17.1 16.18 36.77
CAGR 0.058 0.06 0.057
Source: www.hyderabaddccb.org, www.nafsob.org
Graph 1: Growth of Capital, Reserves & Borrowings of HDCCB
Table 1: reveals that Capital, Reserves & Borrowings of HDCCB, during the year from 2006-07 to 2015-16. During the study period it is found that every year Capital is increased. Average Capital during the year is 2427.33 and Compound Annual Growth rate is 0.057, Standard Deviation and CV are 415.07 and 17.10 respectively. Reserves fluctuate in 2008-09 is 4781.20. Average Reserves during the year is 5478.91 Compound Annual Growth rate is 0.059, Standard Deviation and CV are 886.351 and 16.18 respectively .During the study period Borrowings is fluctuate in the year 2007-08 and 2008-09 is 11500.92 and 4420.63. Average Borrowings during the study period is 13026.13. Compound Annual Growth rate is 0.0556, Standard Deviation and CV are 4789.72 and 36.72 respectively. As compare to Capital and Reserves, Borrowings are more consistences.
It is observed from the table above that Capital is being contributed by the members is showing an upward trend during the study period, and the membership is also increasing every year. This shows a positive trend. This enables for further expansion of its operations.
R
s.
in
Lak
h
s
Years
Capital
Reserves
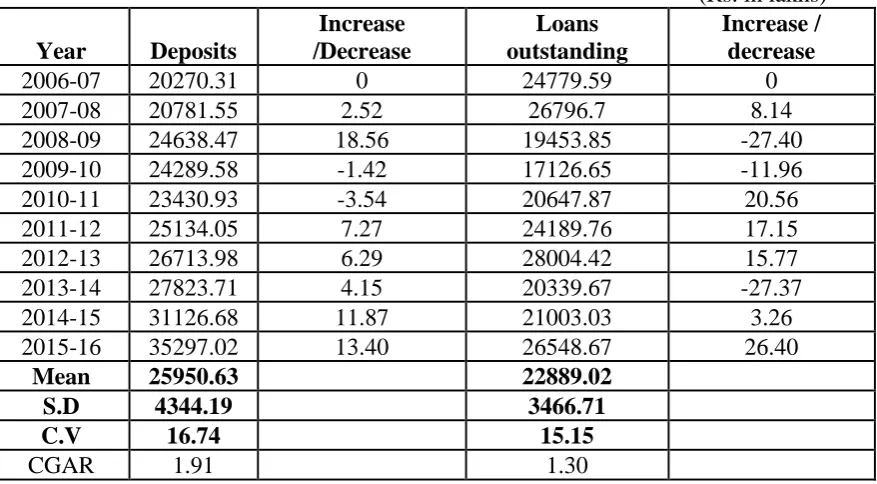
TABLE 2: DEPOSITS AND LOAN OUTSTANDING OF THE HYDERABAD DCCB LTD.
(Rs. in lakhs)
Year Deposits
Increase /Decrease
Loans outstanding
Increase / decrease
2006-07 20270.31 0 24779.59 0
2007-08 20781.55 2.52 26796.7 8.14
2008-09 24638.47 18.56 19453.85 -27.40
2009-10 24289.58 -1.42 17126.65 -11.96
2010-11 23430.93 -3.54 20647.87 20.56
2011-12 25134.05 7.27 24189.76 17.15
2012-13 26713.98 6.29 28004.42 15.77
2013-14 27823.71 4.15 20339.67 -27.37
2014-15 31126.68 11.87 21003.03 3.26
2015-16 35297.02 13.40 26548.67 26.40
Mean 25950.63 22889.02
S.D 4344.19 3466.71
C.V 16.74 15.15
CGAR 1.91 1.30
Source : : http://www.tscab.org ; http://www.hyderabaddccb.org; www.nafsob.org
GRAPH 2: DEPOSITS AND LOANS OUTSTANDING POSITION IN HYDERABAD DCCB LTD.
Interpretation
Table 2: The above table depicted that during the year 2006-07 the Deposits decrease 1.42% in the year 2009-10. In the year 2010-11 again it decrease up to 3.54% .During the study period deposit highest increase is 13.40% .The mobilization of deposits have been increased gradually during the study period, and the average deposits mobilized by bank is 25950.63.Standard Deviation and CV is 4344.19 and 16.74 respectively. Annual Compound Growth rate is 1.91. Whereas Loan outstanding of HDCCBs gradually decreases in the year 2008-09, 2009-10 &2013-2014 with a percentage is 27.40%, 11.96% & 37.37%. During the year 2015-16 it was increases up to 26.40%. The average of loan outstanding is 22889.02, Standard Deviation and CV is 3466.71 and 15.15%. Annual Compound Growth rate is 1.30.
R
S. IN
LAK
H
S
YEAR
Deposits
TABLE 3: Growth of Investments by the Hyderabad DCCB Ltd.
(Rs. in lakhs)
GRAPH 3: Growth of Investments by the Hyderabad DCCB Ltd.
Interpretation
Table 3: Hyderabad DCCB Ltd. has been investing it’s funds in different avenues like Govt. Securities, Other trustee securities, purchasing Debentures of Land Development Banks, fixed deposits and other investments. The growth pattern of investment by the HDCCB Ltd., the investment in 2006-07 is Rs. 6763.68 lakhs and it has been recorded Rs. 16762.81 lakhs in the year 2008-09 with a growth rate 107.16%. The average investment of the bank is 17609.52 lakhs during the study period. The Standard Deviation is 6052.05 and the C.V is 34.37.The Average Compound Growth rate is 0.17.
R
S. IN
LA
K
H
S
YEARS INVESTMENT
2006-07
2007-08
2008-09
2009-10
2010-11
2011-12
2012-13
2013-14
2014-15
Year INVESTMENT Increase / Decrease
2006-07 6763.68 nil
2007-08 8091.76 19.64
2008-09 16762.81 107.16
2009-10 21786.62 29.97
2010-11 19211.26 -11.82
2011-12 19721.59 2.66
2012-13 19821.46 0.51
2013-14 18419 -7.08
2014-15 18419 0.00
2015-16 27098 47.12
Mean 17609.52
S.D 6052.05
C.V 34.37
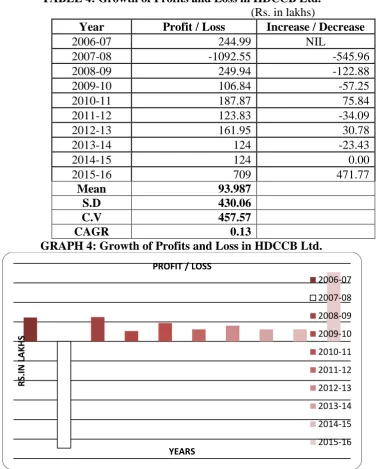
TABLE 4: Growth of Profits and Loss in HDCCB Ltd.
(Rs. in lakhs)
Year Profit / Loss Increase / Decrease
2006-07 244.99 NIL
2007-08 -1092.55 -545.96
2008-09 249.94 -122.88
2009-10 106.84 -57.25
2010-11 187.87 75.84
2011-12 123.83 -34.09
2012-13 161.95 30.78
2013-14 124 -23.43
2014-15 124 0.00
2015-16 709 471.77
Mean 93.987
S.D 430.06
C.V 457.57
CAGR 0.13
GRAPH 4: Growth of Profits and Loss in HDCCB Ltd.
Interpretation
Table 4: reveal growth pattern of profits in H DCCB Ltd., the profit in 2006-07 is Rs. 244.99 lakhs and during the year 2007-08 Bank have very huge loss is Rs. 1092.55 lakhs in 2007-08, afterwards it has been increased and decrease year by year and recorded Rs. 706 lakhs in the year 2015-16 with a growth rate 471.77% .The average profit of the bank is 93.987 lakhs during the study period. The Standard Deviation is 430.06 lakhs and the C.V is 457.57. The Average Compound Growth rate is 0.13 which is very low.
Findings
• The members of the bank increased through its membership which resulted in the increase of capital. The share of State Government is minimal.
• The Bank should maintain the minimum liquidity of 15%, which it is often failing.
R
S.I
N
LAK
H
S
YEARS PROFIT / LOSS
2006-07
2007-08
2008-09
2009-10
2010-11
2011-12
2012-13
2013-14
2014-15
• Borrowing by members can be expanded by restructuring the interest rate policy & term period.
• The deposit mobilization can be increased by expanding its operations in the other districts of Telangana.
• Investment policy of the bank is safe.
Suggestions
• Since Government share in the total capital of the Bank is nominal. The main purpose of the keeping Government share in the total capital of the Bank is to build-up confidence among the public.
• The Bank should start deposit schemes such as kiddy banks, Weekly saving schemes, Daily saving schemes, Women Deposit schemes, Student deposit schemes, Marriage deposit schemes, Pension deposit schemes, Reinvestment deposit scheme etc.,
• The Bank should try to upgrade technology. It should adopt the modern methods of banking like internet banking, credit cards, ATM, etc.
• The Bank should open a separate department to take the responsibility of expanding the banking business, conducting the marketing surveys, publicity, improving the public relations etc.,
Conclusion
The financial performance of Hyderabad District Co-operative Central bank Ltd., can have improved performance by spreading it to all the new districts of the state, as a result it can maintain the prescribed percentage of reserves, deposit mobilization increases by increasing the interest rates on fixed deposits and safe investments makes the bank operations successful and increases its profitability, as of now it has a satisfactory performance during the study period, as a final say it has a great scope to improve and expand its operations during the study period.
References
1. C.R. Fay, Cooperation at home and abroad, 1948, P.- 5.
2. M-T. Herrick, Rural Credit, P.- 247.
3. Tirupathi Kanchu, (2012). "Performance Evaluation of DCCBs in India - A Study",
Asia Pacific Journal of Marketing and Management Review, Vol.1, No.2, October 2012, ISSN2319-2836 page no.169-180.
4. Dr. Mrs. Ratna and K.Nimbalkar (2011) “A Study of NPA‟s - Reference To Urban
Co-Operative Bank”, Golden Research Thoughts, Vol.1, Issue.VI Dec 2011.
5. Dr.Gurcharan Singh and Sukhmani (2011). “An Analytical Study of Productivity And
Profitability Of District Central Cooperative Banks In Punjab", Journal on Banking Financial services and Insurance Research, Vol. 1 Issue 3 (June2011), pp. 128-142.
6. Kumar, Sabina (2008). "Management of Non-Performing Advances−A Study of District Central Co-operative Banks of Punjab", An Unpublished Ph.D Thesis, Submitted to HP University, Shimla.
7. Dutta Uttam and Basak Amit (2008). “Appraisal of financial performance of urban
cooperative banks- a case study.” The Management Accountant, case study, March 2008, 170-174.
8. Harish Kumar Singla (2008). "Financial performance of banks in India", The ICFAI Journal of Management, Vol. 7, Issue 1.
10.Fulbag Singh and Balwinder Singh (2006). "Funds management in the central cooperative banks of Punjab- an analysis of financial margin", The ICFAI Journal of Management, Vol. 5, 74-80.
11.Vijay Mavaluri, Pradeep Boppana and Nagarjuna (2006). "Measurement of efficiency of banks in India", University Library of Munich, Germany, MPRA Paper 17350, Aug 2006.
12.Wim Fonteyne (2007). "Cooperative Banks in Europe-Policy Issues", IMF Working Paper, European Department, July 2007.
13.Jyoti Gupta, Suman Jain (2012). " A study on Cooperative Banks in India with special reference to Lending Practices”, International Journal of Scientific and Research Publications,Volume 2, Issue 10, Page No 1-6.
14.Oliver Wyman (2014). "Co-operative Banking Leveraging The Cooperative Difference to Adapt to a New Environment", 2014.
15.Rajamohan and Pasupathy (2009) in their study titled, “Performance Evaluation of
Tamil Nadu Industrial Co-operative Bank Ltd. (TAICO) − An Application of Structural and Growth Analysis” Indian Co-operative Review, Vol.XXXXVII (Oct.), No.2, New Delhi.
16.KC Shekhar and Lekshmy Shekhar (2007). ‘Banking Theory and Practice’, Nineteenth edition, reprint 2007, vikas publishing house Pvt. Ltd.(India), Chapter:16, PP.365-374.
17.Geeta Sharma and Ganesh Kawadia (2006). “Efficiency of Urban Co-operative Banks of Maharashtra: A DEA Analysis”, The ICFAI Journal of Management, Vol. 5, Issue 4.
18.Kothari C.R. Business Research methods, Vikas Publications, New Delhi, 2010. p. 245.
19.Annual Reports of HDCCB Ltd., Nampally, Hyderabad.
20.http://www.tscab.org
21.http://www.hyderabaddccb.org
22.www.rbi.org
Environmental Awareness among Prospective Teachers and
Prospective Managers: A Comparative Study
MANMOHAN GUPTA
Abstract
Air and water pollution have reached such levels that have already resulted in serious health problems, as well as negative impact on the environment, and inevitably influencing prospects for long term economic growth (Krishnamacharayulu and Reddy, 2005). Environmental problems are not the problems of India only but the whole globe is facing this problem. It is very important to make the whole society conscious about environment. Education is a magical medium for changing human’s behavior. Undoubtedly, education plays a very important role in human’s lfe. Environmental education is the study of man to see that how he shapes his total natural and cultural surrounding for good or ill. The philosophy of environmental education asserts that man is an integral and inseparable component of the environment and eco-system. He interacts with biotic and abiotic environment. An understanding of biotic and abiotic environment i.e. eco-system is necessary in order to keep is living sustainable such as understanding could be made possible through an education system which clearly explains the structure and function eco-system and its management. It is only environmental education which can make human beings conscious about environment and environmental problems.
Key words:- environmental awareness, prospective teachers, prospective managers
Introduction
Human beings live on earth and earth’s environment is created by all living and non living components. All the factors of the environment are flexible and keep changing continuously. In recent years, due to the development of technology, our environment is getting disturbed. It has now been accepted that the main cause of environmental degradation is depletion of natural resources. This situation is not only facing by India but the whole globe is affected by this problem. Our country India is a developing nation. But problems are also becoming larger in size. In the age of technological revolution, the needs of human being are increasing fast. The human being is destroying the nature. Because of this, human being is facing the drought, floods, earthquake etc. All these problems created drastic conditions for human beings to survive on the earth (Gohar et.al, 2005). Plastic has become a very important part of man’s life. It is the material, which is used from a pen refill to parts of an aeroplane. Today we are using bottles, packaging and poly bags in daily life. But this plastic is polluting our environment. Environmental problems have reached up to a level where almost every one is conscious of theme. Thisraising consciousness has also given rise to wide speed responsiveness to the idea for the need to do something about it (Chhokar, 2000).
Thus prospective teachers must have awareness about environment. Because the future of a country depends on how aware PT’s are towards environmental problems. Similarly, managers have the responsibility of producing eco friendly products. They must know how
and to what extent unplanned production can devastate the environment. Thus prospective managers have to be aware about environment as much as PT’s are be. Hence it is necessary to know how far the prospective teachers and prospective managers are aware about environment and environmental problems.
Significance of the Study
Man is a very important part of environment. He is an inseparable component of environment and eco-system (Reddy 1998). The system has become from five elements- air, water, land, flora and fauna. But today our environment is getting polluted. Human beings can not live a normal life without clean and healthy environment. We are cutting forests, destroying vegetation resulting in changed weather conditions, causing draughts, floods and extinction of rare species of plants animals and birds (Thakur, 1999). Various kinds of environmental pollution are created by human being. Human civilization is solely responsible for various kinds of environmental pollution like noise pollution, air pollution, water pollution etc. Various policy has been adopted from time to time to control it. The researcher feels that the best technique to control the pollution is creating awareness among the society. The level of awareness among society will decide the level of control on environmental pollution. In the proposed study, an attempt will be made to analyse the awareness level relating to environment among prospective teachers and prospective managers.
Statement of the Problem
The problem of proposed study may be stated as:
“Environmental Awareness among Prospective Teachers and Prospective Managers: A comparative study”
Objectives
The present study was based on the following objectives:
(1) To study the Environmental awareness among prospective teachers and prospective managers.
(2) To investigate the environmental awareness of male prospective teachers and male prospective managers.
(3) To assess the environmental awareness of female prospective teachers and female prospective managers.
(4) To compare the environmental awareness of rural background prospective teachers and rural background prospective managers.
(5) To study the environmental awareness of urban background prospective teachers and urban background prospective managers.
(6) To compare the environmental awareness of prospective teachers and prospective managers having graduation qualification.
(7) To investigate the environmental awareness of prospective teachers and prospective managers having post graduation qualification.
Hypotheses
The present study was based on the basis of following hypotheses:
1. There is no significant difference between the level of environmental awareness of prospective teachers and prospective managers.
3. There is no significant difference between the environmental awareness of female prospective teachers and female prospective managers.
4. There is no significant difference between the environmental awareness of rural background prospective teachers and rural background prospective managers.
5. There is no significant difference between the environmental awareness of urban background prospective teachers and urban background prospective managers.
6. There is no significant difference between the environmental awareness of prospective teachers and prospective managers having graduation qualification.
7. There is no significant difference between the environmental awareness of prospective teachers and prospective managers having post graduation qualification.
Review of Related Literature
Gihar&Saxena (2008) in their study conducted that in all programmers that in at promoting environmental awareness greater attention must be given to rural women. As the level of education among rural woman is generally lower than that of urban woman the curriculum and the methods of transacting, it will have to be suitably adopted. The researchers suggested that non formal methods will be more appropriate for them.
Saxena&Gihar (2010) conducted a study to investigate the environmental consciousness among senior secondary students of Ghaziabad district of Uttar Pradesh state. The researcher concluded that urban students have scored higher mean values than their rural counterparts in respect to their consciousness level about environmental pollution and protection.
Kalpana Thakur (2012) conducted a study on Environmental awareness among senior secondary school students of Chandigarh. The study was conducted on the sample of 200 senior secondary students from four schools of Chandigarh and data was collected through descriptive survey method. The major findings were 1.Students of government and private schools exhibited comparable environmental awareness.2. Science students exhibited very high degree of environmental awareness than students opting for humanities.3. Male science students exhibited higher degree of environmental awareness than female science students but overall no significant difference was found between male and female students. From a more global perspective, gender differences in environmental attitude at higher education level have converged on females that are more sensitive toward environmental issues. For example, Fernandez- Manzanal et al. (2007) revealed that female students have higher scores than male students on the attitudes scale, especially in the factors of the need for conservation and environmentally favorable behavior.
Research Design Methodology
The present study was descriptive in nature; therefore, the survey method is adopted to collect the data.
Population
All the students studying in B.Ed. course and MBA course being offered by colleges situated in Saharanpur District will constitute the population for present study.
Sample and Sampling Technique