Impact of the Relevant Dimensions in the
Corporate Identity of a Public Higher Education
Institution
Nadia Dessupoio1 Paulo Roberto da Costa Vieira2
Irene Raguenet Troccoli3 1
Universidade Federal Fluminense 2, 3
Universidade Estácio de Sá
Abstract –
This research tests the impact of pre-defined constructs "communication and visual identity", "behavior" and "corporate culture" on the corporate identity of a public higher education institution, through a survey using a structured questionnaire and a Likert scale five-response-option. The sample consisted of 203 teachers from a Brazilian public higher education institution. Primary data were analyzed using structural equation modeling with partial least squares technique. The results showed statistical significance and indicated that the construct "behavior" has the greatest impact on the identity of the university. The other constructs, "corporate culture" and "communication and visual identity", in that order of importance, also achieved positive impact coefficients for the identity of the institution. The results confirmed that the model is consistent and can be used in future researches.
Keywords: Corporate identity, Public higher education institution, Structural equation modeling.
1 INTRODUCTION
Corporate identity is the shared meaning of the corporation among its members over what is central, distinctive, and enduring in the company (Albert & Whetten, 1985; Cornelissen et al., 2007). Such qualities are explained as follows: “centrality” indicates the characteristics seen as the essence of the company; “distinctiveness” refers to the elements that would distinguish one firm from the others; and “temporal continuity” highlights the characteristics that are stable over time (Albert & Whetten, 1985).
Corporate identity plays a strategic role and can be used to generate competitive advantage (Suvatjis et al., 2012). Thus, two consequences follow. First, it must be managed in a way that inspires confidence in the company and satisfies the needs of the most important stakeholders, especially internal members (Van Riel, 1995). Secondly, when projected into the external environment of the corporation, it contributes significantly to the construction of the corporate image (Abratt & Kleyn, 2012; Oliva & Prieto, 2015).
It is in this context that corporations need to strengthen their corporate identity. By highlighting their rare and positive characteristics, they can project a solid corporate image, since the causal link between corporate identity and image was empirically supported by evidence indicating the influence of the first on the second (Vieira et al., 2014).
In a broader perspective, one can understand that these phenomena are not limited to the universe of corporations, but also in the case of higher education institutions (HEIs), with a considerable number of them already having developed and implemented corporate identity projects allied to their growth and expansion programs (Baker & Balmer, 1997).
In fact, the corporate identity of a HEI - whether public or private - is a powerful source of competitive advantage: when it is solid, it can revert to a more favorable corporate image, attracting top researchers and scholars to the institution (Chunyan et al., 2015; Oliva & Prieto, 2015) and allowing greater channeling of resources (Baker & Balmer, 1997).
Considering HEIs do not sell tangible products, their capacity to attract resources is directly influenced by the importance of their distinctive features, which constitute their identity and influence their ability to promote positive associations in their most important stakeholders (Baker & Balmer, 1997). In view of this, public HEIs should draw attention on how they communicate and how they build meaning for their stakeholders.
Researchers Melewar and Jenkins (2002) proposed that building and maintaining the strong image of a public HEI in the educational market can arise from "communication and visual identity", "behavior", "corporate culture" and "market conditions" as creators of corporate identity. This motivated the present research, aimed at testing the impact of the first three dimensions in the corporate identity of a public HEI.
its constituent dimensions. After that, the research method that was used is presented, as well as the analysis of the primary data, and the conclusion of the research.
2 THEORETICAL REFERENCES
Based on an extensive literature review that addresses the definition and the identification of the corporate identity construct, Melewar and Jenkins (2002) developed a model that represents one of the most comprehensive frameworks of corporate identity (Batraga & Rutitis, 2012), since it contemplates the explanatory dimensions of this construct by means of the definition of the observed variables that have impact over it. In other words, Melewar and Jenkins (2002) sought not only to encompass the aspects of corporate identity holistically, but also to provide conditions that would subsidize empirical verifications by researchers in Marketing. In addition, their model became multidisciplinary, as it identified sub-constructs such as "communication and visual identity", "behavior" and "corporate culture" to determine corporate identity.
It is worth noting that, in its original structure, the model includes the sub-structure "market conditions" as a factor that affects corporate identity. However, we did not consider this structure in the present research, because it was carried out in a public HEI, which presents a distinct reality from the for-profit HEIs - the latter operates through strategic policies aimed at conquering educational markets that raise the margin of profit through the monthly fees charged, and that, consequently, offer greater returns on investments.
Based on this adaptation, the form of the model used in this research is shown in Figure 1.
Figure 1 - The corporate identity model
Source: Adapted from Melewar and Jenkins (2002, p.81)
2.1 “Corporate Identity” Construct
The term “corporate identity” has received increasing academic attention since its creation over 50 years ago with Lippincott and Margulies (1957, apud Abdullah et al., 2013).
In Marketing literature, corporate identity is a company's self-presentation, being projected to the outside world, highlighting the strategic role it plays in strengthening the firm's position in increasingly competitive markets (Balmer, 2001; Melewar & Jenkins, 2002; Melewar & Karaosmanoglu, 2006).
The goal of corporate identity management would be the strategically planned presentation of itself, with the intent of producing a positive image in the minds of its audience (Gray & Balmer , 1998). That is, how the influence of positive and negative aspects on the corporation comes from the public's perception of the essence of institution, the identity can be used as an effective tool in strategic management.
2.2 “Corporate Identity” Dimensions
The present research was inspired by the theoretical model of Melewar and Jenkins (2002), that affirms that corporate identity is determined by certain sub-constructs, also called dimensions: "communication and visual identity"; "behavior"; and "corporate culture". This model represents one of the most comprehensive frameworks of corporate identity (Batraga & Rutitis, 2012).
On the other hand, although literature review shows that there is a very limited availability of research related to corporate identity in universities, in a number of studies on corporate identity in this type of institution (Mohamad et al., 2007; Melewar & Akel, 2005) we can observe the influence of Melewar and Jenkins (2002) theoretical model.
Corporate communication is the activity that encompasses every way in which the company connects with its stakeholders, making the latter understand the identity of a corporation (Balmer & Gray, 2000). Thus, all messages coming from a company, everything it produces and the activities it involves will act to shape the perceptions of its stakeholders. Communication is present in all corporate activities and plays a major role in the performance of work groups, preserving and reinforcing corporate identity, or as the engine that drives the firm towards the desired transformations (Baldissera, 2000).
“Identity” is responsible for solidifying the corporate philosophy that expresses the essential values of the company, usually reflected in the vision and mission of the corporation. Thus, understanding corporate identity implies considering the scope of cultural influence, since cultural elements have a strong impact on values (Abdullah et al., 2013).
Visual identity is the term that describes a large number of visual clues associated with a company, relating to the physical and graphic dimensions of corporate identity (Melewar & Karaosmanoglu, 2006). That is, visual identity comprises the set of signs that translate – graphically - the corporate essence and are applied according to a pattern of corporate identity that determines its uses and applications in different circumstances. Corporate design, which relates to the corporate visual identity, supports corporate communication, both externally and internally, as well as being an important aspect of the stakeholder's perception of the company's values and philosophy (Melewar & Karaosmanoglu, 2006).
“Behavior” is an intangible aspect of corporate identity, related to how the corporation and its members operate. It is made up of attitudes and actions, both planned and spontaneous ones. By influencing and shaping the perceptions of suppliers, customers and even employees, behavior impacts on the perception of what the company is (Melewar & Karaosmanoglu, 2006).
It is worth noting that behavior, while a constituent dimension of corporate identity, also refers to actions by the corporation. This manifests itself in several ways, such as the functional point of view, linking back to its production, administration, technological and commercial policies (Minguez, 2000).
“Corporate culture” is a set of values and beliefs specific to a particular corporation, translated into habits, rites, myths, taboos, corporate mentality, creations, style of leadership, disruptions and recodifications, and which performs the identity aspects that make a corporation unique, setting it apart from other institutions (Baldissera, 2000).
3 METHOD
This quantitative descriptive research was done through a literature review and a field study that encompassed a survey (Martins & Theóphilo, 2009). Primary data were collected using a self-administered questionnaire (Vergara, 2007; Gil, 2010) with 20 closed questions, which referred to the four latent variables ("communication and visual identity", "behavior", "culture corporate ", and" corporate identity"), with response options based on the Likert scale of five response options, ranging from "totally disagree" to "totally agree".
Among the population represented by the group of the teachers that compose the teaching staff of public Brazilian HEIs, we selected a non-probabilistic sample for convenience and accessibility to one of these institutions, located in the southeast region and made up of 203 teachers.
The primary data were treated with structural equations modeling (SEM), considering that the SEM measurement theory, with Partial Least Squares (PLS), specifies how the constructs are evaluated. Generally, there are two distinct ways of measuring the observed variables (or indicators). One is considered a reflective measurement; and the other is a formative measurement (Hair Jr. et al., 2014). A latent variable causes the reflective measures, that is, they represent a manifestation of the construct. The formative measures are characterized by the occurrence of causal relations of the manifest variables to the latent variable (Wong, 2013).
presumably explained by the constructs, having taken into account the following considerations concerning the variable types, which usually participate in SEM (Hair Jr. et al., 2014):
1) Latent variables (or constructs) cannot be observed or measured directly and we should estimate it indirectly through the variables observed through their representative and essential characteristics, and their multiple facets. In SEM, the latent exogenous variables are the constructs that explain other constructs in the model, whereas the endogenous latent variables are the constructs explained in the model, namely, they represent the effects of other variables (Wong, 2013).
2) Observed variables: those that are effectively measured and are, when the measurement is reflective, considered dependent on the constructs. They are also commonly referred as manifest variables or indicators (Hair Jr. et al., 2014).
The model of the present research contains four latent variables: 1) CVI: latent variable that represents the "Communication and Visual Identity" of the institution; 2) COMP: latent variable that represents "Behavior"; 3) Cult: latent variable that represents the “Corporate Culture"; 4) CI: latent variable that represents the "Corporate Identity ";
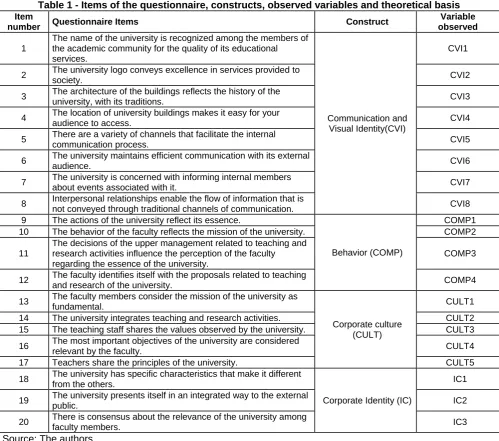
We followed Hair Jr. et al. (2009) recommendations to define the minimum of three observed variables per construct (latent variable). With that in mind, 20 observed variables were used preliminarily. Their questionnaire items and associated constructs are described in Table 1.
Table 1 - Items of the questionnaire, constructs, observed variables andtheoreticalbasis Item
number Questionnaire Items Construct
Variable observed
1
The name of the university is recognized among the members of the academic community for the quality of its educational services.
Communication and Visual Identity(CVI)
CVI1 2 The university logo conveys excellence in services provided to
society. CVI2
3 The architecture of the buildings reflects the history of the
university, with its traditions. CVI3 4 The location of university buildings makes it easy for your
audience to access. CVI4
5 There are a variety of channels that facilitate the internal
communication process. CVI5 6 The university maintains efficient communication with its external
audience. CVI6
7 The university is concerned with informing internal members
about events associated with it. CVI7 8 Interpersonal relationships enable the flow of information that is
not conveyed through traditional channels of communication. CVI8 9 The actions of the university reflect its essence.
Behavior (COMP)
COMP1 10 The behavior of the faculty reflects the mission of the university. COMP2 11
The decisions of the upper management related to teaching and research activities influence the perception of the faculty regarding the essence of the university.
COMP3 12 The faculty identifies itself with the proposals related to teaching
and research of the university. COMP4 13 The faculty members consider the mission of the university as
fundamental.
Corporate culture (CULT)
CULT1 14 The university integrates teaching and research activities. CULT2 15 The teaching staff shares the values observed by the university. CULT3 16 The most important objectives of the university are considered
relevant by the faculty. CULT4 17 Teachers share the principles of the university. CULT5 18 The university has specific characteristics that make it different
from the others.
Corporate Identity (IC)
IC1 19 The university presents itself in an integrated way to the external
public. IC2
20 There is consensus about the relevance of the university among
faculty members. IC3
According to Hair Jr. et al. (2014), the complete SEM model consists in two intrinsically interrelated models: the measurement model and the structural model. In SEM with PLS, the measurement model refers to the relationships of the latent variables with the observed variables (Wong, 2013; Ringle et al., 2014).
The assumptions of the measurement model are given in Table 2.
Table 2 - Hypotheses of the measurement model
Hypothesis 1: CVI1 = ƒ (CVI) Hypothesis 2: CVI2 = ƒ (CVI) Hypothesis 3: CVI3 = ƒ (CVI) Hypothesis 4: CVI4 = ƒ (CVI) Hypothesis 5: CVI5 = ƒ (CVI) Hypothesis 6: CVI6 = ƒ (CVI) Hypothesis 7: CVI7 = ƒ (CVI) Hypothesis 8: CVI8 = ƒ (CVI) Hypothesis 9: COMP1 = ƒ (COMP) Hypothesis 10: COMP2 = ƒ (COMP) Hypothesis 11: COMP3 = ƒ (COMP) Hypothesis 12: COMP4 = ƒ (COMP) Hypothesis 13: CULT1 = ƒ (CULT) Hypothesis 14: CULT2 = ƒ (CULT) Hypothesis 15: CULT3 = ƒ (CULT) Hypothesis 16: CULT4 = ƒ (CULT) Hypothesis 17: CULT 5 = ƒ (CULT) Hypothesis 18: IC1 = ƒ (IC) Hypothesis 19: IC2 = ƒ (IC) Hypothesis 20: IC3 = ƒ (IC)
Source: The authors
In the SEM context, with PLS, the structural model refers to the analysis of relations between the latent variables (Wong, 2013; Ringle et al., 2014). The hypothesis of the structural model is as follows: IC: ƒ (CVI, COMP, CULT).
In the path diagram, the hypothetical model is represented visually, displaying the complete set of relations between variables. The illustration shows how the variables are related, simplifying their reading (Hair Jr. et al., 2014).
The path diagram of the hypothetical model (see Figure 2), presents the relationships between the constructs and observes the pattern used in the SEM, having been built, as observed, with influence of the Melewar and Jenkins (2002) model.
Figure 2 - Path diagram of the hypothetical model
The diversity of the dimensions that form corporate identity justify the use of multivariate statistics in the evaluation of the model. Due to the uncertainty of the normality of the data - the sample is relatively small - the adopted model has many paths and, according to the literature reviewed, there are no quantitative studies with more complex models on the subject. Therefore, we chose SEM as the technique to work out the date, with PLS, using the Partial Least Squares (WarpPLS) version 4.0 program.
In the evaluation of reflective measurement models, it is possible to evaluate the reliability of internal consistency, the individual reliability of the observed variables, the convergent validity and the discriminant validity of the constructs through the analysis of the SEM estimates with PLS.
Reliability is a necessary condition for validity, since a valid measure initially requires dependability (Hair Jr. et al., 2014). The first step, then, is to evaluate the reliability of internal consistency. Reliability is traditionally verified by Cronbach 's alpha, consisting on the inter-correlations of indicators and assumes values between 0 and 1, with 0.70 being the generally acceptable lower limit (Hair Jr. et al., 2009). However, Cronbach 's alpha is very sensitive to the number of items in the scale and tends to underestimate the reliability of internal consistency, and so caution is advised (Hair Jr. et al., 2014).
Thus, it becomes appropriate to verify reliability of internal consistency by using the measure known as composite reliability. This index considers the different external values of the observed variables. When it adopts values between 0.70 and 0.90, the measure indicates adequate convergence or internal consistency and is considered satisfactory. Values between 0.60 and 0.70 are considered acceptable in exploratory research (Wong, 2013; Hair Jr. et al., 2014). However, values above 0.90 are undesirable once they reveal the observed variables are likely measuring the same phenomenon, and, therefore, do not represent valid measures of the construct. Values for composite reliability above 0.90 are probably due to the use of semantically redundant items. Finally, composite reliability values below 0.60 signal inconsistency in internal reliability (Hair Jr. et al., 2014)
Convergent validity represents the extent to which one indicator positively correlates with the other indicators of the same construct. To verify the convergent validity, we must consider the analysis of the values of indicators and the extracted average variance (Hair Jr. et al., 2014).
The values of indicators in a construct reveal a characteristic called reliability of the indicator and point to the link between the indicators and the construct. The value of the indicators should ideally present minimum indexes of 0.70, as the latent variable explains at least 50% of their variation. Indicators that display values between 0.40 and 0.70 are subject to exclusion when the effects of such removal, while preserving the content validity, result in increased composite reliability. For indicators with values below 0.40, the instruction is to eliminate the scale. According to Hair Jr. et al. (2014), we generally observe weaker values in Social Sciences studies with recently developed scales.
At the construct level, the measure typically adopted to verify convergent validity is the average variance extracted (Wong, 2013). It is defined as the average value of the quadratic values of the indicators associated to the construct, that is, the sum of the quadratic values (λ ²) divided by the number of indicators (n). Therefore, eliminating observed variables that present lower value will affect the increase of the value of the extracted mean variance (Ringle et al., 2014).
In order for the construct to explain most of the variance of its indicators, the average variance extracted should assume values from 0.50 (Medina Molina, Rufín Moreno & Rey Moreno, 2011).
Discriminant validity is the extent to which a construct differs from other constructs, that is, it is understood as a measure in which the constructs are independent of each other. According to the analysis of cross values, for the discriminant validity condition to be established, the values of the observed variables in their respective latent variables must be higher than in other constructs (Ringle et al., 2014).
After assessing the reliability and validity of construct indicators, we begin the structural model evaluation of the predictive capacity and the relationship between the latent variables.
The path coefficients of the structural model represent the hypothetical relationships between the constructs. These numbers assume standardized values between -1 and 1. The closer to ± 1 the estimated path coefficients are, the stronger the relationship between the exogenous and endogenous latent variables, assuming a certain level of significance (p value). (Hair Jr. et al., 2014).
The Pearson coefficient of determination (R²) is the most used form of measurement for the structural model evaluation and relates to the portion of variance of the endogenous construct that is explained by the exogenous latent variables (Ringle et al., 2014). R² values range from 0 to 1, and the closer to 1, the greater the combined effect of the exogenous latent variables over the endogenous latent variables. According to Hair Jr. et al. (2014), there is no rule for indicating acceptable values for R², since they depend on the research area and the complexity of the model. For social and behavioral sciences, they suggest R2 = 2% being classified as small effect, R2 = 13% as mean effect and R2 = 26% as large effect (Cohen, 1988, apud Ringle et al., 2014).
represents the average effect of the exogenous latent variable on the endogenous construct, while values of 0.02 and 0.35 represent small and large effects, respectively.
Finally, the predictive validity or relevance (Q²) or Stone-Geisser indicators is another aspect that must be explored in the structural model. The Q² measure evaluates the prediction quality of the model. A Q² value greater than zero indicates that there is predictive relevance for a given latent reflective and endogenous variable (Medina Molina et al., 2011).
4 RESULTS ANALYSIS
Initially, we checked the originally proposed hypothetical model. We started the analysis of the measurement model by checking the reliability of the internal consistency and the convergent validity of the constructs. For this, we estimated Cronbach alpha values, the composite reliability measures and the average variances extracted (AVE) (see Table 1).
Table 1-Tthese reliability and AVEoriginal model
Latent Variable Cronbach's alpha Compound Reliability AVE
CVI 0.654 0.767 0.301
COMP 0.756 0.845 0.578 CULT 0.805 0,866 0.567
IC 0.559 0,773 0.531
Source: The authors
The first aspect analyzed in the measurement model was the observation of Cronbach´s alpha values. The traditional Cronbach alpha index signaled that the COMP (Behavior) and CULT (Corporate Culture) constructs presented values higher than 0.70, which indicates adequacy. On the other hand, the CVI (Communication and Visual Identity) and IC (Corporate Identity) constructs showed unsatisfactory values. These values must be carefully analyzed, because Cronbach's Alpha presents limitations as a measure of reliability; therefore, we examined the composite reliability. In this case, all constructs are considered reliable, once they presented values higher than 0.70.
After checking the internal consistency of the constructs, the second analysis stage concerns the evaluation of the constructs’ convergent validities obtained by the measures of the mean variances extracted. The analysis of Table 1 shows that one of the latent variables, CVI (Communication and Visual Identity) presents values for AVE of less than 0.50.
Table 2 allows the identification of all the observed variables of the CVI construct that have values lower than 0.70, and also allows us to detect observed variables of other constructs, whose values falls below the minimum required. It should be noted that in relation to the indicators numbers, all presented positive values and with statistical significance (p value less than 0.001).
Table 2 – Value of construct indicators
CVI COMP CULT IC CVI1 0.525 -0.136 0.166 0,137 CVI2 0.452 -0.394 0,159 -0.094 CVI3 0.414 0.103 -0.076 0.163 CVI4 0.504 0.023 -0.212 0,198 CVI5 0.747 0.002 0.049 -0.120 CVI6 0.706 0.092 0.013 -0.201 CVI7 0.537 -0.013 -0.042 0.017 CVI8 0,400 0,338 -0.11 0.063 COMP1 0.138 0.743 -0.384 0.134 COMP2 -0.101 0,800 0.114 0.070 COMP3 0.121 0.769 -0.089 -0.184 COMP4 -0.157 0.727 0.361 -0.019 CULT1 -0.109 0,349 0.750 -0.233 CULT2 0,206 -0,116 0.583 0.235 CULT3 0.043 -0.118 0.827 0.014 CULT4 -0.076 -0.024 0.756 -0.055 CULT5 -0.020 -0.095 0.823 0.082 IC1 -0.090 0.184 -0,150 0.761 IC2 0.213 -0.055 -0.019 0.714 IC3 -0,117 -0.142 0.180 0.710
Data on Table 2 allows to identify that, in the eight items composing the CVI construct (Communication and Visual Identity), there are six indicators with factor values under 0.70. The variables that presented values between 0.40 and 0.70 were CVI1 (The name of the university is recognized among the members of the academic community for the quality of its services rendered); CVI2 (The university logo transmits excellence in services rendered to society); CVI3 (The architecture of the buildings reflects the history of the university, with its traditions); CVI4 (The location of the university buildings facilitates the access of its public); CVI7 (The university is concerned with informing internal members about the events associated with itself); and CVI8 (Interpersonal relationships enable the flow of information that is not served by traditional channels of communication).
Regarding the construct CULT (Corporate Culture), indicator CULT2 (The university integrates teaching and research activities) presented a comparatively low value (0.583).
As pointed out by Hair Jr. et al. (2014), these variables could be removed from the model, to increase the reliability of the construct, as long content validity is not compromised.
Next, we moved on to the new model specification, which excluded six observed variables that did not present adequate values: CVI1; CVI2; CVI3; CVI4; CVI8; and CULT2. The choice to maintain the observed variable CVI7 was due, firstly, to its contribution to the validity of the construct content, since it refers to the disclosure of events associated with the university. Secondly, keeping the CVI7 variable in the model is justified by following Hair Jr. et al.’s (2009) recommendation to establish the minimum of three observed variables per construct (latent variable).
The analysis of the measurement model began with the verification of internal consistency and convergent validity of the constructs. Table 3 shows the results obtained for the reliability indices and consisting AVE for latent variables IVC; COMP; CULT; and IC re-specified model.
Table 3 - Testing reliability and AVE re-specified model
Latent variable Composite reliability AVE
CVI 0.821 0.606
COMP 0.845 0.578
CULT 0.880 0.647
IC 0.773 0.531
Source: The authors
As for the composite reliability, all constructs showed values between 0.70 and 0.90, indicating adequate internal consistency. Where average variance extracted is concerned, none of the constructs showed indices less than 0.50. These results indicate that the constructs are consistently represented by their observed variables.
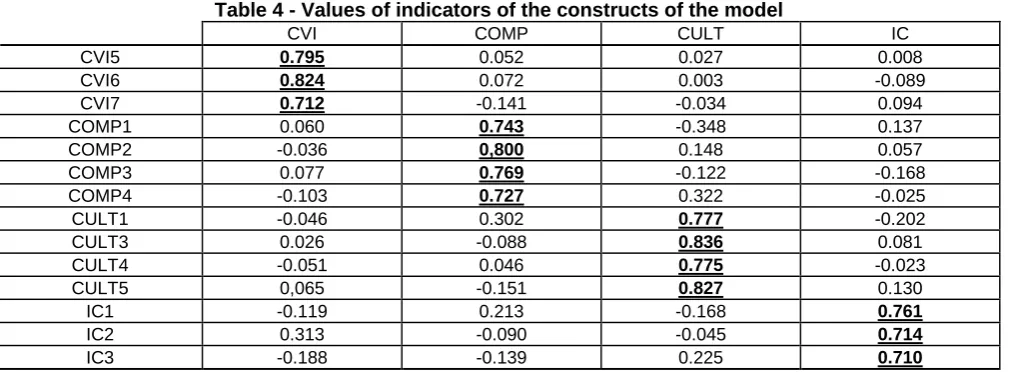
At the end of inspection on convergent validity, we follow on to the verification of values for the observed variables in each construct of the re-specified model (see Table 4).
Table 4 - Values of indicators of the constructs of the model
CVI COMP CULT IC
CVI5 0.795 0.052 0.027 0.008 CVI6 0.824 0.072 0.003 -0.089 CVI7 0.712 -0.141 -0.034 0.094 COMP1 0.060 0.743 -0.348 0.137 COMP2 -0.036 0,800 0.148 0.057 COMP3 0.077 0.769 -0.122 -0.168 COMP4 -0.103 0.727 0.322 -0.025 CULT1 -0.046 0.302 0.777 -0.202 CULT3 0.026 -0.088 0.836 0.081 CULT4 -0.051 0.046 0.775 -0.023 CULT5 0,065 -0.151 0.827 0.130 IC1 -0.119 0.213 -0.168 0.761
IC2 0.313 -0.090 -0.045 0.714
IC3 -0.188 -0.139 0.225 0.710
Source: The authors
Table 4 shows the entire set of indicators for the re-specified model presents values with magnitudes above 0.70 in relation to the associated construct.
another (Hair Jr. et al., 2014). Table 4 shows that none of the values of the direct effects of the indicators relative to the constructs to which they belong was lower than its indirect contributions to any other constructs in relation to their own construct. Therefore, we can perceive the discriminant validity of the second test model of cross-values of indicators. For instance, in the case of indicator CVI5, the factor load in latent variable CVI (= 0,795) is higher than the factor load of CVI5 in others constructs (COMP, CULT, IC). The same procedure could be found for all the indicators of all constructs, a result that shows the existence of discriminant validity of the re-specified model.
Lastly, once there is evidence of discriminant validity of the re-specified model, the analysis of the measurement model is completed and we move on to the analysis of the structural model.
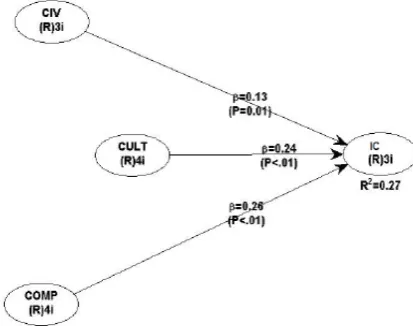
The first evaluation of the structural model adjustment meant assessing the Pearson determination coefficient (R²). In this research, the R² reached 0.27 for endogenous latent variable CI (Corporate Identity). This value is considered a reasonable effect for the researched area. Thus, the IC construct (corporate identity) has 27% of its variance explained by the structural model.
Continuing with the analysis of the structural model, the predictive relevancy score (Q²) or Stone-Geisser indicator reached a value greater than zero, with Q² = 0.27 for the latent variable CI (Corporate Identity) of the re-specified model, showing above average predictive relevance.
Table 5 shows the values for effect levels (f²) or Cohen indicators.
Table 5 - Values f² index
latent variable f²
CVI 0.045
COMP 0.120
CULT 0.102
Source: The authors
The f² values represent the level of impact relevance of each construct to the overall fit of the model. Consequently, Table 5 shows that the latent variable CVI (Communication and Visual Identity) has little effect and the latent variables COMP (Behavior) and CULT (Corporate Culture) have effects closer to average. The completion of the analysis of the structural model was interpreted through path coefficients (Table 6).
Table 6 -Values of path coefficients for the re-specified model
Relations path coefficients
CVI (Communication and Visual Identity) → CI (Corporate Identity) 0.132 COMP (behavior) → CI (Corporate Identity) 0.259 CULT (Corporate Culture) → CI (Corporate Identity) 0.237
Source: The authors
Among the CVI and IC constructs the path coefficient value is 0.132. In the comparison between COMP and IC, the path coefficient was 0.259, and between CULT and IC the estimated value was 0.237. These coefficients indicate the importance of latent exogenous variables to explain the latent endogenous variable CI (Corporate Identity) and indicate that the analyzed dimensions directly and positively influence the identity of the public HEI, at the rate of 13% (CVI), 26% (COMP) and 24% (CULT).
Betas (β) of plain or ordinary linear regression can be interpreted the same way as coefficients (Ringle et al., 2014). Figure 3 shows the path diagramfor the re-specified model.
Figure 3 - Path diagram for the re-specified model
5 CONCLUSION
The study evidenced that the hypothetical model of the research - influenced by the theoretical model developed by Melewar and Jenkins (2002) - is appropriate to predict corporate identity of a public institution of higher education. The re-specified model was confirmed, having been adapted from the original due to natural characteristics of the participants of the selected sample.
Verification of the research model showed the dimensions of "communication and visual identity", "behavior" and "corporate culture" exert a significant and positive impact on the identity of the surveyed public HEI.
The construct with the highest effect was “behavior”, and therefore the one influencing the identity of the researched public HEI with greater strength. The other constructs, "corporate culture" and "communication and visual identity", in that order of importance, also achieved positive impact coefficients for the identity of the researched institution.
We should point out these results were obtained only after the new specification for "communication and visual identity" and "corporate culture", the first of which has changed considerably, as will be discussed later.
We also identified the observed variables most important within each construct influencing the corporate identity of public HEIs.
The strongest impact on the identity of the public HEI researched was in the “behavior” construct. We found the observed variable that carries the most importance relates to faculty behavior reflecting the mission of the university.
The other observed variables for the "behavior construct" were also relevant in shaping the identity of the public HEI study object. The senior management decisions related to teaching and research influence the perception of the teaching staff as to the essence of the university. This study also noted the importance of faculty identification and connection with the proposals for teaching and research in the institution. This shows the relevance of a strong relationship between how the individual defines himself or herself with the way he or she sees the HEI as a factor that contributes directly to the construction of the identity of the institution.
The academic literature supports the notion that results related to the "behavior" construct reveal the actions of the institution are critical in determining the corporate identity, by projecting its features to its members.
Still considering what was identified regarding "behavior", one can infer that, certain strategic actions can substantially contribute to the alignment of the behavior of the internal members and the identity of the public HEI, such as stimuli both for development and for scientific research publications and continuous actions to support qualification (for example awarding grants).
Regarding the "communication and visual identity” construct, which showed the weakest impact on the identity of the public HEI researched, variables related to the observed internal and external communication channels have shown the highest values. This result reflects the importance of internal and external communication policies to propagate the identity of the institution and thus configures itself an important institutional management tool.
The results of this research make clear the continuing need for public HEIs to invest in communication, in order to promote integration between internal and external communications.
As indicated by the survey results, we can also observe the relevance and importance of disclosure of events associated with the institution to internal members. This shows that actions to make information related to the public HEI actually public are a factor contributing to its identity, making it more consistent.
These results are in line with the characteristics of a public HEI that plans to guide the implementation of its communication policy in order to strengthen its identity. This policy, in turn, acts indirectly, contributing to the success of the objectives and institutional goals, in addition to promoting the image and reputation of the institution.
With respect to the observed variables related to logo, name, the location and architecture - highlighted in the academic literature on identity as key factors in its definition - of the researched public HEI, we could observe they showed no minimally acceptable values in the verification of the original model. This result indicates, according to the surveyed participants, the low representation of visual identity attributes in shaping the identity of the public HEI studied. Therefore, these variables were eliminated in the re-specified model.
The empirical results indicate the importance of multiple variables associated with the "corporate culture" construct, which had the second strongest impact on the identity of the surveyed institution. In other words, corporate culture is one of the dimensions of significant impact to the identity of the public HEI studied.
In other words, it emphasizes the importance of spreading the corporate culture and it being in line with the principles of academic excellence, ethics and transparency adopted by the university.
On the subject of the values of the institution that determine the identity of the public HEI researched, they highlight the institution’s social inclusion policies and actions aimed at establishing dialogue with society in finding solutions to their problems. The sample participants also see a positive association between the objectives of the institution and its identity, such as increasing the number of vacancies in existing courses and offering new courses. In this regard, the public HEI researched is taking on an eclectic character, expanding to the most diverse areas of knowledge.
Therefore, the research showed the aspects of corporate culture - that is, the principles, values and objectives adopted by the public HEI - are important elements in the process of forming an identity.
It is important to point out that as far as the “corporate identity” construct goes, the observed variable indicating "specific characteristics that make this HEI different from others" showed the highest estimated value.
This result agrees with the literature, which identifies the distinctive character of a corporation as a major factor in its identity. In this construct, the other variables observed, also proved important for the self-image of public HEIs, for example those related to the recognition of the institution’s importance and the university being presented in an integrated manner to the general public,.
In terms of managerial contribution, the results identify the greater areas of impact on identity formation may contribute to creating management strategies that promote the development of the most influential attributes in shaping the identity of the public HEI before its internal target audience. As a result, these actions can strengthen the projection of a positive corporate image to its external stakeholders, as pointed out in the literature review by several authors.
In terms of theoretical contribution, we emphasize the research indicated most important aspects to the identity of the Brazilian public HEI researched are related to the university's actions, since they influence behavior and culture and hence the identity corporate university.
Just as any scientific study, this one too has limitations: 1) because it is a sample of convenience, it is likely that the selected group was not the most representative of the studied universe, involving all the limitations resulting therefrom, highlighting that the conclusions cannot be generalized. 2) Participants are members of the teaching staff, which may have brought some bias to the survey, as this type of tie could give distinguished levels of awareness of those who make up the strength of technical and administrative work. 3) The questionnaire was answered by the participants independently, making it difficult to resolve any doubts and questions and reducing the control of who truly answered the questionnaire.
For future studies, we recommend addressing the same research question studied here from a qualitative perspective, in order to verify the convergences and divergences with the results found in this study.
Finally, as the present research was carried out in a single public HEI, we suggest this study could serve as a model for research with a quantitative approach, aimed at verifying the identity of other public higher education institutions. The field research in different public higher education institutions can support comparative studies to identify both the most significant differences between the main determinants of public HEI constructs identities, as well as indicating the observed variables most important to the identity of each.
We also recommend exploring the model with a random and expanded sample for the quantitative approach. This field of research is lacking in studies, according to the literature, especially in the Brazilian context. In this case, the data processing could utilize SEM, however based on a covariance matrix.
REFERENCES
Abdullah, Z., Nordin, S.M. & Aziz, Y.A. (2013). Building a unique online corporate identity. Marketing Intelligence & Planning, 31 (5), 451-471
Abratt, R. & Kleyn, N. (2012). Corporate identity, corporate branding and corporate reputations. European Journal of Marketing, 46 (7/8), 1048-1063
Albert, S. & Whetten, D. (1985). Organizational identity. In: CUMMINGS, L. C.; STAW, B. M. (ed). Research in Organizational Behavior, 17, Greenwich, CT: JAI
Alessandri, S. W. (2001). Modeling corporate identity: a concept explication and theorical explanation. Corporate Communications: an International Journal, 16 (4), 173-182
Baker, M. J. & Balmer, J. M. T. (1997). Visual identity: trappings or substance? European Journal of Marketing, 31 (5), 366-382
Baldissera, R. (2000). Comunicação organizacional: o treinamento de recursos humanos como rito de passagem. São Leopoldo: Ed. UNISINOS
Balmer, J. M. T. (2001). Corporate identity, corporate branding and corporate marketing: seeing through the fog. European Journal of Marketing, 35 (3/4), 248-291
Balmer, J. M. T. & Gray, E. R. (2000). Corporate identity and corporate communications: creating a competitive advantage.
Batraga, A. & Rutitis, D. (2012) Corporate Identity within the health care industry. Economics and Management, 17 (4), 1545-1551
Chunyan, X., Bagozzi, R.P. & Meland, K.V. (2015). The impact of reputation and identity congruence on employer brand attractiveness. Marketing Intelligence & Planning, 33 (2), 124-146
Cornelissen, J. & Elving, W. J. L. (2003). Managing corporate identity: an integrative framework of dimensions and determinants. Corporate Communications: An International Journal, 8 (2), 114-120
Cornelissen, J., Haslam, S.A. & Balmer, J. M. T. (2007). Social Identity, Organizational Identity and Corporate Identity: Towards an Integrated Understanding of Processes, Patternings and Products. British Journal of Management, 18 (1), 1-16
Gil, A. C. (2010). Como Elaborar Projetos de Pesquisa. 5. ed. São Paulo: Atlas
Gray, E. & Balmer, J. (1998). Managing corporate image and corporate reputation. Long Range Planning, 31 (5), 695-702 Hair Jr., J. F., Black, W. C., Babin, B. J., Anderson, R. E. & Tatham, R. L. (2009). Análise multivariada de dados. 6. ed.
Porto Alegre: Bookman
Hair Jr., J. F., Hult, G.T.M., Ringle, C.M. e Sarstedt, M.A. (2014). Primer on partial least squares structural equation
modeling (PLS-SEM). Sage: Thousand Oaks
Martins, G. A. & Theóphilo, C. R. (2009). Metodologia da investigação científica para ciências sociais aplicadas. 2. ed. São Paulo: Atlas
Medina Molina, C., Rufín Moreno, R. & Rey Moreno, M. (2011). El papel moderador de la cultura en la generacion de satisfacción y lealtad. Investigaciones Europeas de Dirección y Economía de la Empresa, 17 (1), 57–73
Melewar, T. C. & Akel, S. (2005). The role of corporate identity in the higher education sector. Corporate Communications: An International Journal, 10 (1), 41 – 57
Melewar, T. C. & Karaosmanoglu, E. (2006). Seven dimensions of corporate identity. European Journal of Marketing, 40 (7/8), 846-869
Melewar, T. C. & Jenkins, E. (2002). Defining the corporate identity construct. Corporate Reputation Review, 5 (1), 76-90 Minguez, N. (2000). Un marco conceptual para la comunicación corporativa. Revista de Estudios de Comunicación, 5 (8),
303-321. Recuperado de <http://www.ehu.es/zer/es/hemeroteca/articulo/Un-marco-conceptual-para-la-imagen-corporativa/115>. Acesso em: 26 out. 2014.
Mohamad, B., Abu Bakar, H. & Rahman, N. A. A. (2007). Relationship between corporate identity and corporate reputation: a case of a Malaysian higher education. Journal Manajemen Pemasaran, 2 (2), 81-89
Oliva, E. J. D. & Prieto, L. A. C. (2015). La identidade organizacional y su influencia em la imagen: uma reflexión teórica.
Suma de negócios, 6 (13), 114-123
Ringle C. M., Silva D. e Bido D. (2014). Modelagem de equações estruturais com utilização do Smartpls. Brazilian Journal of Marketing – BJM. Edição especial, 13 (2), 56-73, 2014.
Suvatjis, J., Chernatony, L. & Halikias, J. (2012). Assessing the six station corporate identity model: a polymorphic model.
Journal of Product & Brand Management, 21 (3), 153-166
Van Riel, C. B. M. (1995). Principles of corporate communication. London: Prentice Hall
Van Riel, C.B.M. (1997). Research in corporate communication: an overview of an emerging field. Management Communication Quartely, 11 (2), 288-309
Vergara, S. C. (2007). Projetos e relatórios de pesquisa em administração. 9. ed. São Paulo: Atlas
Vieira, P. R. C., Freitas, J.A.S.B. & Dalto, E. J. (2014). O nexo causal entre a identidade organizacional e a imagem corporativa: estudo empírico sobre uma empresa terceirizada. Ciências Sociais em Perspectiva, 13, 1-24
Wong, K. K. (2013). Partial Least Squares Structural Equation Modeling (PLS-SEM) Techniques Using SmartPLS.