iAware: Making Live Migration of Virtual
Machines Interference-Aware in the Cloud
Fei Xu, Fangming Liu,
Member, IEEE,
Linghui Liu, Hai Jin,
Senior Member, IEEE,
Bo Li,
Fellow, IEEE,
Baochun Li,
Senior Member, IEEE
Abstract—Large-scale datacenters have been widely used to host cloud services, which are typically allocated to different virtual machines (VMs) through resource multiplexing across shared physical servers. While recent studies have primarily focused on harnessing live migration of VMs to achieve load balancing and power saving among different servers, there has been little attention on the incurred performance interference and cost on both source and destination servers during and after such VM migration. To avoid potential violations of service-level-agreement (SLA) demanded by cloud applications, this paper proposesiAware, a lightweight
interference-awareVM live migration strategy. It empirically captures the essential relationships between VM performance interference and key factors that are practically accessible, through realistic experiments of benchmark workloads on aXen virtualized cluster platform.iAwarejointly estimates and minimizes both migration and co-location interference among VMs, by designing a simple multi-resource demand-supply model. Extensive experiments and complementary large-scale simulations are conducted to validate the performance gain and runtime overhead ofiAwarein terms of I/O and network throughput, CPU consumption and scalability, compared to the traditional interference-unaware VM migration approaches. Moreover, we demonstrate thatiAwareis flexible enough to cooperate with existing VM scheduling or consolidation policies in a complementary manner, such that the load balancing or power saving can still be achieved without sacrificing performance.
Index Terms—Cloud computing, virtualization, live migration, performance interference.
F
1
I
NTRODUCTIONV
IRTUALIZATION is widely deployed in large-scaledatacenters, due to its ability to isolate co-located application workloads, and its efficiency for re-source multiplexing. Most real-world Infrastructure-as-a-Service (IaaS) cloud platforms [1], such as Amazon Elas-tic Compute Cloud (EC2) [2], take advantage of virtu-alization to provide flexible and economical computing capacity for tenants, while statistically guaranteeing the service-level-agreement (SLA) in terms of throughput, delays, and the successful requests served. In particular, live migration of running virtual machines (VMs) [3] across distinct physical machines (PMs) serves as the
cornerstone of realizing load balancing [4] and power saving [5]–[7] functions in such modern datacenters.
There are two types of underlying performance inter-ference that cannot be overlooked, on both the migration source and destination servers, duringandafter live mi-grations. (1) Migration interference. It has been observed from realistic applications that during the migration
pro-• Fei Xu, Fangming Liu, Linghui Liu and Hai Jin are with the Services Computing Technology and System Lab, Cluster and Grid Computing Lab in the School of Computer Science and Technology, Huazhong Uni-versity of Science and Technology. The corresponding email address is [email protected].
• Bo Li is with the Department of Computer Science and Engineering, Hong Kong University of Science and Technology. His email address is [email protected].
• Baochun Li is with the Department of Electrical and Computer Engineering, University of Toronto. His email address is [email protected].
Manuscript received September XX, 2012; revised August XX, 2013.
cess of VM(s), the migrated VM(s) and the other running VMs hosted on both source and destination PMs could undergo severe performance degradation [8], [9]. (2)
Co-location interference. Current virtual machine monitor (VMM) like Xen [10] only provides resource isolation among co-located VMs by CPU core reservations and static partition of memory and disk capacities. However, it has been shown that resource isolation does not imply performance isolation between VMs [11]. Meanwhile, resources like cache space, memory bandwidth and the interconnection network are very hard to be isolated in practice [12]. Hence, even with built-in performance isolation mechanisms across VMs, it is not uncommon for the resumed VM after migration and other co-located VMs at the destination PM to suffer from additional performance losses [5], due to potential resource con-tention. As a result, it is essential to make correct VM migration decisions, such that both migration and co-location interference can be alleviatedin a holistic manner, in order to avoid potential violations of the cloud SLA.
Recently, there have been a number of studies on VM migration, which primarily focused on the migration costs of an individual migrated VM, in terms of the duration, downtime, bandwidth and power consump-tion [13], as well as SLA violaconsump-tions on the migrated VM [7], [14]. There has been little attention on themutual
interference among a cluster of VMs across migration source and destination PMs, during and after the gration. There have also been investigations on VM mi-gration and VM co-location interferenceseparately, with respect to multi-dimensional resources such as the cache,
memory bandwidth [15] and network bandwidth [16]. However, there has been no systematical study onjointly
measuring, analyzing and mitigating both the VM mi-gration interference and co-location interference. As a result, though a VM migration operation itself might not incur considerable cost, it is possible that the VMs hosted on a chosen destination PM result in performance interference with the migrated VMs during and after the migration process, which brings additional costs eventually.
To address these challenges, in this paper, we present
iAware, a lightweight interference-aware VM live migra-tion strategy. It empirically captures the essential rela-tionships between VM performance interference and key factors that are practically accessible, through realistic experiments of benchmark workloads on a Xen virtual-ized cluster platform.iAwarejointly estimates and mini-mizes both migration and co-location interference among VMs, by designing a simplemulti-resource demand-supply
estimation model that unifies the key factors. Such fac-tors include multi-dimensional resource utilization mea-sured at both PMs and VMs, the number of co-located VMs, network interrupts inside VMs, cache miss ratios in PMs and VMs, as well as the I/O and VCPU scheduling mechanisms adopted in the VMM (e.g., Xen).
We conduct extensive experiments and complemen-tary large-scale simulations to evaluate the performance and runtime overhead of iAware in terms of I/O and network throughput, CPU consumption and its scala-bility, compared with traditional interference-unaware VM migration approaches. We demonstrate that under a mix of representative workloads,iAwarecan qualitatively estimate VM performance interference, and improve: (1) I/O and network throughput by 65% for network-intensive workloads, and (2) execution durations and the total amount of successfully served requests by
16%-28% for workloads that are CPU, memory and network-intensive, in comparison to the First-Fit De-creasing (FFD) [7] and Sandpiper [4] algorithms. Mean-while, the runtime overhead of iAware in terms of CPU consumption and network I/O usage is shown to be practically acceptable, even when it scales to thousands of VMs.
To the best of our knowledge, iAware represents the first attempt to design and implement an interference-aware VM live migration strategy, with a particular focus on characterizing and minimizing the performance interference during and after the migration of VMs. Moreover, our strategy is sufficiently flexible to cooper-ate with existing VM scheduling or consolidation poli-cies in a complementary manner, in order to achieve load balancing [17] or power saving [18]–[20] without sacrificing performance.
2
U
NDERSTANDINGVM I
NTERFERENCEIn this section, we first seek to understand the following questions: how severe the performance interference could be
TABLE 1: Representative benchmark workloads of datacenters.
Workloads Type Programs
SPECCPU2006 [21] CPU, memory-intensive gobmk, mcf
netperf [22] Network-intensive netperf TCP
Hadoop [23] CPU, network-intensive TeraSort
NASA parallel CPU, memory, and
ft
benchmark [24] network-intensive
SPECweb2005 [25] CPU, memory, and banking
network-intensive
during and after the migration of VMs, and what are the key factors that impact such performance interference?
We build aXen[10] virtualized cluster platform based on 10enterprise-class PMs to capture VM performance interference, under a variety of typical datacenter appli-cation workloads as characterized in Table 1. Specifically, each PM is equipped with2quad-core Intel Xeon E5620
2.40GHz processors, 12 MB shared last level cache, 24
GB memory,800 GB network file system (NFS) storage, and two 1 Gbps Ethernet interfaces used for the NFS storage traffic and VM application traffic (including the VM migration traffic), respectively. All PMs are con-nected to a 1 Gbps network switch, forming a one-tier tree network topology. The PMs are running CentOS 5.5 distribution and the Linux 2.6.18.8-Xen kernel patched with Xen 4.1.1 [10], which is an open-source VMM re-sponsible for creating multiple guest domains (i.e.,VMs) on a PM. The VMs are running CentOS 5.5 with Linux 2.6.18.8 kernel, and they can access the resources of PMs via a privileged domain calleddomain-0. All image files of VMs, which maintain the operating system and user data of VMs, can be accessed through NFS storage.
TABLE 2: VM types and parameter setting ofXenCredit Scheduler [26].
VM Type VCPUs Memory weight cap
Small VM instance 1 1.7GB 256 100
Large VM instance 4 7.5GB 256 400
domain-0 1 2GB 512 0
In accordance to the production standard of VM in-stances in Amazon EC2 [2], the VMs in our platform are configured as two representative classes: thestandard small VM instancewith 1 virtual CPU core (VCPU) and
1.7 GB memory versus the standard large VM instance
with 4 VCPU cores and 7.5 GB memory. The domain-0 runs on 1 VCPU core and 2 GB memory. To share the physical CPU cores (PCPUs) among VMs including
domain-0, we adopt the Xen Credit Scheduler [26] with the setting ofweightandcapparameters listed in Table 2. In particular, to ensure that domain-0 gets enough CPU time for serving I/O requests from VMs, we assign a doubleweight(i.e.,512) than other types of VMs and zero upper cap of CPU cycles to domain-0 [27]. Meanwhile, as Xen does not support memory over-subscription in production, we allocate an amount of non-overlapped memory to each domain as in [28].
Without loss of generality, we use a four-tuple
ar-ray V U hV Uc, V Um, V Ui, V Uoi to denote the
multi-dimensional virtual resource utilization ratio (including CPU, memory, network in- and out-throughput) and as
0 100 200 300 400 0 200 400 600 800 1000 Time (seconds) Network Throughput (Mbps) vm01 in vm01 out vm03 in vm03 out Migration Process
Fig. 1: Network throughput of the netperf TCP application hosted on two large VM instances, during the live migration of another large idle VM instance. 0 100 200 300 400 0 20 40 60 80 100 Time (seconds)
CPU, Memory Utilization (%)
CPU memory Migration Process
Fig. 2:V U of the large VM instance hosting the mcf application on the migration source PM, during the live migration of a large VM instance running the mcf application.
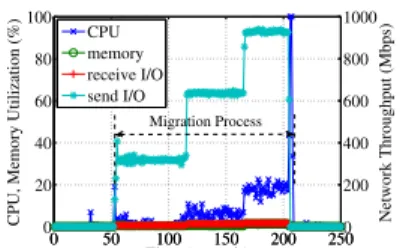
0 50 100 150 200 250 0 20 40 60 80 100
CPU, Memory Utilization (%)
Time (seconds) 0 50 100 150 200 2500 200 400 600 800 1000 Network Throughput (Mbps) CPU memory receive I/O send I/O Migration Process
Fig. 3:V Uof thedomain-0on the migration source PM, during the live migration of a large VM instance running the mcf application.
a ratio of the maximal resource capacity of a VM, where
V Uc, V Um, V Ui, V Uo ∈ [0,1]. Correspondingly, we use
another four-tuple array P U hP Uc, P Um, P Ui, P Uoi to denote the multi-dimensional physical resource utilization ratio and as a ratio of the maximal resource capacity of a PM, whereP Uc, P Um, P Ui, P Uo∈[0,1]. For simplicity, we calculate P U as the ratio of the aggregate resource consumption of all hosted VMs (including domain-0) to the corresponding physical resource capacity of the PM. We develop a resource tracing tool to record V U
inside each VM, by acquiring the resource utilization information of CPU, memory and network bandwidth from the Linux ’proc’ file system (including ’/proc/stat’ file, ’/proc/net/dev’ file and ’/proc/meminfo’ file). Fur-thermore, we capture the statistics of cache misses and cache requests in PMs and VMs using the system-wide statistical profiler for Linux systems, calledOprofile
v0.97 [29], patched with thexenoprof (Oprofile-0.95-xen-patch) [30] customized for Xen VMs. In particular, the cache miss ratio is calculated as the statistics of cache misses divided by that of cache requests in PMs or VMs.
2.1 VM Migration Interference
We measure VM migration interference with represen-tative applications categorized in Table 1. To reserve bandwidth for other VM applications, we enable the rate limiting mechanism [3] inXen, by restricting the network bandwidth for VM migration within300-600Mbps.
To emulate a network-intensive scenario, we launch two large VM instances denoted by vm01and vm02 on one PM. Specifically, vm02 is idle and vm01 is running the netperf [22] application to transmit a TCP stream to another large VM instance vm03hosted on another PM. Fig. 1 plots the network throughput of vm01 andvm03, when vm02 is migrated to the PM hosting vm03. We observe that theV Uo ofvm01and theV Ui ofvm03have dropped substantially, from 925 Mbps to around 600
Mbps, during the live migration process of vm02. Such performance degradation lasts for up to203seconds due to the memory transmission of a large idle VM instance, and it will become worse when migrating a VM with a high memory dirtying rate. Even the migration of one small idle VM instance can last for about 54 seconds in this scenario. This quantitatively shows the severe VM migration interference on both migration source and destination PMs, even with the rate limiting mechanism enabled in Xen. Though [11] has achieved performance
isolation of network bandwidth between VMs, it actu-ally sacrifices the performance of some victim VMs. In case that the network bandwidth for VM migration is restricted as a victim, the migrated VM could undergo a long period of migration process and downtime, and thus experience severe performance degradation.
We further examine VM migration interference in the CPU and memory-intensive scenarios, by carrying out the mcf application of SPECCPU2006 [21] invm01,vm02
andvm03. To exclude the co-location interference, we pin VCPUs of vm01 and vm02 separately to the two CPU processors on the source PM. After the live migration of
vm02, the VCPUs ofvm02andvm03are correspondingly pinned to the two CPU processors on the destination PM. Our experimental result has shown that the execu-tion duraexecu-tions of the mcf applicaexecu-tion onvm01and vm03
are extended by45-50seconds due to the live migration of vm02. Furthermore, Fig. 2 reveals that the V Uc of
vm01 is moderately affected by the migration of vm02, while the V Um of vm01 remains unchanged during the migration process. As a result, we infer that VM live migration has a moderate impact on the performance of CPU and memory-intensive workloads on the migration source and destination PMs.
While the experiments above illustrate VM migration interference from the viewpoint of guest domains (i.e.,
a black-box way), Fig. 3 takes a closer look into the
V U of thedomain-0 on the migration source PM during the migration of a large VM instance running the mcf application (i.e., a white-box way). We observe that the
V Um of the domain-0 on the source PM remains nearly zero and theV Ucof thedomain-0varies from6%-25%. In sharp contrast, theV Uovaries from31%-92% even with the rate limiting mechanism enabled inXen. In addition, theV Uc andV Umof thedomain-0on the destination PM are almost the same as that on the source PM, and the
V Ui of the domain-0can also vary from31%-91%. In summary, our findings above capture the migra-tion interference in both black- and white-box manners, rather than treating it as a constant value of application performance degradation (e.g., the increase in response time) from the viewpoint of guest domains [7], [31]. In essence, VM live migration can be treated as a network-intensive and CPU-moderate application in domain-0, and it interferes with the VMs running network or CPU-intensive workloads on both migration source and destination PMs. The rationale is that, the aggregated
2 4 6 8 10 0 40 80 120 Number of Co−located VMs Performance Degradation (%) gobmk mcf netperf Over−subscription
Fig. 4: The performance degradation of the gobmk, mcf, and netperf TCP applications, as the number of co-located VMs increases from 1 to 11, due to VM co-location interference.
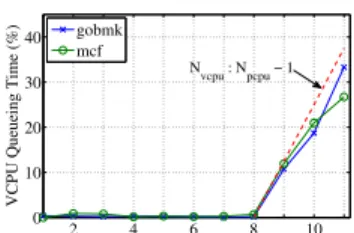
2 4 6 8 10 0 10 20 30 40 Number of Co−located VMs
VCPU Queueing Time (%)
gobmk mcf
Nvcpu : Npcpu − 1
Fig. 5: The percentage of VCPU queueing time in the execution duration of gobmk and mcf applications, with different numbers of co-located VMs on the PM. 2 4 6 8 10 0.2 0.3 0.4 0.5 0.6 Number of Co−located VMs
Cache Miss Ratio
gobmk mcf
Fig. 6: The cache miss ratio of the PM with different numbers of co-located VMs hosting the gobmk and mcf applications.
network bandwidth and CPU computation “demand” of the domain-0 and other co-located VMs cannot be satisfied by the resource “supply” on the source and destination PMs.
In order to avoid the severe migration interference on the network I/O resource, the best practices for sev-eral commercial virtualization platforms (e.g., VMware vSphere [32]) have recently recommended a dedicated network for live VM migration. To emulate such a cloud platform, we configure our experimental setup so that the migration traffic passes through the Ethernet inter-face for the NFS storage traffic, and re-run our experi-ments above. As expected, the migration interference on the network I/O resource is completely alleviated. How-ever, the migration interference on the CPU resource and migrated VMs still exists, similar to the shared network scenario. We will consider the case with a dedicated migration network in the iAwaremodel in Sec. 3.1.
2.2 VM Co-location Interference
Next, we measure and analyze VM co-location interfer-ence to answer two questions: (1)What is the relationship between VM location interference and the number of co-located VMs? (2) What are the key factors that can reflect VM co-location interference? In the next experiment, we use Ph to denote the PM that hosts multiple VMs, and Nvm to denote the number of co-located VMs on
Ph. Specifically, we take the small VM instance as an example and vary Nvm from one to eleven. The VMs are running the gobmk, mcf and netperf workloads as in Sec. 2.1. To quantify VM co-location interference, we define aperformance degradation metricas the ratio of the degraded performance, in terms of the increase of exe-cution durations or the decrease of network throughput, to the original performance when the respective VMs are running alone onPh.
Fig. 4 depicts the performance degradation with the gobmk, mcf and netperf TCP applications in co-located VMs, as Nvm increases from 1 to 11. We observe that VM co-location interference is highly correlated to Nvm. The more VMsPhhosts, the more severe VM co-location interference becomes. The rationale is that,the aggregated shared resource “demands” of co-located VMs increase dra-matically asPh hosts more VMs, which far exceeds the fixed
amount of shared resource “supply” on Ph.In more detail, (1) VM co-location interference under CPU and memory-intensive applications (e.g.,gobmk, mcf) is roughlylinear
to Nvm. In particular, the co-location interference with
VM over-subscription (Nvm>8) is more severe than that without VM over-subscription (Nvm≤8). (2) Moreover, the co-location interference of mcf applications is gen-erally more severe than that of gobmk applications. (3) Finally, the co-location interference of network-intensive applications (e.g., netperf) can be empirically quantified as1− 1
Nvm. As a result, the simple factorNvmcan be used
to estimate VM co-location interference among similar types of co-located workloads.
Essentially, observation (1) can be explained by the VCPU scheduling mechanisms of theXenCredit Sched-uler [26]. Specifically, to share the physical CPU re-sources, each PCPU maintains two local queues (i.e., over
and under) of active VCPUs. The VCPUs with negative
creditsjoin theoverqueue, while the VCPUs with positive
creditsjoin theunderqueue. Each VM (VCPU) is allocated with an amount ofcredits. At every scheduling time, the VCPU at the head of theunderqueue is scheduled to run on the PCPU, which consumescredits of the scheduled VCPU. Accordingly, the more active VMs (VCPUs) the PM over-subscribes, the longer time VCPUs have to wait in the queue, which hence results in severe VM interference. As shown in Fig. 5, the VCPU queueing time is nearly zero when there is no over-subscription (Nvm ≤ 8). When over-subscription occurs (Nvm > 8), the VCPU queueing time shows a roughlylinearincrease. In particular, the percentage of VCPU queueing time in the execution duration of applications is capped by
Nvcpu
Npcpu −1, whereNvcpu andNpcpu denote the number of
VCPUs and PCPUs hosted on Ph, respectively.
Next, observation (2) can be explained by: the heavy contention on cache space and memory bandwidth will lead to severe co-location interference [15], [33]. Specifi-cally, we use the cache miss ratio and physical memory utilizationP Umto estimate the cache and memory band-width contention on a PM, based on the rationale that the severe cache and memory bandwidth contention will be likely to cause more cache misses and higher memory utilization. As shown in Fig. 6, the cache miss ratios of the PM Ph for both the gobmk and mcf applications basically follow the trend of their respective performance degradation in Fig. 4 without VM over-subscription. In addition, our resource tracing tool reveals that the memory utilization P Um of Ph is linear to Nvm, which can also explain the performance degradation of gobmk and mcf applications in Fig. 4.
mech-anisms [27]: the Xen backend driver in domain-0 man-ages the I/O rings from the running VMs in a simple round-robin manner [10]. Virtual hardware (i.e., network) interruptsof VMs are sent to the backend driver through the event channel, and such events are processed in strict round-robin order in the backend driver to en-sure fairness [27]. Accordingly, theNvm co-located VMs running netperf applications on a PM roughly share the total network bandwidth Bm of the PM. Hence, the network throughput of each VM is around Bm
Nvm.
Since the netperf application tends to make full use of
Bm when it runs alone on the PM, the performance degradation of Nvm co-located VMs can be quantified as (Bm− NBvmm )/Bm = 1−N1vm. In summary, the three explanations above inspire us to utilize not only V U
and P U but also the cache miss ratio and VM network interrupts as the key factors, in order to reflect VM co-location interference, as we will elaborate in Sec. 3.
3
A S
IMPLEE
STIMATIONM
ODEL OFVM I
N-TERFERENCE
Based on the empirical understanding above, how can we effectively estimate both VM migration interference and VM co-location interference in a holistic manner? As evi-denced by Sec. 2, both VM migration and co-location interference can be essentially viewed as the mismatch between aggregated resources “demands” of co-located VMs (including the migrated VM and domain-0) and shared resources “supply” provided by the migration source and destination PMs. In response, we design a simple multi-resource demand-supply model [34] in
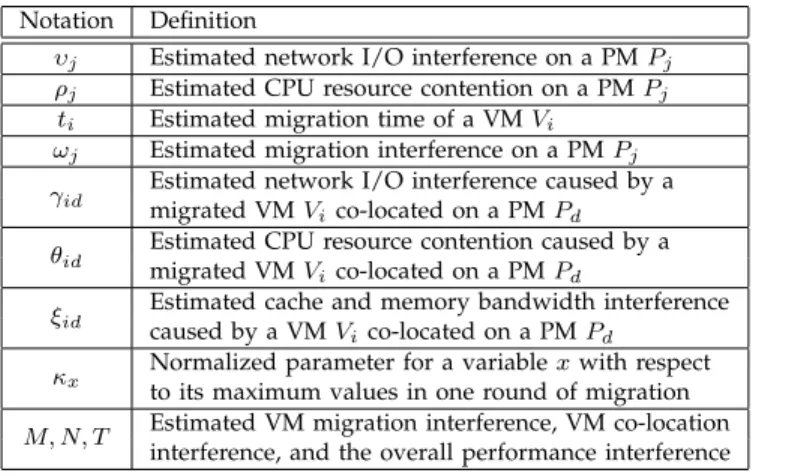
iAware, which unifies the key factors that are previously identified in Sec. 2. The notations used in our estimation model are summarized in Table 3.
3.1 Demand-Supply Model of VM Migration Interfer-ence
As demonstrated in Sec. 2.1, VM live migration can be viewed as a network-intensive and CPU-moderate appli-cation indomain-0, which implies that migrating VMs on the PMs with heavy I/O and CPU contention will cause severe migration interference. This inspires us to model VM migration interference as a function of network I/O contention and CPU resource contention on both migration source and destination PMs, which highly depends on
Xen I/O mechanisms [27] and VCPU scheduling mech-anisms [26], as we elaborated in Sec. 2.2.
We first estimate the network I/O interference among VMs based on Xen I/O mechanisms [27]. Specifically, we use the number of network interrupts inside a VM to reflect its network I/O “demand.” As the virtual inter-rupts from all VMs on a PM are eventually handled by the backend driver in domain-0, the number of network interrupts indomain-0can be regarded as how many I/O “demands” from all VMs are “satisfied” by the hosting PM. Accordingly, we characterize the network I/O con-tention by using a notion of demand-supply ratio of the
TABLE 3: Key notations in our estimation model. Notation Definition
υj Estimated network I/O interference on a PMPj ρj Estimated CPU resource contention on a PMPj
ti Estimated migration time of a VMVi ωj Estimated migration interference on a PMPj γid Estimated network I/O interference caused by a
migrated VMVico-located on a PMPd θid Estimated CPU resource contention caused by a
migrated VMVico-located on a PMPd
ξid Estimated cache and memory bandwidth interference caused by a VMVico-located on a PMPd
κx Normalized parameter for a variablexwith respect to its maximum values in one round of migration M, N, T Estimated VM migration interference, VM co-location
interference, and the overall performance interference
total number of network interrupts observed in VMs to that observed in domain-0. Intuitively, the higher such a demand-supply ratio is, the more severe the network I/O contention becomes. Furthermore, we observe that the network throughput of VMs tends to fluctuate wildly under severe network I/O contention. To capture such effects, we also take into account the variation coefficient of network throughput of VMs, which is defined as the ratio of the standard deviation to the mean of network throughput of VMs.
We assume that time t is slotted (e.g., one second per slot). During a period of τ time slots, the network throughput of VM Vi is sampled as Hi(t, τ) = {Hi(t−
τ), Hi(t−τ + 1), . . . , Hi(t−1)}. Likewise, the number
of network interrupts of Vi is sampled as Ii(t, τ) =
{Ii(t−τ), Ii(t−τ+ 1), . . . , Ii(t−1)}. Then, we calculate
the meanµihand standard deviationσihofHi(t, τ), and the meanµitofIi(t, τ)for each VM, including the mean
µ1t for thedomain-0 (i.e.,V1). Suppose we haveαj VMs hosted on the PM Pj including domain-0, we estimate their network I/O interferenceυjon the PMPjas Eq. (1), which will be qualitatively validated in Sec. 5.1.
υj=fυ(σih, µih, µit)≈ αj X i=2 σih µih + αj P i=2 µit µ1t . (1)
We next estimate the CPU resource contention among VMs based on the VCPU scheduling mechanisms [26]. As demonstrated in Sec. 2.2, more active VMs (VCPUs) hosted by a PM will lead to heavier CPU resource con-tention, which can be characterized by another ratio of the total CPU “demands” of co-located VMs to the CPU “supply” of the hosting PM. Specifically, we calculate the sum of the CPU utilization and percentage of VCPU queueing time observed in a VM as its CPU “demand,” and the number of PCPUs on the hosting PM as its CPU “supply.” Accordingly, the CPU resource contention ρj on a PMPj is estimated by ρj=fρ(V Uic, Qi, Ni, Nj)≈ αj P i=1 (V Uic+Qi)·Ni Nj , (2)
where V Uic and Qi denote the CPU utilization and percentage of the VCPU queueing time observed in a VM Vi, respectively. Ni is the number of VCPUs hosted byVi, andNj is the number of PCPUs hosted byPj.
By combining the two essential models above, we estimate the migration interferenceωjon co-located VMs hosted by a migration source or destination PMPj as
ωj=fω(υj, ρj)≈κυ·υj+κρ·ρj, (3)
where κυ and κρ are the parameters that normalize the variables υj, ρj with respect to their respective maxi-mum values obtained across all migration source and destination PMs during one round of VM migration. In particular, κυ is set to zero if the datacenter adopts a dedicated migration network, as discussed in Sec. 2.1.κρ is set to zero if the datacenter statically pins the VCPU(s) ofdomain-0to non-shared PCPU(s). We will validate the effectiveness of the iAware model in a cloud platform with a dedicated migration network in Sec. 5.2.
In addition, to evaluate the migration interference on the migrated VMs, we also incorporate another key factor, theVM migration time, into our estimation model. Specifically, the major factors impacting VM migration time are the memory size mi, memory dirtying rate Di of the VM to be migratedVi, and the available network bandwidth Ri [13] for Vi as well as the number of concurrent migrations ci [8] withVi. For simplicity, we approximately calculate the migration time ti as
ti=ft(mi, ci, Ri, Di)≈
mi·ci
Ri−Di
. (4)
In summary, the VM migration interferenceM on the migration source PM Ps and destination PM Pd as well as the migrated VMVi can be characterized as
M =fM(ωs, ωd, ti)≈ωs+ωd+κt·ti, (5)
where ωs and ωd are the migration interference on Ps and Pd, respectively. Similar toκυ andκρ in Eq. (3), the parameter κtnormalizes the VM migration timeti with respect to its maximum value of all possible choices of VMs to be migrated in one round of VM migration.
3.2 Demand-Supply Model of VM Co-location Inter-ference
According to our key findings in Sec. 2.2, VM co-location interference is mainly caused by the contention of shared and constrained network bandwidth, CPU, as well as the cache and memory bandwidth, with the condition of non-overlapped memory allocated to each active VM. This guides us to model VM co-location interference as a function of network I/O contention, CPU resource contention, cache and memory bandwidth contention on mi-gration destination PMs. We assume that the datacenter is provisioned with homogeneous or similar types of PMs [35].
First, we estimate the network I/O interference caused by a migrated VM Vi co-located on the destination PM
Pd. Based on Xen I/O mechanisms [27], we can infer that if a VM with heavy network I/O “demand” is mi-grated to a destination PM with constrained bandwidth “supply” and severe network I/O contention (i.e., υd), then the I/O throughput of other co-located VMs on the destination PM is more likely to deteriorate. Specifically, we use the mean value of network interruptsµit inside
Vias its network I/O “demand,” the maximum network interrupts µdt that Pd can sustain per time slot as its network I/O “supply.” The network I/O contention υd onPd is estimated by Eq. (1). Accordingly, we estimate the network I/O interferenceγid by
γid=fγ(µit, µdt, υd)≈
µit
µdt
+υd. (6)
We next estimate the CPU resource contention caused by a migrated VM Vi co-located on the destination PM
Pd. The VCPU scheduling mechanisms [26] elaborated in Sec. 2.2 implies that a VM with a large amount of CPU computation “demand” migrated to a destination PM with scarce CPU resource “supply” will lead to heavy CPU resource contention. Similar to Eq. (6) above, we estimate the CPU resource contention θid as
θid =fγ(di, Nd, ρd)≈
di
Nd
+ρd, (7)
wheredidenotes the CPU resource “demand” ofVi. Both the number of PCPUsNd and CPU resource contention before migrationρd denote the CPU resource “supply” of Pd. Specifically, as in Sec. 3.1,di is calculated as the CPU utilization plus the percentage of VCPU queueing time observed inVi, andρd can be calculated by Eq. (2). We finally estimate the cache and network bandwidth interference caused by a migrated VM Vi co-located on the destination PM Pd. Guided by the analysis in Sec. 2.2, we infer that the contention on cache space and memory bandwidth tends to become severe, if a VM with large cache and memory bandwidth consumption is migrated to a destination PM with scarce remaining cache and memory bandwidth resource. Accordingly, we construct two demand-supply ratios of the cache space and memory bandwidth “demands” ofVito the remain-ing cache space and memory bandwidth “supplies” on
Pd, respectively, which are combined together to estimate the cache and memory bandwidth interferenceξid as
ξid=fξ(P Um, V Um, sdp, siv)≈ V Uim 1−P Udm + β·siv 1−sdp , (8)
where V Uim and P Udm denote the memory utilization onVi and Pd, respectively. siv andsdp denote the cache miss ratio on Vi and Pd, respectively. In particular, β ∈
(0,1]is a scale factor ofsiv to estimate the “demand” of cache space consumption inVi (i.e.,the cache miss ratio obtained inVi running alone on a PM). We empirically set the factorβ as one minus the cache miss ratio of the migration source PM.
Combining the three essential models above, VM co-location interferenceN caused by a migrated VMVi on
the destination PM Pd is estimated as
N=fN(γid, θid, ξid)≈κγ·γid+κθ·θid+κξ·ξid, (9)
where κγ,κθ and κξ are the parameters that normalize each variableγid,θid,ξid with respect to their respective maximum values, obtained across all possible choices of VMs to be migrated and their corresponding migration destination PMs in one round of VM migration. In particular,κθ is set to zero if the datacenter assigns each active VM with non-shared PCPU(s). We will qualita-tively validate the model above in Sec. 5.1.
In summary, the overall VM performance interference
T can be considered as a function of the estimated VM migration interference M in Eq. (5) and VM co-location interference N in Eq. (9), which is given by
T =fT(M, N)≈a·(κM ·M) +b·(κN ·N). (10)
For numerical stability, the parameters κM andκN nor-malize interference values M, N with respect to their respective maximum values, obtained across all possible choices of VMs to be migrated and their corresponding migration destination PMs in one round of VM migra-tion. In particular,aandbare the relative weights of VM migration interference versus VM co-location interfer-ence, respectively, anda+b= 1. By tuning the values of
aandb, ouriAwareVM live migration strategy is flexible enough to selectively switch our design choices between different aspects of performance interference during and after VM migration, as demonstrated in Sec. 5.2.3.
4
A
NI
NTERFERENCE-A
WAREVM M
IGRATIONS
TRATEGYBased on both the empirical understanding and simple estimation model of VM performance interference in previous sections, we present iAware in Algorithm 1 for making decisions on which candidate VMs are to be migrated to which PMs, in order to jointly mitigate both the VM migration interference and co-location interfer-ence in a holistic manner. In particular, when or whether to migrate VMs can be periodically evaluated by load balancing, power saving or any other VM (or server) managements in datacenters, rather than byiAware.
When one or multiple VMs V need to be migrated
for achieving load balancing or power saving in dat-acenters, iAware first selects a subset C of candidate
VM(s) with the least estimated migration interference on the running VMs hosted by source PM(s). Then, iAware
decides which PM(s) can serve as the potential migration destination for those candidate VM(s) in C, by further
estimating VM co-location interference. Specifically, for each pair of VM in C and available PM, iAware infers
whether the PM can host the VM, according to the VM assignment constraint on the memory capacity [28]. Only capable PMs are the candidate destinations worthwhile for jointly calculating both the estimated migration in-terference and co-location inin-terference, according to our simple multi-resource demand-supply model in Sec. 3.
Algorithm 1:iAware: interference-aware VM live mi-gration strategy.
Input:(1)kpotential candidate VMs for migration
V={V1, V2,· · ·, Vk}, (2)lavailable PMsP={P1, P2,· · ·, Pl}. Output: Selected VM to be migrated and migration destination PM. Symbol:(1)M,N,T,ωj,ti,κxare listed in Table 3, (2) the subset
of candidate VMs for migrationC.
Stepa). Select candidate VM(s) with the least estimated migration interference on the migration source PM(s).
1: Initializeωmin←inf,C←∅; 2: for allVMVi∈Vdo
3: ωs←Eq. (3) for computing migration interference on the source PM hostingVi;
4: ifωmin> ωsthen 5: ωmin←ωs;C←Vi; 6: else ifωmin==ωsthen
7: C←C∪ {Vi};
8: end if 9: end for
Stepb). Identify a pair of VM to be migrated and destination PM by jointly minimizing VM migration and co-location interference. 10: InitializeTmin←inf,Vmin← −1,Pmin← −1;
11: for allVMVi∈Cdo
12: for allPMPj∈Pcapable of hostingVido
13: ωd←Eq. (3) with (Vi, Pj) for computing migration interference on the destination PM;
14: M←ωmin+ωd+κt·tiaccording to Eq. (5); 15: N←Eq. (9) with (Vi, Pj) for computing co-location
interference on the destination PM;
16: T←a·(κM·M) +b·(κN·N) according to Eq. (10); 17: ifTmin> T then
18: Tmin←T;Vmin←i;Pmin←j;
19: end if
20: end for 21: end for
22: return Vmin andPminas the selected VM and PM indices inV andP, respectively.
After iteratively electing the appropriate destination PM for each VM inC,iAwarecan identify a pair of VM and
PM with the minimum overall performance interference. Given the detailed notations in Algorithm 1, the com-plexity of the iAware strategy is determined by the number of candidate VMs for migration |C| and the
number of available PMsl. Suppose the total number of PMs in the datacenter is m, the worst-case for strategy computation is in the order of O(m·k), when the total
k VMs in V are selected as the candidate VMs for
migration (i.e.,C=V), and all PMs in the datacenter are
available for migration (i.e., l = m). In practice, given the average number of VMs hosted on a PMNvmin the datacenter, we have m ≈ k
Nvm. Hence, the complexity
of the iAware strategy can be further simplified as: (1)
O(m·k) ≈ O(k2) in the scenario of a PM hosting less
than tens of VMs on average,e.g.,Nvm= 5without VM over-subscription, or (2)O(m·k)≈ O(k)in the scenario of a PM hosting hundreds of VMs on average, e.g.,
Nvm = 100 by VM over-subscription. We will validate
the computational complexity of iAwarein Sec. 5.3. TheiAwarestrategy can be iterative if multiple rounds of VM migrations are required for reaching a given degree of load balancing or power savingχ. As we will demonstrate in Sec. 5.2,iAwareis flexible and lightweight enough to be incorporated into existing VM migration
t0 t0+Tc t0+2Tc t0+3Tc . . . t0+8Tc Tc Tm tm (a) start tm+Tm (d) sleep (c) migration Time alg1(b) tm+Ta+Tmig tm+Ta
Fig. 7: Timing and operation process ofiAware, whereTcandTmare the communication interval and migration decision interval, respectively: (a) first, when or whether to migrate VMs is evaluated by VM (or server) managements in datacenters at tm, (b) Algorithm 1 execution, which is enabled based on the resource utilization information of PMs and VMs collected in the last communication interval[t0, t0+Tc], takes a processing time ofTato make the migration decision, (c) following the decision, the live migration is performed with a duration ofTmig, (d) then, Algorithm 1 sleeps forTsuntil the next migration decision interval.
and consolidation policies (e.g.,[4], [7]) in a complemen-tary manner, for mitigating extra performance loss in the cloud. To avoid excessive rounds of VM migrations, the iteration of theiAwarestrategy terminates when any of the following three simple conditions holds: (1) the total rounds of VM migrations exceed a threshold which is equal to the number of potential candidate VMs for migration k, (2) the degree of load balancing or power saving χi for i-th iteration is worse than χi−1 for the
previous iteration, (3) χi surpasses the target χ given by datacenter operators. The iteration-exit conditions of
iAware will be validated in Sec. 5.2. Please also refer to the online supplementary material for detailed pseu-docode and additional experimental results.
More Specifically, Fig. 7 illustrates the timing and operation process of theiAware strategy with two types of time intervals: (1) the aforementioned communication interval Tc for periodic information collection, and (2) the migration decision interval Tm for one round of the iAware strategy execution, which consists of the processing time Ta of Algorithm 1, migration time Tmig of the migrated VM and sleep time Ts of Algorithm 1 after the VM migration. To avoid frequent and noisy migrations, the migration decision interval, which can be flexibly determined by the system administrator, is relatively longer than the communication interval, such as ranging from minutes (e.g., 5 minutes in VMware Distributed Resource Scheduler (DRS) [36]) to one hour.
5
P
ERFORMANCEE
VALUATIONIn this section, we carry out a series of experiments using mixed types of representative workloads in Table 1, to evaluate the effectiveness of our estimation model of VM performance interference and VM migration strategy of
iAware. Specifically, we demonstrate the performance gain and runtime overhead of iAware, in comparison to both the First-Fit Decreasing (FFD) [7] and Sand-piper [4] algorithms. Furthermore, complementary large-scale simulations are conducted to validate the scalability of iAware.
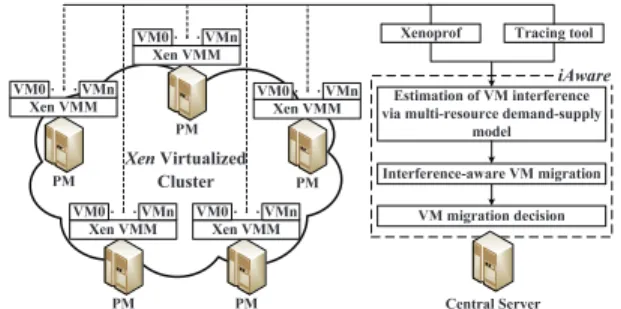
We implement a prototype ofiAware with3,600 lines of C code, based on ourXenvirtualized cluster platform illustrated in Fig. 8, which includes: (1) Enterprise-class PMs (described in Sec. 2) that host running VMs. Inside
Xen Virtualized Cluster
PM Xen VMM
VM0 VMn Xenoprof Tracing tool
Central Server Estimation of VM interference via multi-resource demand-supply
model iAware Interference-aware VM migration VM migration decision PM Xen VMM VM0 VMn PM Xen VMM VM0 VMn PM Xen VMM VM0 VMn PM Xen VMM VM0 VMn
Fig. 8: Implementation ofiAwareupon aXenvirtualized cluster.
each VM (including domain-0), we use our aforemen-tioned tracing tool together withxenoprof [30] to record
V U,P U, the cache miss ratio. In addition, the number of network interrupts is measured using the Linux tool “vmstat”, and VM memory dirtying rate can be obtained by tracking the shadow page tables inXenas in [13]. (2) Central server(s) with iAware that periodically commu-nicates with all active VMs to collect the information of multi-dimensional resource consumption in our Xen
virtualized cluster. To reduce the communication and computation overhead of servers, we set the communica-tion interval to10seconds, and simply input the average of resource utilization of PMs and VMs during the last communication interval in theiAwarestrategy. When one or multiple VMs need to be migrated for load balancing or power saving, iAware on the central server(s) will estimate VM performance interference through the sim-ple multi-resource demand-supply model in Sec. 3, and apply the interference-aware strategy in Sec. 4 to make VM migration decisions accordingly.
5.1 Validating Estimation Models of VM Interference
We first validate theiAwaremodel of network I/O inter-ference in Sec. 3.1. To this end, we useIxChariot console
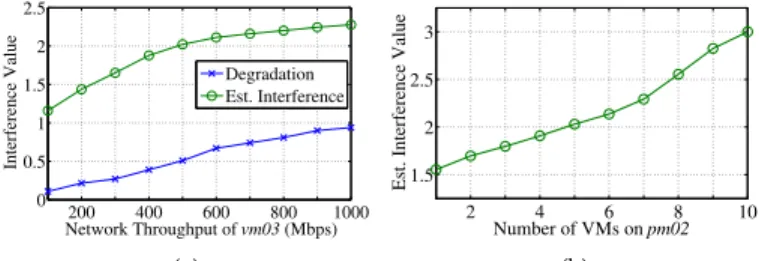
version 5.4 andendpoint version 5.1 [37], which are the leading testing tools for real-world network applications, to generate network I/O demands in three co-located VMs on a PM for emulating different network I/O contention scenarios. Specifically, we statically set the network throughput of vm01 and vm02 to 200 Mbps and 400 Mbps, respectively, and gradually vary the network throughput of vm03 from 100 Mbps to 1,000
Mbps with the step of100Mbps. We record their actual I/O throughput and network interrupts for 10 seconds to estimate the network I/O interference υj by Eq. (1), and calculate the overall I/O throughput degradation of the three co-located VMs according to the perfor-mance degradation metric defined in Sec. 2.2. As shown in Fig. 9(a), the estimated network I/O interference follows the trend of actual I/O throughput degradation of the three VMs, which validates the effectiveness of our estimation model of network I/O interference.
Next, we validate the iAware model of co-location interference caused by the migrated VM at the desti-nation PM in Sec. 3.2. In particular, we conduct exper-iments with two PMs (i.e., pm01, pm02), which act as the migration source and destination PMs, respectively.
200 400 600 800 1000 0 0.5 1 1.5 2 2.5 Network Throughput of vm03 (Mbps) Interference Value Degradation Est. Interference (a) 2 4 6 8 10 1.5 2 2.5 3 Number of VMs on pm02
Est. Interference Value
(b)
Fig. 9: Validation of the estimation model: (a) The estimated network I/O interference and actual I/O throughput degradation of the three VMs, as the network throughput ofvm03varies from100Mbps to1,000Mbps. (b) The estimated co-location interference caused by vm01 migrated frompm01topm02, as the number of VMs onpm02varies from1to10.
pm01 hosts the VM vm01 to be migrated, and pm02
hosts various numbers of VMs from 1 to 10. Each VM runs the mcf application of SPECCPU2006 [21]. We record P U, V U and cache statistics in PMs and VMs, and estimate VM co-location interference N caused by
vm01 migrated on pm02 by Eq. (9). As the number of VMs on pm02 increases in Fig. 9(b), we observe that migrating vm01 on pm01 to pm02 would incur severe VM co-location interference, which captures the actual trend of performance degradation experienced by the mcf application in Fig. 4. Furthermore, the effectiveness of the iAwarestrategy using such qualitative estimations will be further demonstrated by Sec. 5.2.
5.2 Effectiveness and Overhead ofiAware
We further examine the effectiveness and runtime over-head of iAwareunder mixed types of benchmark work-loads in Table 1. Specifically, we use W1, W2, W3, W4,
and W5 to denote the VMs hosting SPECCPU2006 [21],
netperf v2.5.0 [22], Hadoop v0.20.203.0 [23], NASA paral-lel benchmark (NPB) v3.3.1 [24], and SPECweb2005 [25], respectively. By assigning each type of workloads with a group of10VMs, we have50VMs in ourXenvirtualized cluster in total. The VMs are configured as small or large VM instances as elaborated in Sec. 2. We use WxL to denote a large VM instance hosting a workload x, and
Wx∼y to denote a sequence of VMs from Wx to Wy, where x, y ∈ {1,2,3,4,5} and x < y. Fig. 10 shows the initial placement of VMs and workloads across PMs, where the CPU resource ofP1,P2,P4,P5andP6is
over-subscribed for hosting VMs.
In particular, the workload performance is measured as network throughput, application execution durations or the number of successfully served requests. Specif-ically, the performance results of SPECCPU and net-perf are the average across the instances hosting them on the migration source and destination PMs, whereas Hadoop, NPB, and SPECweb retrieve their performance results from their respective “master” instances, which coordinate other “slave” instances to finish the assigned jobs. To make performance evaluation accurate, we run workloads 5times when examining each VM migration strategy, and illustrate our performance results with error bars of standard deviations. We initially set the execution duration of workloads to450 seconds.
P1 P2 P3 P4 P5 P6 P7 P8 P9
W1~5,1 W1~5 W1~5 W1~5 W1~5 W2~5 W2~4
W1,1,1 W1L W5,5 W2L W3L W4,5L
W3,4,4 W2,3,5
W2
Fig. 10: Initial placement of VMs and workloads on each PM in ourXen
virtualized cluster with CPU over-subscription.
5.2.1 Performance Comparison of Different Strategies
We first consider a general scenario for VM migration, by setting the VMs hosted onP2as the potential candidate
VMs for migration and{P1, P3, P4,· · · , P9} as the
avail-able PMs. Fig. 11 illustrates the VM migration decisions made by the FFD [7] algorithm for power saving and the Sandpiper [4] algorithm for load balancing, compared to
iAware in Algorithm 1. We observe that: (1) both FFD and Sandpiper select the large VM instance W1L as the candidate VM to be migrated from P2, while iAware
selects a small VM instanceW3. (2) FFD and Sandpiper
choose P3 and P7 as the migration destination PMs,
respectively, whileiAwarechooses another PM P8.
P2 P2 P7 W1~5 W1~5 W3,4,4 W1L P2 P8 W1,1L,2,4,5 W2~4 W3 FFD Sandpiper iAware P3 W1~5,5,5 W1L
Fig. 11: VM migration decisions made by FFD, Sandpiper andiAware
strategies.
The rationale is that FFD prefers to migrate the VM with the largest CPU and memory size to the first-fit PM, according to the VM assignment constraint on the memory capacity [28]. Sandpiper prefers to migrate the most loaded VM to the least loaded PM. In particular, the most loaded VM is actually the VM with the maximum volume-to-memory-size ratio [4], where the volume of a VM is calculated with its virtual resource utilization
as 1
(1−V Uc)·(1−V Um)·(1−V Un). Our tracing tool reveals that
W1L consumes almost 100% of CPU usage and 90% of memory, and hence it is selected by Sandpiper to be migrated to P7, which is the least loaded PM
ac-cording to (1−P Uc)·(1−P U1 m)·(1−P Un) [4]. In contrast, by
estimating thatW3has the least estimated VM migration
interference on the source PM, iAware chooses it to be migrated toP8 with the least estimated VM co-location
interference, so as to jointly minimize VM performance interference both during and after VM migration.
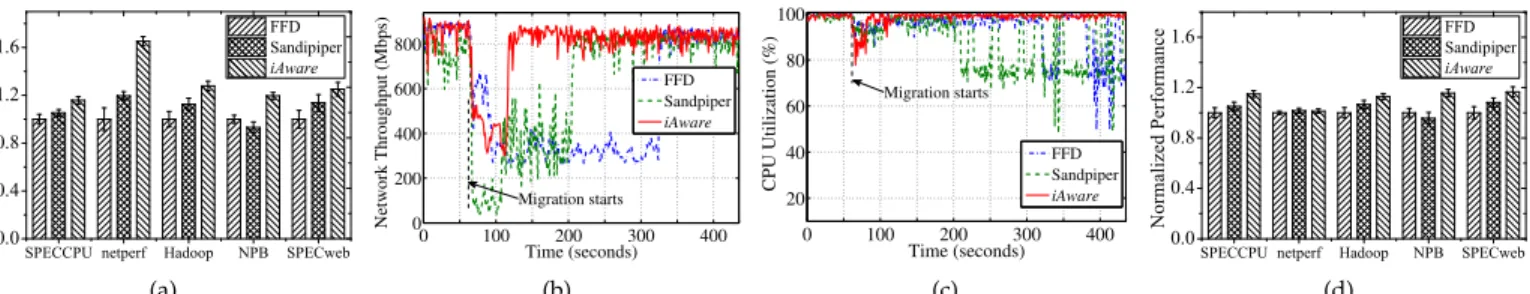
Fig. 12(a) compares the normalized performance of representative benchmark workloads with FFD, Sand-piper and iAware strategies in one round of VM mi-gration. We observe that iAware is able to improve the performance by around 45%-65% for network-intensive workloads (i.e., netperf), and 16%-28% for workloads that are CPU, memory and network-intensive (i.e., SPEC-CPU, Hadoop, NPB and SPECweb), as compared to FFD and Sandpiper. To look into the performance gain obtained byiAware, we further examine the performance of VMs over time during and after VM migration in Fig. 12(b) and Fig. 12(c). We observe that both FFD and
SPECCPUnetperf Hadoop NPB SPECweb 0.0 0.4 0.8 1.2 1.6 N o r m a l i z e d P e r f o r m a n c e FFD Sandipiper iAware (a) 0 100 200 300 400 0 200 400 600 800 Network Throughput (Mbps) Time (seconds) FFD Sandpiper iAware Migration starts (b) 0 100 200 300 400 20 40 60 80 100 CPU Utilization (%) Time (seconds) FFD Sandpiper iAware Migration starts (c)
SPECCPUnetperf Hadoop NPB SPECweb 0.0 0.4 0.8 1.2 1.6 N o r m a l i z e d P e r f o r m a n c e FFD Sandipiper iAware (d)
Fig. 12: Workload performance comparison with FFD, Sandpiper and iAwareVM migration strategies. We show the aggregated performance (normalized by using FFD as a baseline) in a cloud platform with (a) a shared network and (d) a dedicated migration network. We also show the performance of VMs over time on both the migration source and destination PMs, in terms of (b) network throughput (i.e.,netperf) and (c) CPU utilization (i.e.,NPB) during and after VM migration.
Sandpiper severely degrade the network throughput and CPU utilization of VMs compared to iAware.
The rationale is that, the VMs for migration selected by FFD and Sandpiper (e.g.,W1L) have a large VM size and
a high memory dirtying rate. Moreover, the migration destination PMs selected by FFD and Sandpiper (i.e.,
P3, P7) have constrained CPU, memory and network
resources. Such migration decisions would incur more severe CPU, memory and network I/O interference on both the source and destination PMs, and thus affect VM performance for a longer duration than iAware. In contrast, iAware chooses to migrate W3 on P2 to P8,
which leads to the least CPU, network I/O and memory bandwidth contention during and after VM migration.
In addition, we examine the effectiveness ofiAwarein the cloud platform with a dedicated migration network. Both FFD and Sandpiper make the same migration de-cisions as in the cloud platform with a shared network, since they do not distinguish these two platforms. Using the migration interference model Eq. (3) in Sec. 3.1,
iAware is adaptive to the cloud platforms with and without a dedicated migration network. As explained in Sec. 2.1, the dedicate migration network could eliminate the migration interference on the network I/O resource. In such a scenario, it would cause the least perfor-mance interference foriAwareto migrateW3(i.e.,a
CPU-moderate workload) onP2toP9, which has constrained
network resources and a sufficient amount of CPU resources. Fig. 12(d) shows the normalized workload performance in a cloud platform with a dedicated mi-gration network. We observe that the performance gain for netperf application is almost eliminated, compared to that in the platform with a shared network shown in Fig. 12(a). Such an observation is consistent with our analysis in Sec. 2.1. In contrast, the performance gain for the other workloads still exists, as migration interference on the CPU resource and co-location interference are both minimized by the iAwarestrategy.
5.2.2 Strategy Cooperation for Load Balancing and
Power Saving
Moreover, we examine whether iAware can cooperate with existing VM migration policies in a complementary manner. We first conduct an experimental case study for achieving load balancing by incorporating iAware into Sandpiper [4] (denoted as iAware-Sandpiper). To allow
multiple VM live migrations, we extend the running durations of workloads to1050seconds. Given that one migration process lasts for 60 – 200 seconds as shown in Sec. 2.1 and the sleep time of iAware after migration is empirically set as 60 seconds in our platform, the running time of 1050 seconds can support up to 4 – 8
(i.e., b 1050
200+60c = 4,b 1050
60+60c = 8) live migrations, which
meets our requirement to examine the effectiveness of
iAware in load balancing and power saving scenarios. Essentially, our experiment results can be generalized to the other scenarios for VM migration in datacenters, such as hardware update and server maintenance.
We employ the hotspot detection strategy from Sand-piper [4] to trigger VM migration, according to the set-ting of CPU usage threshold (i.e.,75%). Under the initial VM placement in Fig. 10, the CPU consumption on P1
and P2 exceeds the CPU usage threshold, and thus one
or multiple VMs onP1 and P2 need to be migrated for
load balancing on CPU usage in our cluster. We choose those VMs with their PCPU utilization greater than75% on P1 and P2 as the set of potential candidate VMs
for migration V. Accordingly, the original Sandpiper
chooses to migrate W1L on P2 to P7, and W1 on P1
to P8, respectively, while iAware-Sandpiper chooses to
migrateW4onP2toP8, andW4onP1toP9, sequentially.
Hence, the total rounds of migration under bothiAware -Sandpiper and the original -Sandpiper are2, which shows that the iteration rounds of our strategy can be well-controlled by the exit conditions as elaborated in Sec. 4. Fig. 13(a) compares the normalized workload perfor-mance with the original Sandpiper, iAware-Sandpiper strategies and the base case without VM migration. We observe thatiAware-Sandpiper outperforms the original Sandpiper by7%-32%. However, the performance of net-perf application under Sandpiper andiAware-Sandpiper becomes worse than that in the base case. The reason is that the network-intensive workload (i.e., netperf) is significantly affected by VM live migration process, as we have analyzed in Sec. 2.1. The performance of NPB workload under iAware-Sandpiper is much better than that with the original Sandpiper and the base case, as
iAware-Sandpiper migrates the two VMs W4 (i.e., NPB)
to the least loaded PMs P8 and P9, respectively, which
incurs the least contention on CPU, cache and mem-ory bandwidth resources. After these VM migrations have been performed, the standard deviations of CPU
SPECCPUnetperf Hadoop NPB SPECweb 0.0 0.4 0.8 1.2 1.6 N o r m a l i z e d P e r f o r m a n c e Base case Sandpiper iAware-Sandpiper (a)
SPECCPUnetperf Hadoop NPB SPECweb 0.0 0.4 0.8 1.2 1.6 N o r m a l i z e d P e r f o r m a n c e FFD iAware-FFD (b)
Fig. 13: Workload performance comparison: (a) under Sandpiper andiAware-Sandpiper VM migration strategies, for achieving load balancing on CPU usage in the datacenter; (b) with FFD andiAware-FFD VM consolidation strategies, for achieving power saving in the datacenter.
SPECCPUnetperf Hadoop NPB SPECweb 0.0 0.4 0.8 1.2 1.6 N o r m a l i z e d P e r f o r m a n c e OC and MFC OM EMC
Fig. 14: Performance comparison of representa-tive benchmark workloads using theiAwareVM migration strategy with various design choices,
i.e.,OM, EMC, OC and MFC.
utilization of all PMs in our cluster under Sandpiper and iAware-Sandpiper have become 0.1634 and 0.1422, respectively. This implies thatiAware-Sandpiper can bal-ance the CPU utilization of all PMs across the cluster as well as the original Sandpiper, while mitigating an addi-tional performance loss during and after VM migration. Furthermore, iAware is also able to cooperate with existing VM consolidation policies for achieving power saving, such as the classic FFD [7] algorithm. Specifically, we incorporate iAware into FFD (denoted as iAware -FFD) and compare the workload performance with the original FFD and iAware-FFD. In particular, this power saving scenario can be viewed as a special case ofiAware, as all the VMs hosted on under-utilized PMs should be migrated. Then,iAware-FFD does not need to choose the cost-effective VMs for migration. It only needs to choose the cost-effective destination PMs among available PMs. Under the initial VM placement in Fig. 10, both FFD and iAware-FFD choose to migrate the VMs on P7 to
other PMs, as P7 is the least loaded PM in the cluster
according to 1
(1−P Uc)·(1−P Um)·(1−P Un) [4]. Suppose that
all PMs except the source PM P7 could serve as the
candidate destination PMs under FFD and iAware-FFD.
iAware-FFD migratesW3toP8,W4toP9and anotherW4
toP8, sequentially, with the least estimated performance
interference. In contrast, FFD migratesW4toP1, another
W4andW3toP3, sequentially, asP1andP3are the
first-fit PMs for these VMs to be migrated. The total rounds of migration under both FFD and iAware-FFD are3 as the three VMs on P7 need to be migrated for power saving.
Fig. 13(b) compares the normalized workload perfor-mance with FFD andiAware-FFD strategies. We observe that all the workloads achieve much better performance under iAware-FFD than that with the original FFD by
15%-30%. This is because FFD is oblivious to VM perfor-mance interference and greedily consolidates VMs on a PM, which makes P1 and P3 over-subscribe more VMs.
Accordingly, the workloads on the two PMs will take more time to complete. In particular, the performance of NPB and netperf applications is much better than the other workloads. The rationale is that, FFD migrates two VMs ofW4(i.e.,NPB) to the most loaded PMsP1andP3,
respectively, which would incur severe VM performance interference on CPU and network I/O resources. In contrast,iAware-FFD seeks to alleviate such performance loss during VM consolidation by selecting PMs with the least estimated performance interference forW3andW4.
To examine the power efficiencyof the cluster handled by FFD andiAware-FFD VM consolidation strategies, we estimate the power consumption of clusters as a roughly linear function of the average CPU utilizationutof PMs, which is empirically verified by the realistic statistics in Google datacenters [38]. Specifically, the power function is given byP(ut) =F(n) +n·(Ppeak−Pidle)·(2ut−urt), wherenis the number of PMs in a datacenter; the factor
ris an empirical constant equal to1.4;Fn,PpeakandPidle are constant values. As captured by our resource tracing tool, the average CPU utilization of PMs after VM mi-grations with FFD andiAware-FFD is0.5116and0.5456, respectively. Accordingly, the variable part (2ut −urt) of the power consumption P(ut)with FFD andiAware -FFD is0.6319and0.663, respectively, which implies that the cluster power consumption underiAware-FFD tends to be slightly higher than that under FFD. As a result,
iAware-FFD can achieve better workload performance with an acceptable cost of power consumption, as com-pared to greedy VM consolidation strategies.
5.2.3 Flexible Design Choices of iAware
In addition, iAware can provide flexible design choices
for cloud service providers by fine tuning the relative weights of VM migration interference versus VM co-location interference, denoted as a and b in Eq. (10) of Sec. 3. By treating the VMs on P2 as the potential
candidate VMs for migration, we examine the migration decisions and workload performance under the iAware
strategy with four representative design choices: (1) EMC:a= 0.5, b= 0.5, equally considering VM migration and co-location interference; (2) OM: a = 1, b = 0, only considering VM migration interference; (3) OC:
a = 0, b = 1, only considering VM co-location interfer-ence; (4) MFC:a = 0.3, b = 0.7, jointly considering VM migration and co-location interference while putting an emphasis on the latter. We observe thatiAwaremigrates
W3 on P2 to P8 and W5 on P2 to P7 under EMC and
OM configurations, respectively. For both OC and MFC configurations, iAwaremigratesW4 onP2to P9.
Fig. 14 shows that different choices ofaandbare suit-able for different types of workloads: (1) OC and MFC configurations achieve slightly better performance of CPU-intensive workloads (i.e.,SPECCPU) than OM and EMC configurations. (2) The performance of network-intensive workloads (i.e.,netperf) under the OM config-uration outperforms that under the EMC, OC and MFC
configurations by 6%-32%. (3) EMC configuration im-proves the performance of workloads that are both CPU and network-intensive (i.e.,Hadoop, NPB, SPECWeb) by
3%-13% compared with OM, OC and MFC configura-tions. These design implications can be adopted by cloud service providers to adjust the iAware strategy to adapt to various types of application workloads on demand.
5.2.4 Overhead of iAware
Finally, we evaluate the runtime overhead of iAware in terms of CPU and network I/O consumption on both the central server(s) and VMs in our Xen virtualized cluster. First, we periodically record the total amount of network communication traffic on the central server(s), which is around 35600 bytes every 10 seconds. This is marginal for a 1 Gbps network switch in a datacenter. Second, we examine the CPU usage of our prototype, incurred by the iAware strategy in Algorithm 1 and our resource tracing tool as elaborated in Sec. 5. Specifically, we compare the performance of benchmark workloads with and without our iAware prototype which disables the VM migration function. We find that the benchmark scores of CPU-intensive workloads (i.e., mcf of SPEC-CPU2006 [21]) are affected by around one second due to the CPU overhead ofiAware. These collectively show that
iAwareincurs marginal CPU and network I/O overhead for strategy computation and information collection of multi-dimensional resource utilization of PMs and VMs.
5.3 Validating Scalability ofiAware
To examine the scalability of iAware and obtain com-plementary insights, we also conduct trace-driven sim-ulations using the realistic WorldCup98 Web trace [39]. By replaying50,000seconds of such trace starting from
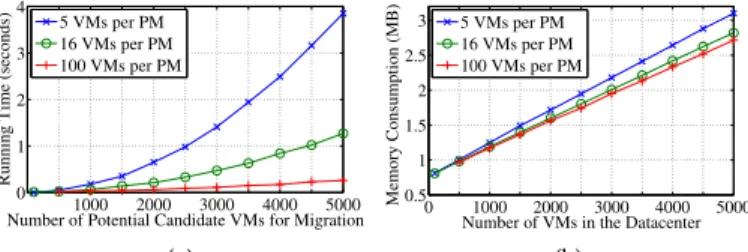
1998/06/01 22:00:01 to 1998/06/02 11:53:21 on a small VM instance hosting the RUBiS Web server [40], we record the resource utilization per second. Then, we extract each continuous 10 seconds of such measured resource utilization to represent the resource consump-tion for different VMs. With these input into the central server of our iAwareprototype, we increase the scale of the datacenter by: (1) setting the average number of VMs hosted on a PM (i.e., Nvm) to 5 or 16 and varying the number of PMs from 7 to1,000, (2) setting Nvm to 100 and varying the number of PMs from 5to 50. Thus, we not only check the running time of the iAware strategy by varying the number of potential candidate VMs for migration from10to5,000, but also sample the memory consumption of the iAwarestrategy by varying the total number of VMs in the datacenter from 10to5,000.
As shown in Fig. 15(a), the running time of iAware
increases quadratically as the number of potential can-didate VMs for migration increases whenNvm= 5or16, while the running time ofiAwareis linear to the number of potential candidate VMs for migration when Nvm increases to100, which is consistent with our complexity analysis in Sec. 4. Specifically, iAware can be finished
1000 2000 3000 4000 5000 0 1 2 3 4
Number of Potential Candidate VMs for Migration
Running Time (seconds)
5 VMs per PM 16 VMs per PM 100 VMs per PM (a) 0 1000 2000 3000 4000 5000 0.5 1 1.5 2 2.5 3
Number of VMs in the Datacenter
Memory Consumption (MB)
5 VMs per PM 16 VMs per PM 100 VMs per PM
(b)
Fig. 15: Scalability of theiAwarestrategy in Algorithm 1: (a) running time of theiAware strategy under different numbers of potential candidate VMs for migration, and (b) memory consumption of theiAwarestrategy under different numbers of VMs in the datacenter, where the number of VMs varies from100to5,000in the scenarios from5VMs per PM to 100VMs per PM, respectively.
within 1second when the datacenter scales up to2,500
VMs. Fig. 15(b) shows that the memory consumption of the iAware strategy in the three scenarios are almost linear to the scale of the datacenter, as iAware requires additional memory to store the collected information of resource utilization of PMs and VMs for its computa-tion. In more detail, the iAware strategy only consumes around 3 MB memory at the central server, even when the datacenter scales up to 5,000VMs.
6
R
ELATEDW
ORK6.1 VM Migration Interference
There have been works on measuring and studying VM migration interference in CPU and memory-intensive scenarios. For instance, [41] quantified VM migration interference as a linear function of the total amount of memory allocated to the VMs to be migrated. [31] con-ducted offline measurements of VM migration interfer-ence for representative multi-tier Web applications. Com-plementary to such works, our study comprehensively measures and analyzes VM migration interference under CPU, cache and memory, and network-intensive scenar-ios, with and without a dedicated migration network (Sec. 2.1). In particular, we carry out an in-depth exam-ination of the multi-dimensional resource consumption of VM migration in domain-0, which has been seldom studied in existing works. Based on the measurements, our multi-resource demand-supply model identifies a set of fine-grained factors associated with the CPU, memory, network I/O contention and migration time (Sec. 3.1), which are more specific and complete than the existing resource contention model [8]. Moreover, the iAware
model estimates VM migration interference online, while prior models (e.g., [8]) mostly work offline and require pre-runs of application workloads and VM migration.
6.2 VM Co-location Interference
There have been several studies on VM co-location in-terference by VM resource contention. For instance, [5] illustrated the severity of co-location interference among three VMs. [42] examined the relationship between the co-location interference of two VMs and their resource utilization. A recent study [6] quantified the co-location interference of two VMs by the correlation of their
resource utilization, for the consolidation of scientific workloads. While such existing works analyzed VM co-location interference at a relatively small scale, i.e., 2-3
VMs, our work further measures the co-location interfer-ence among multiple co-located VMs and utilizes critical factors such as the network interrupts inside VMs, VCPU queueing time, and cache miss ratios in both PMs and VMs (Sec. 2.2), in order to achieve the simple yet effective estimation of VM co-location interference.
There were also works on guaranteeing performance isolation across co-located VMs on shared resources. For example, [33] alleviated cache and memory bandwidth interference by compensating the impacted VMs for re-served CPU resource. [43] summarized the VM isolation techniques on the network resource, such as installing multiple network adapters, implementing static band-width allocation for VMs in thedomain-0 [28], or in net-work adapters and switches. Different from these net-works,
iAwarealleviates the shared memory and network band-width interference with optimized placement of VMs, rather than relying on resource compensating and band-width capping techniques, which either require reserved CPU (or network adapter) resources or adapt poorly to a dynamic number of VMs in datacenters [43]. Another approach [11] restricted CPU utilization of some victim VMs in domain-0to guarantee the network performance of other co-located VMs. Commercial virtualization so-lution of Microsoft allocated the network bandwidth among a dynamic number of VMs, by incorporating a rate controller intoHyper-V[16]. Orthogonal to these VM performance isolation solutions, we focus on mitigating the performance impact during and after VM migration.
6.3 VM Migration and Consolidation Strategies
There exist a number of VM migration and consolidation strategies for load balancing [4] and power saving [5]– [7]. Yet, few of them devoted adequate attention to the overall VM performance interference across migration source and destination PMs, during and after the mi-gration of VMs. They either considered VM mimi-gration interference [8], [41] or co-location interference [5], [6], [12] in an isolated manner (as discussed in Sec. 6.1 and Sec. 6.2). In contrast, the iAware strategy seeks to mitigate overall VM performance interference by jointly measuring, analyzing and minimizing the migration and co-location interference during and after VM migration. A latest work on VMware DRS [36] also considered the VM migration cost on the migration source and destina-tion PMs, and the resource contendestina-tion cost. However, it did not explicitly present a model on such performance cost. Our work further differs from DRS in that: (1) DRS only considers the migration cost on CPU and memory resources. (2) DRS makes a certain migration decision as long as its performance benefit exceeds its cost, while
iAware identifies the migration decision with the mini-mum estimated overall performance interference.
7
C
ONCLUSIONIn this paper, we have presented our design and im-plementation of iAware, a lightweight interference-aware
VM live migration strategy to avoid violations of perfor-mance SLAs in the cloud.iAware jointly measures, ana-lyzes and mitigates both VM migration and co-location interference in a holistic manner on the source and desti-nation servers during and after VM migration. Based on a Xen virtualized cluster platform, we show extensive experiments of representative benchmark workloads, conducted to practically reveal the essential relationships between VM performance interference and key factors from servers and VMs. Such an empirical understanding further guides us to develop a simple multi-resource demand-supply model to estimate and minimize both VM migration and co-location interference. Extensive experiments and complementary large-scale simulations have demonstrated thatiAwarecan qualitatively estimate VM performance interference, and improve I/O and network throughput and execution durations, by65% for network-intensive workloads and by16%-28% for work-loads that are CPU, memory and network-intensive, as compared to the FFD and Sandpiper algorithms. In addition, the runtime overhead of iAware in terms of CPU consumption and network I/O is very well con-tained, even as it scales to thousands of VMs. Finally, we advocate that iAware cooperates well with existing VM migration or consolidation policies in a complementary manner, so that load balancing or power efficiency can be achieved without sacrificing performance.
A
CKNOWLEDGMENTSThe corresponding author is Fangming Liu. The research was supported in part by a grant from NSFC under grant No.61370232, by a grant from National Basic Research Program (973 program) under Grant of 2014CB347800. Prof. Bo Li’s work was supported in part by a grant from RGC under the contract 615613, a grant from NSFC/RGC under the contract N HKUST610/11, and a grant from ChinaCache Int. Corp. under the contract CCNT12EG01.
R
EFERENCES[1] J. Guo, F. Liu, H. Tang, Y. Lian, H. Jin, and J. C. Lui, “Falloc: Fair Network Bandwidth Allocation in IaaS Datacenters Via a Bargaining Game Approach,” inProc. of IEEE ICNP, 2013.
[2] Amazon Elastic Compute Cloud (Amazon EC2). [Online].
Available: http://aws.amazon.com/ec2/
[3] C. Clark, K. Fraser, S. Hand, J. G. Hansen, E. Jul, C. Limpach, I. Pratt, and A. Warfield, “Live Migration of Virtual Machines,” inProc. of NSDI, May 2005.
[4] T. Wood, P. Shenoy, A. Venkataramani, and M. Yousif, “Black-box and Gray-“Black-box Strategies for Virtual Machine Migration,” in Proc. of NSDI, Apr. 2007.
[5] F. Y.-K. Oh, H. S. Kim, H. Eom, and H. Y. Yeom, “Enabling Consolidation and Scaling Down to Provide Power Management for Cloud Computing,” inProc. of HotCloud, Jun. 2011.
[6] Q. Zhu, J. Zhu, and G. Agrawal, “Power-aware Consolidation of Scientific Workflows in Virtualized Environments,” inProc. of SC, Nov. 2010.
[7] A. Verma, P. Ahuja, and A. Neogi, “pMapper: Power and Migra-tion Cost Aware ApplicaMigra-tion Placement in Virtualized Systems,” inProc. of Middleware, Dec. 2008.
![TABLE 2: VM types and parameter setting of Xen Credit Scheduler [26].](https://thumb-us.123doks.com/thumbv2/123dok_us/9369263.2420072/2.918.485.824.675.744/table-vm-types-parameter-setting-xen-credit-scheduler.webp)