International Seminar on the Application of Science & Mathematics 2011 ISASM 2011
COMPARISON OF ACCIDENT PREDICTION MODEL
BETWEEN ANN AND MLR MODELS
Ahmad Raqib Ab. Ghani, Mohd. Erwan Sanik and Roselinda Aida Mohd Mokhtar
Department of In frastructure and Geomatic Engineering, Faculty of Civil and Environmental Engineering,
Universiti Tun Hussein Onn Malaysia, 86400 Parit Raja, Batu Pahat, Johor, Malaysia.
[email protected], [email protected] and [email protected]
Accident rate that occurred in Malaysia has been increased for every year. Govern ment and all concern parties constantly worrying about this matter where serious measures should be taken to prevent this rising accident rate fro m happened. Th erefore, a forecasting of accident prediction models have to be developed. In this study, the locations were focus in rural selected area. The locations of the study were selected among the highest accident rates in Federal Route 050 based on accident point weightage analysis. Traffic volu me, speed, number of access point and gaps data were used to develop the models. Data collections have been done through manual observation at high risk area. The parameters we re then used to develop an accident predictio n model by using the Artificia l Neura l Net work (ANN) and Multiple Linear Regression (MLR) models. Both models were then utilized and MLR model was identified to give the better result in term of reducing the number of accidents compared to ANN. Therefore , M LR model was suggested to be used by the concern parties in order to predict the accident as to reduce the accidents more effectively and further to achieve the national set reduction target.
Keywords: Accident Pred iction Model; Artific ial Neura l Networ k; Mult iple Linear Regression
1.0 INTRODUCTION
To date, there are many accidents occur along Jalan Ayer Hitam – Batu Pahat, based on the statistic of road accident at federal road, FT050 in Johor. The accidents involve cars, lorry, bicycle, pedestrian and mostly motorcyclist [1]. The vehicles were believed to be increased on the road due to the land use such as Fujitsu factory, wood and timber factory, shops, school and university along both side of the road. Therefore, KM 20, KM 21, KM 22, KM 23 and KM 24 of the FT 050 were chosen for this study.
The estimation of accident prediction model was produced by using two kinds of model in which Multiple Linear Regression (MLR) and Artificial Neural Network (ANN) models were used. This forecasting purpose of accident prediction was expected to help to reduce the accident rate which occurred on the road. Therefore, it can help in improving the level of safety along the critical roads and highways. Improving level of safety can help to alleviate fatalities and injuries [5]. Both of these models were then utilized so that the comparison of the results knowable. The comparison was made based on the coefficient of determinant, R2 and the accident prediction after several changes of parameters had been made. Therefore, the productive model can be produced after the estimation of accident prediction model was known. Hence, the accident rate which may occur in the future can be reduced.
2.0 METHODOLOGY
Data Measurement
In order to develop accident prediction model, large number of data need to be collected. The study was limited to five locations due to a lot of data have to be collected at one study location. Therefore, the data was collected in six hours at each location during morning, afternoon and evening peak hours [6]. The hourly traffic volume, speed and gaps were taken by using video camera and Jamar which a hand-held equipment. Jamar is the easiest way to collect intersection data for quick analysis. The data can be easily downloaded to a computer. These devices are easily to use, accurate and reliable [7]. Besides, the total number of accident from 2004-July 2009 were also taken for the analysis.
Data Observation
The observational method that applied in this study was only being done during determining the number of access point. In order to count the number of access point in both roadside along KM 20 until KM 24, a walk-through of about 1 km stretch in each kilometer had been conducting. After all the parameters in each kilometer were taken, the data was then analyzed as mentioned in flow chart (Appendix A).
3.0 RESULT AND ANALYSIS
International Seminar on the Application of Science & Mathematics 2011 ISASM 2011
The ranking of accidents in every kilometre was determined by using the weightage formula. In the weightage formula, all types of accidents had their own coefficient in which for fatal, it was multiplied by 6.0, serious injury multiplied by 3.0, slight injury multiplied by 0.8 and for the damage only, it was multiplied by 0.2 [8].
Where,
X1 = Number of fatal
X2 = Number of serious injury
X3 = Number of slight injury
X4 = Number of damage only
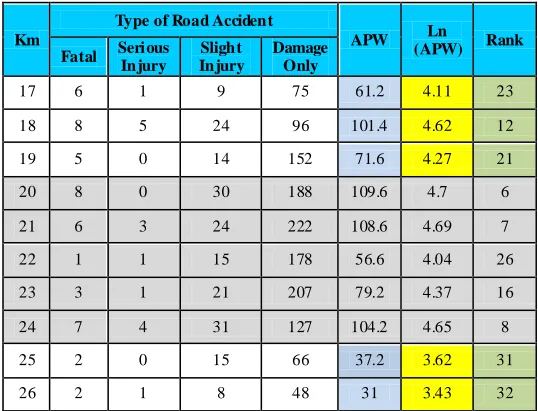
[image:3.596.109.378.435.641.2]The data of road accident occurrence in FT 050 was analyzed to find the ranking of the accident blackspot area. Blackspot is a term used to refer to a section of road that is regarded as a high-risk location for vehicles crashes [9]. The accident data in 2004 until July 2009 were analyzing using Accident Point Weightage (APW). Hence, the ranking of accident blackspot area was easily determined. Table 1 showed the ranking of accident at FT 050 based on APW.
Table 1: Blackspot area by ranking of Accident Point Weightage
Km
Type of Road Accident
APW Ln
(APW) Rank
Fatal Serious Injury Injury Slight Damage Only
17 6 1 9 75 61.2 4.11 23
18 8 5 24 96 101.4 4.62 12
19 5 0 14 152 71.6 4.27 21
20 8 0 30 188 109.6 4.7 6
21 6 3 24 222 108.6 4.69 7
22 1 1 15 178 56.6 4.04 26
23 3 1 21 207 79.2 4.37 16
24 7 4 31 127 104.2 4.65 8
25 2 0 15 66 37.2 3.62 31
26 2 1 8 48 31 3.43 32
area. Meanwhile for the KM22 and KM23, the APW had showed that their ranking was 26 and 16, respectively.
MLR and ANN analysis
The data which was taken during the study was analyzed in MLR and ANN models. Before the data was analyzed in both models, all the parameters were firstly analyzed in order to determine whether the parameters were significant or not.
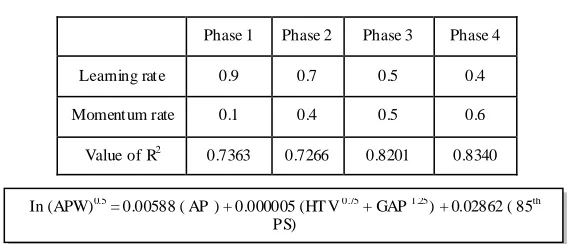
[image:4.596.166.450.424.546.2]For MLR, the significant of parameters was determined by using the regression analysis in Microsoft Excel. In the analysis, T-test which obtained from the equation in ANNOVA table was then compared to the coefficients of t-statistic (Appendix B). The parameters were considered significant if T-test > t-statistic for all parameters [10]. From the regression statistic, the coefficient of determinant, R2 was determined. There was found that the value R2 was equal to 0.9992, which means that 99.92% of the variation in the number of accident has been explained the regression line [11]. After that, the coefficient for all parameters in t-statistic table was then included to become an equation as a followed:
Table 2: Different phase in neural network
Besides, from this MLR, the lowest of standard residual can also be determined (Appendix C). Standard residual was the estimation of the error at a single data point. When the standard residual approached to zero, it mean that the value had the minimum error. From Appendix C, the Section 12 had the lowest of standard residual. Therefore, all the data in which speed, gaps, HTV and AP in Section 12 was then used in the prediction of accident.
For ANN, the significant of parameters was determined by using the Statistical Package for the Social Sciences, SPSS software. SPSS is software that used to find the value of determinant, R. The R value was then used in the equation to check whether the parameters were independent or not (Appendix D) [12]. In ANN analysis, there
Phase 1 Phase 2 Phase 3 Phase 4
Learning rate 0.9 0.7 0.5 0.4
Momentum rate 0.1 0.4 0.5 0.6
Value of R2 0.7363 0.7266 0.8201 0.8340
International Seminar on the Application of Science & Mathematics 2011 ISASM 2011
were four phase that being used in this network. The best phase which gave the highest R2 as in Table 2 was taken into consideration to predict the accident in the future.
Prediction of Accident
All the parameters which contribute to accident occurrence had been used to produce MLR and ANN models. After both of the models were developed, the checking for the reducing of accident percentage was made due to the changes of each one of these four parameters.
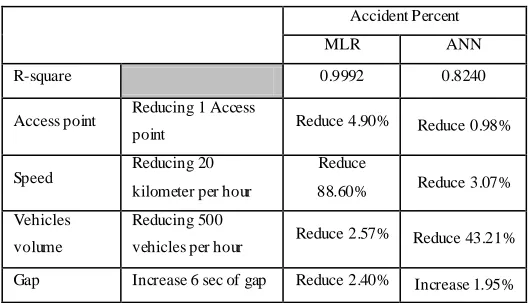
The changes done by reducing of 1 numbers of access points per kilometer, reducing speed by 20 kilometer per hour, followed by reducing the value of vehicles volume by 500 vehicles and increasing of gap by 6 seconds. Table 3 showed the result for both models.
[image:5.596.177.442.484.636.2]The comparisons of both these models were then analyzed to choose which one of these models were the best. Based on Table 3, the reducing of access point by 1 can reduce the accident by 4.90% for MLR and 0.98% for ANN, while the reducing speed by 20 kilometer per hour can reduce the accident by 88.60% for MLR and 3.07% for ANN. However, for the ANN, the reducing accident was higher which is 43.21% compared to MLR which is 2.57% when reducing the volume of vehicles by 500 vehicles. Meanwhile for the increasing of gap by 6 seconds, the MLR can reduce the accident with only 2.40%, otherwise with the ANN, accident will increase up to 1.95%.
Table 3: Comparison of accident percentage of MLR and ANN
Accident Percent
MLR ANN
R-square 0.9992 0.8240
Access point Reducing 1 Access
point Reduce 4.90% Reduce 0.98%
Speed Reducing 20 kilometer per hour
Reduce
88.60% Reduce 3.07% Vehicles
volume
Reducing 500
vehicles per hour Reduce 2.57% Reduce 43.21%
The study was conducted with the objectives and the best results can be determined. From here, it can be concluded entire ly that:
(1) The accident prediction model had been successively developed for both models. The MLR model was developed by using the equation as mentioned in the above. Meanwhile, for the model of ANN, it was successfully developed by using the best phase that was determined before.
(2) The comparison between of these models was successfully determined as in Table 3. From Table 3, it was found that the MLR gave the best of R2 which it is 99.92% validation for the model. Meanwhile, the ANN gave 82.40% which is lower than MLR. So, this was proved that MLR model was the better model than ANN. Besides that, MLR gave the reducing percentage for all from the changes of the parameters to predict road accident compared to ANN. Hence, the MLR model can be suggested to be used in order to reduce accidents more effectively in the future.
5.0 REFERENCES
[1] Polis Dira ja Malaysia (2009). Statistical Report, Road Accidents Malaysia 2009. Polis Diraja Malaysia.
[2] Transportation Research Laboratory, TRL 421 Report (March 2000). The Effects of Divers’ Speed on the Frequency of Road Accidents.
[3] Gwynn, D.W. (1967). Relationship between Road Accident and Hourly Volumes, Traffic Quartely. 14(1), pp. 407-418.
[4] Be rhanu, G. (2004). Model Relating Traffic Safety with Road Environment and traffic Flow on Arterial Road in Addis Ababa University. 36(5) pp. 697-704.
[5] Wright, P.H. (1996). Highway Engineering. 6th Ed. Canada: John Wiley & sons, Inc.
[6] Road Traffic Volume Malaysia (2005). Highway Planning Unit : Min istry of Works Malaysia.
[7] Ja mar Technologies (2010), Data Measurement. Retrieved January 4, 2010, fro m http://www.ja martech.co m/profile .html
International Seminar on the Application of Science & Mathematics 2011 ISASM 2011
[9] Kowtanapanich, W. (2010). Black Spot Identification Method in Thailand. Retrieved
January 15, 2010, fro m p. 3 at
http://www.crma.ac.th/academic/educate/sapa4/journal/jour-50/jour-50-10.pdf
[10] Mustakim, F. (2006). Treating Hazardous Locations at Federal Route 50. Universiti Teknologi Ma laysia: Master’s Thesis.
[11] Freund, R.J. and Wilson, W.J. (1998). Regression Analysis: Statistical Modeling of a Response Variable. 1st Ed. United States of A merica: Academic Press.