Journal of Chemical and Pharmaceutical Research, 2016, 8(6):477-484
Research Article
CODEN(USA) : JCPRC5
ISSN : 0975-7384
Analytical validation of method for control of pH and electrical conductivity
M. El Ouchy
1,3, K. El Ouedghiri
1,4, M. Machkour
5, A. El Oualti
1, F. Ouazzani Chahdi
4,
F. Zerrouq
3and A. El Ouali Lalami
1,2*1Regional Diagnostic Laboratory Epidemiological and Environmental Health, Regional Health Directorate,
El-Ghassani Hospital, 30000 Fez, Morocco
2
Institute of Nursing Professions and Health Techniques Fez (Annex Meknès), Regional Health Directorate, EL Ghassani Hospital, 30000 Fez, Morocco
3Laboratory of Catalysis, Materials and Environment, University of Technology, Fès 30000, Morocco 4Organic Chemistry laboratory Applied, Faculty of Science & Techniques Saiss, Sidi Mohamed Ben Abdellah
University, Fès 30000, Morocco
5Moulay Ismail University, Faculty of Sciences, Department of Chemistry, Materials Membranes and Processes of
Separation Team, PO Box 11201, Zitoune, Meknes, Morocco
_____________________________________________________________________________________________
ABSTRACT
For the control and the monitoring of water quality, it is always necessary to use valid, reliable and reproducible methods. Measurements of the pH and electrical conductivity are among the obligatory analyzes of control for all types of water. These measurements are regulated and standardized, but they must be confirmed, thanks to experimental work, to validate the aptitude of use as well as the performances of these methods of analysis with an aim of using them in routine in a laboratory. This work presents the criteria of validation of the methods of control of the pH and electrical conductivity for the drinking water. Thus, we studied specificity, the calibration (linearity), the accuracy, fidelity (repeatability, intermediate fidelity, and reproducibility), the limit of quantification, the limit of detection and the uncertainty of measurement. These criteria were studied according to the requirements of the standards NM 03.7.001, NF T 90-2010, ISO 5725, ISO 17025 and the Rodier document. The validation of the methods of measurement of the pH and electrical conductivity was carried out within the unit of chemistry on the level of the Regional Diagnostic Laboratory Epidemiological and Environmental Health within of Regional Health Directorate of Fez city - Morocco. This laboratory have been adopted the standard ISO 17025, v 2005 in its services of analyzes since the year 2008.
Keywords: Drinking water, Hydrogen Potential, Electrical Conductivity, Validation of method, Standardization,
ISO 17025, Analysis laboratory.
_____________________________________________________________________________________________
INTRODUCTION
Water is essential to all human activities and plays a key role in the life. Considering its load in toxic elements and pollutants (chemical compounds, heavy metals,…), it could have a harmful effect for the man and the environment. Indeed, it could be at the origin of several serious medical complications (diseases and infections with hydrous transmission) [1].
laboratories of calibration, tests and analysis. The most essential and required elements for the validation of a method of analysis are:
The study of the function of calibration; Limit of quantification and detection;
Accuracy, fidelity (repeatability, intermediate fidelity, reproducibility), and the uncertainty of measurement[3].
These criteria of validation and their methodologies were largely defined in the scientific literature [4-7]. The validation currently became obligatory in the majority of the laboratories in order to have credible results and of quality, fulfilling the requirements of the standards [1, 8, 9].
This work was elaborate with an aim of confirming the validation of the experimental protocol of the method of determination of the pH (method potentiometric) and that of electrical conductivity (conductimetric method) in human feed waters while being based on the statistical study of the various criteria of validation (repeatability, reproducibility, accuracy, precision…).
EXPERIMENTAL SECTION
Studied criteria
The studied criteria are: The linearity, the Repeatability, reproducibility interns, the limit of quantification and detection, the accuracy, the precision and the rate of recovery [10, 6].
The linearity is the capacity, inside the interval of proportioning, to provide results directly proportional to the concentration in substance present in the sample.
The repeatability (R) it is fidelity under conditions of repeatability (even operator, even laboratory, even method, even material…). It is calculated by the formula: R = 2,8 Sr
The reproducibility (R) is fidelity under conditions of reproducibility, at least the change of one of the conditions. Calculated by the formula: R = 2,8 SR
The accuracy is the narrowness of the agreement between the median value obtained and a certified value of reference. It is défine by Justesse%= 100 - Error relative%.
[image:2.595.155.462.514.597.2]The uncertainty of measurement is a parameter, associated with the result of a measuring, which characterizes the dispersion of the values which could reasonably be allotted to measurement. Calculated by the formula:
[11].
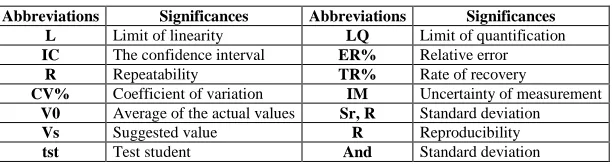
The legend of the abbreviations used in this work is given in table 1.
Table 1: Caption abbreviations used
Abbreviations Significances Abbreviations Significances
L Limit of linearity LQ Limit of quantification
IC The confidence interval ER% Relative error
R Repeatability TR% Rate of recovery
CV% Coefficient of variation IM Uncertainty of measurement
V0 Average of the actual values Sr, R Standard deviation
Vs Suggested value R Reproducibility
tst Test student And Standard deviation
Terminology and Principles potential Hydrogen (pH)
pH is means potential hydrogen, and which represents the measurement of alkalinity in chemistry. The pH measures the concentration of an aqueous solution in protons (H+) and the degree of acidity or alkalinity of a solution [12].
The basic principle of this measurement is the determination of the activity of the hydrogen ions by potentiometric measurement by using a hydrogen electrode and an electrode of reference. In practice, one more generally uses an electrode of glass associated with an electrode of reference to calomel or a combined electrode. The potential difference existing between the electrode of glass and the electrode of reference plunging in same water, and a linear function of the pH of this one [12]. The calibration of the apparatus has been made using solutions pH standards.
Electrical conductivity
The measurement of electrical conductivity is based on the principle of Wheatstone bridge who measures resistance R (Ω) of a column of water of section S (Cm²) and length L (cm) between two electrodes out of turntable laid out in parallel [12]. It depends on the total concentration in ions, their mobility, their valence, their relative concentration and the temperature [12]. The temperature of reference is of 20°C.
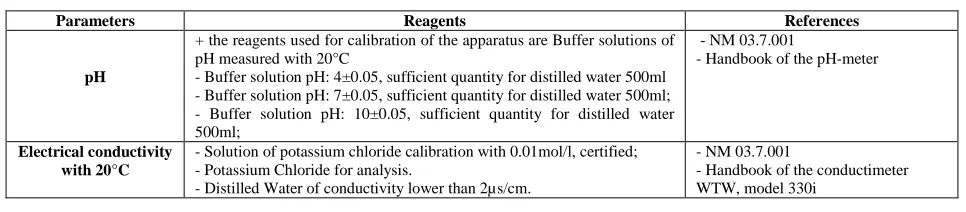
Adopted standards and Reagents used
[image:3.595.65.548.191.297.2]The measurement of the pH and the electrical conductivity of the various studied water samples were carried out according to the standards quoted in table 2.
Table 2: Adopted standards and Reagents used
Parameters Reagents References
pH
+ the reagents used for calibration of the apparatus are Buffer solutions of pH measured with 20°C
- Buffer solution pH: 4±0.05, sufficient quantity for distilled water 500ml - Buffer solution pH: 7±0.05, sufficient quantity for distilled water 500ml; - Buffer solution pH: 10±0.05, sufficient quantity for distilled water 500ml;
- NM 03.7.001
- Handbook of the pH-meter
Electrical conductivity with 20°C
- Solution of potassium chloride calibration with 0.01mol/l, certified; - Potassium Chloride for analysis.
- Distilled Water of conductivity lower than 2µs/cm.
- NM 03.7.001
- Handbook of the conductimeter WTW, model 330i
Materials used
Determination of the pH
- pH-meter of mark ADWA, model AD1000;
- Combined Electrode: the electrode of glass and the electrode of reference;
- Thermometer;
- Material running of the Laboratory; - Refrigerator.
Determination of electrical conductivity
- Conductimeter of mark WTW, model 330i;
- Probe of mark WTW, model TetraCon® 325;
- Thermometer of precision to the 1/10°C;
- Bath Marina carried with 20°C;
- Refrigerator;
- Material running of the Laboratory.
Preparation of the reagents
The potassium chloride is desiccated beforehand in a drying oven during two (2) hours under a temperature of 105°C.
- Potassium Chloride with 0,1mol/l:
* Potassium chloride ... 7,4558g±0,0005g * Demineralized water q.s.p ... 1000m - Potassium Chloride with 0,01mol/l:
* Potassium chloride ... 0,7456g±0,0005g * Demineralized water q.s.p ... 1000ml - Potassium Chloride with 0,001mol/l:
* Potassium chloride with 0,01mol/l ... 1ml * Distilled water q.s.p ... 100ml.
Procedure
Generally, to operate with glassmaking class A rigorously clean and rinsed, before use, with demineralized water. To put water in a bottle out of polyethylene well filled and stopped well then to take measurement as quickly as possible.
Determination of the pH
Once the apparatus has been calibrated, to proceed as follows:
- To check the pH of the solution buffer of pH=7, this value must be ranging between 6.98 and 7.02 of unit of pH; - To introduce the electrode into the sample to be examined;
- To rinse the probe with the water distilled after each measurement; - In the same way, to measure the pH of the various samples,
- To check the pH again solution Buffer of pH=7;
- To note this measure to the card of the follow-ups of controls of pH.
Determination of electrical conductivity
Calibrate the apparatus according to the procedure of calibration and calibration of the conductimeter :
- To rinse the measuring cell several times with demineralized water, then twice at least with the water sample to be examined;
- To lead the sample to analyze with 20°Cusing a bain-marie when the temperature of the sample is lower than20°Cand using a refrigerator when its temperature is higher than 20°C;
- To emerge completely the cell of the conductimeter in the container containing the sample and to take care that there are no bubbles of air on the electrodes and that the posted temperature is of 20°C±0,1;
- To note and record the value measured at the temperature 20°C±0,1;
- To check at the end of each series of measurement if the electrical conductivity of the solution of potassium chloride with 0,01mol/l is acceptable;
- To fill out the control sheet for this solution by the measured value.
- To rinse the measuring cell several times with suitable flushing water of lower electrical conductivity or equalize 1µs/cm and to preserve it at the free surface.
Statistical tools
We used the software Microsoft Office Excel 2007 for the data processing and statistical calculation.
RESULTS AND DISCUSSION
The confirmation of the validation of the method of control of the pH and electrical conductivity in water is given in the continuation of this work by studying for each parameter the criteria given previously: the linearity, repeatability, internal reproducibility, accuracy.
*pH
The criteria of validation of the method of control of pH which we studied are as follows:
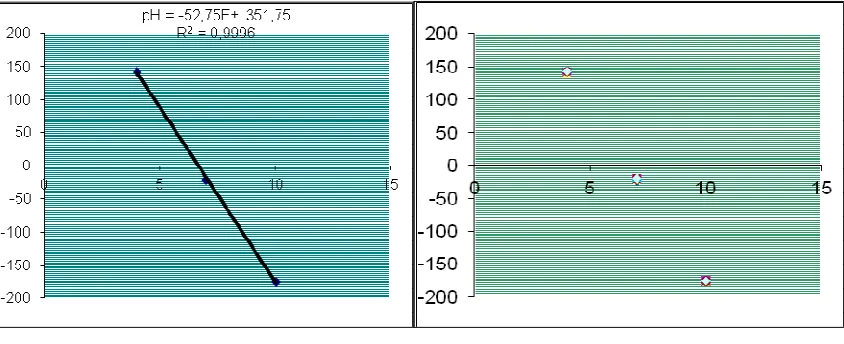
The linearity
[image:4.595.96.518.474.646.2]Various measurements of the points of ranges give a linear straight lines figure 1.
Figure 1: Curves of the linearity
The coefficient of correlation (0,9996) obtained is higher than that awaited (≤0,995). The measured optical density is well correlated with the concentration.
Table 3: Functions of the linearity
Linearity
Equation of the right-hand side pH= -52,75E+351,75
R ² 0,9996
Slope -52,75
Repeatability
[image:5.595.177.436.194.284.2]The limit of Repeatability is given in table 4.
Table 4: Measure Repeatability
Repeatability
Concentration 7 4 10
Average 7,0061 4,0013 9,9356
Standard deviation Sr 0,0229 0,0179 0,0369
CV% 0,3263 0,4463 0,3612
Root (N) 3,1623 3,1623 3,1623
T (student) 2,001 2,001 2,001
I.C [6,997; 7,021] [3,990; 4,013] [9,913; 9,9958]
R 0,145 0,0113 0,0227
Internal Reproducibility
[image:5.595.182.431.362.466.2]The coefficients of variation which correspond to the samples of 4; 7 and 10 are lower than 5%. Intermediate fidelity (reproducibility interns) for three measurements, respectively (0,0098; 0,0093 and 0,0151) are higher than those of the repeatability (0,145; 0,0113 and 0,0227) (table 5).
Table 5: Measure internal reproducibility
Reproducibility
Concentration 7 4 10
Average 7,0019 4,0035 9,9561
Standard deviation Sr 0,0218 0,0207 0,0336
CV% 0,3116 0,517 0,3379
N 20 20 20
Root (N) 4,47 4,47 4,47
T (student) 2,001 2,001 2,001
IC [6,984; 7,011] [3,996; 4,021] [9,9410; 9,9712]
R 0,0098 0,0093 0,0151
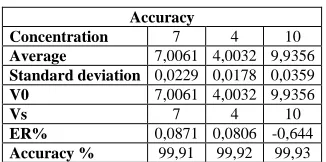
Accuracy
The accuracy was studied for three nitrite concentrations in the absence of MR and MRC. The standards used for this study are 7; 4 and 10.
The accuracies obtained are about 99,91%; 99,92% and 99,93. They are higher than those awaited (90%≤) (table 6).
Table 6: Accuracy of measurements
Accuracy
Concentration 7 4 10
Average 7,0061 4,0032 9,9356
Standard deviation 0,0229 0,0178 0,0359
V0 7,0061 4,0032 9,9356
Vs 7 4 10
ER% 0,0871 0,0806 -0,644
Accuracy % 99,91 99,92 99,93
Precision
The precision obtained is about 0,055 (table 7).
Table 7: Parameters of precision
Precision
Average 7,055
Theoretical pH 7
[image:5.595.225.388.560.641.2] [image:5.595.218.393.701.746.2]Estimate of the uncertainty of measurement
[image:6.595.246.364.122.203.2]The uncertainty of estimated measurement is equal to 0,028 (table 8).
Table 8: Estimate of the uncertainty of measurement
Average 7
Standard deviation Sr 7,027
CV% 0,059
NR 20
Root (N) 4,472
T (student) 2,090
R 0,028
*Electric conductivitywith 20°C
Repeatability
[image:6.595.153.460.288.379.2]The limit of Repeatability is of: 1,4628 (for an electric conductivity of 137 µs/cm), 2,3144 (for an electrical conductivity of 1277 µs/cm) and 11,9503 (for an electrical conductivity of 11680 µs/cm), therefore the method is répétable (table 9).
Table 9: Repeatability
Repeatability (R)
Average 136,700 1278,60 11683,00
Standard deviation Sr 2,3118 3,6576 18,8856
CV% 1,69 0,29 0,16
N 10 10 10
Root (N) 3,16 3,16 3,16
T (student) 2,001 2,001 2,001
IC [135,24; 138,16] [1276,28; 1280,91] [11671,05; 11694,95]
R 1,4628 2,3144 11,9503
Internal reproducibility
The coefficients of variation which correspond to the samples of electrical conductivity (137 µs/cm and 1277 µs/cm and 11680 µs/cm) were found about 2,19%; 0,36% and 0,17%. They are lower than 5%. The limits of reproducibility interns are respectively: 1,3380; 2,0602 and 8,85. As a result, the method is reproducible (table 10).
Table 10: Internal reproducibility
Internalreproducibility
Average 136,415 1278,60 11675,5
Standard deviation Sr 2,9904 4,6043 19,3241
CV% 2,19 0,36 0,17
N 20 20 20
Root (N) 4,47 4,47 4,47
T (student) 2,001 2,001 2,001
IC [135,07; 137,75] [1276,54; 1280,66] [11666.85; 11684,15]
R 1,3380 2,0602 8,65
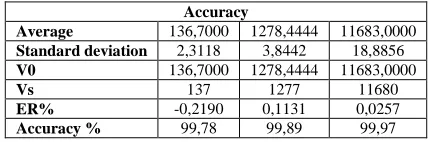
Accuracy
The accuracy was studied for following electrical conductivities: 137 µs/cm; 1277 µs/cm and 11683 µs/cm (table 11).
The accuracies obtained are about 99,78%; 99,89% and 99,97%. They are higher than those awaited (90%≤).
Table 11: Criteria of the accuracy
Accuracy
Average 136,7000 1278,4444 11683,0000
Standard deviation 2,3118 3,8442 18,8856
V0 136,7000 1278,4444 11683,0000
Vs 137 1277 11680
ER% -0,2190 0,1131 0,0257
Accuracy % 99,78 99,89 99,97
Limit of detection and quantification
[image:6.595.150.461.464.555.2] [image:6.595.198.413.651.722.2]Table 12: Limit of quantification
Limit of detection and quantification
Average 7,64
Standard deviation 0,62
LD 1,86
LQ 6,19
Ratio of conformity 4,12
The limit of estimated quantification, is equal to 6,19 and the limit of detection is of 1,86.
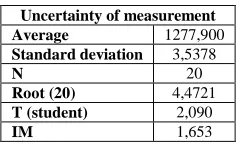
Estimate of the uncertainty of measurement.
The uncertainty of estimated measurement, is equal to 1,653 (table 13).
Table 13: Estimate of the uncertainty of measurement
Uncertainty of measurement
Average 1277,900
Standard deviation 3,5378
N 20
Root (20) 4,4721
T (student) 2,090
IM 1,653
The confirmation of the validation of our method of proportioning of the various studied parameters is based on a study with intra laboratory through quantified and checked characteristics. These characteristics showed the performance of the method and thus constitute the structure of a file of validation of the method within the framework of a step quality [13-15].
After the validation of the methods, we took part in the tests inter laboratory, relating to the parameters (pH and electrical conductivity), directed by the central laboratory of the National Office of Drinking water (ONEP) of Reduction in 2012 and 2013. Our laboratory recorded a very satisfactory pointing for the two parameters: 95% for the parameter of the pH and 100% for that of electrical conductivity (Report/ratio of the results of the tests inter laboratory published and published by the ONEP, years 2012 and 2013).
The results so obtained show that these methods are powerful, valid and suited to be used.
CONCLUSION
The objective of this work was the confirmation of the validation of the experimental protocols of the methods of measurement of the pH and electrical conductivity. The acceptance of this validation was examined and checked on the basis statistical methods namely:
1. The study of the function of calibration, the linearity of calibration curve of the two parameters: pH and electrical conductivity.
2. Limit of quantification and detection.
3. The accuracy, the fidelity (repeatability, intermediate fidelity, reproducibility) and the uncertainty of measurement which ensure the reliability of the results.
The obtained results show that the methods of measurement of the pH and electrical conductivity are right, precise and faithful with an uncertainty of measurement respectively about 0,028 for the pH and 1,65 for electrical conductivity.
Thanks: We warmly thank all those which contributed to the realization of this work.
REFERENCES
[1] RachidiA., Technologies of Laboratory, 5 (20) (2010).
[2] Normalizes ISO 17025, chapters 4 and 5, the technical requirements of validation (2005).
[3] NF T 90-210 protocol water qualities of initial evaluation of the performances of a method in a laboratory (ICS: 03.120.30; 13.060.50; 13.060.60 /ISSN 0335-3931/May 2009).
[4] Hubert P., 13 (3) (2003) 101-131.
[image:7.595.247.368.234.307.2][7] Jhilal F., Ihssane B., Bouchafra H., Sfaira Mr., El Hadrami EL., SeffajT., Technologies of Laboratory, 8 (30) (2013) 1-7.
[8] Amine A., Mandli J., Haddam M., Study Technologies of Laboratory 7 (28) (2012) 1-14.
[9] El Ouchy M., El Oualti A., El Ouedghiri K., Ouazzani Chahdi F., Zerrouq F., El Ouali Lalami A., J Mater.
Environ sci. 5 (S1) (2014) 2293-2302.
[10] Dammed K., Boukklouze A., Technology of Laboratory, 1 (2006) 15-19.
[11] Center of expertise in analysis environmental of Quebec (CEEQ), Protocole of the validation of a method of analysis in chemistry, DR-12-VMC, Edition June 9th (2009).
[12] Rodier J., Legube B., Merlet NR., Analyze water, Dunod bets, (2009).
[13] NF ISO 5725-1: Application of the statistics - Exactitude (accuracy and fidelity) of the results and method of measurement - Part 1: general principles and definitions (1994).
[14] NF ISO 5725-2: Application of the statistics - Exactitude (accuracy and fidelity) of the results and method of measurement - Part 2: basic methods for the determination of the repeatability and the reproducibility of a method of standardized measurement (1994).