867
MODELING AND SIMULATION OF BALISE UP-LINK DATA
TRANSMISSION BASED ON FINITE ELEMENT METHOD
LINHAI ZHAO*, YING JIANG
School of Electronics and Information Engineering, Beijing Jiaotong University, Beijing 100044, China
ABSTRACT
The balise is an important component in train operation control system fulfilling the task of Ground-Train Point-Mode data transmission. This paper presents a finite element based method for researching the electromagnetic interaction process of balise up-link data transmission with respect to the basic theoretical level. Based on the basic structure and working principle of balise information transmission system, the model of balise up-link data transmission is built by employing the finite element method. Through simulation, the overall electromagnetic field distribution of this interaction process is obtained. By means of contrast verification using simulation results and practical data, the validity and credibility of this FEM based model is proved in two perspectives, which will provide theoretical foundations for further researches in terms of balise information transmission.
Keywords: Balise Transmission Module Antenna, Finite Element Method, Balise Up-link Data
Transmission, Electromagnetic Interaction Process
1. INTRODUCTION
The traffic safety in railway lines is guaranteed by applying the corresponding train operation control system. As key component of this system, the balise information transmitting subsystem, comprised of on-board Balise Transmission Module (BTM) and ground balise, mainly accomplishes the Ground-Train Point-Mode data transmission of balise up-link signal which contains crucial information (e.g., temporary speed limitation, geographical position and ground circumstances) for speed control of the train. With the railways developing more rapidly, the train operation speed is increasing much faster, which demands even higher requirements for the transmission quality of balise information. Therefore, it is necessary to perform the modeling and simulation of Balise Up-link Data Transmission (BUDT) from basic theoretical level point of view.
Currently, researches regarding the balise mainly concentrate on placement optimization, reliability and fault analysis, crosstalk reduction, testing methods, etc. M. Sandidzadh [1] found out the optimum places of balices in the line to reduce tachometer errors by combining Genetic Algorithm and Kalman filter concepts. In consideration of the influences of electromagnetic factors and radio frequency (RF) design factors, the reliability targets of balise transmission system are analyzed [2], and by means of FTA (Fault Tree Analysis) and FMEA (Failure Mode and Effect Analysis), J. del Portillo [3] designed a suitable topology to accomplish
safety requirements for the on-board front-end transceiver of BTM. R. Sharma [4] analyzed the range of crosstalk problems encountered with the major trackside equipment, i.e., the balise and the loops. H. Zhao demonstrated that the dynamic characteristics of BTM could be modeled at four resolution layers, ranging from low to very high resolution [5], and based on that, the adaptability evaluation method for high speed circumstances was proposed [6]. By employing methods of RF, spectrum analysis and virtual instrument technique, the on-line testing of balices could be achieved [7].
868
2. BASIC STRUCTURE AND WORKING PRINCIPLE OF BALISE INFORMATION TRANSMISSION SYSTEM
[image:2.612.314.524.165.271.2]As illustrated in Figure 1 is the basic structure of balise information transmission system, which mainly includes the on-board BTM device and ground balise. Among them, the BTM device is comprised of the down-link excitation signal generator and the associated sending antenna, up-link signal receiving antenna and telegram processing module; while the balise consists of down-link signal receiving antenna, telegram storage, telegram sending module and the associated sending antenna, etc.
Figure 1: Basic Structure Of Balise Information Transmission System
Most of the time, the ground balise is in dormant mode, and the down-link excitation signal generator of on-board BTM device will always radiate RF signals downwards via BTM sending antenna, which forms a high frequency electromagnetic field covering the entire Ground-Train space. When a train approaches the balise within a certain distance, through electromagnetic induction, the induced voltage in balise receiving antenna will gradually increase and finally exceed the predefined threshold, thereby activating the balise, and afterwards, the telegram sending module starts to work, reading telegram information stored in the memory, modulating them into up-link signal with specific formats and sending them out in certain transmission rate. At the same time, the receiving antenna of on-board BTM device would induce the telegram signal transmitted by ground balise. After
signal conditioning, filtering, demodulation,
decoding and other procedures, the information contained in the signal is then extracted and sent to Vital Computer for train operation control. With the train passing and leaving the balise out of a certain distance, the down-link induced voltage within ground balise is below the threshold, which makes balise go into dormancy again.
3. MODELING OF BUDT BASED ON FEM 3.1 Mathematical Model of Balise Up-link Signal
[image:2.612.91.301.268.413.2]With references to balise technical specification [8], the mathematical model of balise up-link signal is characterized in Figure 2.
Figure 2: Basic Up-Link Signal
The mathematical expression is described as:
0
( ) cos(2 2 ( ) )
s s c
U t =A πf t+ ∆π f s t dt
∫
+ϕ (1)Where A denotes the signal amplitude, s f c
refers to the carrier frequency, ∆f is frequency
deviation, s t represents the code sequence of ( )
telegram signal and takes alternative values between logic “1” and logic “0”, which corresponds
to upper side frequency fh = fc+ ∆f and lower
side frequency fl = fc− ∆f respectively, and ϕ0
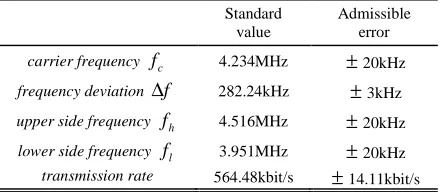
stands for the initial phase of the signal. The main frequency parameters and the associated error ranges are listed in Table 1.
Table 1
Frequency values and admissible errors of up-link signal
Standard value
Admissible error
carrier frequency fc 4.234MHz ±20kHz
frequency deviation ∆f 282.24kHz ±3kHz
upper side frequency fh 4.516MHz ±20kHz
lower side frequency fl 3.951MHz ±20kHz
transmission rate 564.48kbit/s ±14.11kbit/s
3.2 Establishment of Balise Dynamic Transmission Model Based on FEM
[image:2.612.314.534.476.572.2]869 mechanical motion process and the transient electromagnetic interaction process.
When dealing with mechanical motion process, the local subdivision method is adopted to compute the effects brought by three-dimensional transient motion. Here, the discretization for displacement x is introduced for computation and the discrete format is given by the following equation:
{ } { }
t t t t t
dx x x
dt t +∆ +∆ − = ∆
(1)
As for electromagnetic interaction process, since the frequency of balise up-link signal is relatively low, the Maxwell Equations for solving this electromagnetic process can be written as
0 H E B E t B σ ∇× = ∂ ∇× = ∂ ∇ ⋅ = (2)
Where H denotes the magnetic-field strength,
B the magnetic density and E the electrical field
strength.
In this FEM based model of BUDT, the voltage source fed to balise coil is the excitation. Since the balise coil belongs to entity winding, its resistance is related to many factors such as frequency and material, so Skin Effect needs to be taken into account, and also for this reason it should be treated
as AC resistance R . When applying voltage
sourceV , the AC resistance of the winding is still unknown and could be computed using the following equation:
( )
R
V=
∫∫∫
J E+ ×v B dR (3)Where J denotes the current density vector of the excitation coil, v is the translation speed of the motion region in this model, and refers to train operation speed in this paper.
In general, the analysis and computation of the electromagnetic field are achieved by means of
solving differential equations. For ordinary
differential equations, the solution is uniquely determined as soon as the supplementary conditions which mainly refer to the ambient physical circumstances of the solution domain, i.e., the boundary conditions are specified.
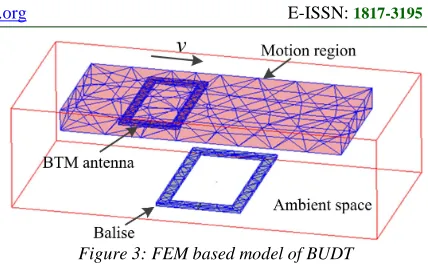
[image:3.612.310.524.75.207.2]With employment of equations (1), (2), (3) and other principles mentioned above, the FEM based model of BUDT is built and displayed in Figure 3. The model size, frame structure, and excitation values are all in accordance with those of practical conditions.
Figure 3: FEM based model of BUDT
The model mainly consists of balise and BTM coil, referring to sending and receiving antenna of up-link data transmission, respectively. The semi-transparent rectangular box surrounding BTM antenna is the motion region of the model, representing the running range of train, and the transparent air box represents the outermost layer of the model. When implementing the simulation using FEM based software, with regard to the meshing density, the corresponding settings should be performed according to different requirements for solution precisions. Since the most prevalent way for three-dimensional meshing now is to adopt tetrahedral elements, which is simple and stable, and hence, the meshing for balise and BTM antennas is set pretty dense due to its high requirements of calculation accuracy, while the meshing for motion region is relatively sparse.
4. SIMULATION OF BUDT
According to the requirements prescribed in balise testing specification [9], the size parameters and up-link signal (also termed as input signal) are applied to the FEM model built in Figure 3, herein and after, all the parameters and excitation signals are referred to as simulation conditions.
4.1 Input Signal of BUDT Model
870
Figure 4(a) Code sequence of input signal
Figure 4(b) Waveform of input signal
[image:4.612.88.538.57.618.2]Figure 4(c) Spectrum of input signal
Figure 4 Corresponding parameters of the input signal
As shown in Figure 4(a) is the code sequence of input signal, which is formed of 20 bits, i.e.,
[0 1 1 0 0 0 0 1 1 0 0 0 1 1 1 1 1 1 1 0] and refers to the telegram information transmitted upwards. It is observed from Figure 4(b) that the time-domain waveform of up-link signal is essentially an equal-amplitude sinusoidal wave. As demonstrated in Figure 4(c) is the spectrum derived from the input signal by means of Fourier Transform, it has two peaks in frequency domain, corresponding to lower
side frequency f and upper side frequencyl f , h
respectively. It could be seen that the height of the peak attached to upper side frequency is greater than that of lower side frequency, which is in conformity to the situation in Figure 4(a) where the time of logic “1” lasts longer than that of logic “0”.
4.2 Electromagnetic Distribution within BUDT Model
Suppose the horizontal distance between the
centers of BTM antenna and balise is ∆x , let
150
x mm
∆ = − and ∆ =x 0 respectively, and the corresponding simulation results of the overall electromagnetic distributions of BUDT at two different positions are shown in Figure 5(a) and 5(b).
[image:4.612.91.302.72.452.2]
Figure 5(a) Overall electromagnetic distribution Figure 5(b) Overall electromagnetic distribution when ∆ = −x 150mm when ∆ =x 0
Figure 5 Overall Electromagnetic Distributions With Different Positions Of BTM Antenna
The density of magnetic induction line is advised to visually depict the strength of electromagnetic distributions. As can be seen from both Figure 5(a) and 5(b), the magnetic induction line is pretty dense nearby balise and relatively sparse at the vicinity of BTM antenna and even sparser in the ambient space. And consequently, it could be inferred that
[image:4.612.92.518.470.630.2]871 distance is too far away, the electromagnetic field strength in the ambient space is the weakest.
For a more comprehensive cognition of the overall electromagnetic field strength distribution
of this process, a cross-sectional view of the electromagnetic field strength on BTM surface is displayed in Figure 6(a) and 6(b).
Figure 6(a) Electromagnetic distribution Figure 6(b) Electromagnetic distribution
[image:5.612.96.522.151.294.2]on BTM surface when ∆ = −x 150mm on BTM surface when ∆ =x 0
Figure 6 Electromagnetic Distributions On BTM Surface
With careful observation, a slight difference could be noted between the two Figures. In Figure 6(a), there are two areas (i.e., right above the balise and at the vicinity of BTM antenna) where the electromagnetic field strength is relatively strong, while in Figure 6(b) there is only one such area (around BTM antenna). The reason for this difference mainly lies in the horizontal distance between balise and BTM antenna. Specifically, when BTM antenna is far away from balise, the coupling coefficient between them is quite weak, as a consequence, the magnetic field distribution is mainly determined by the excitation source; however, when BTM antenna gets quite close to balise, it is able to induce relatively strong voltage signal through electromagnetic induction, which would somehow change the original magnetic distribution in turn.
5. EXPERIMENTAL VERIFICATION
To ensure the validity and credibility of the FEM based model, with the use of simulation results and practical data, contrast verification is carried out from two perspectives of BTM voltages, i.e., static induced voltage (SIV) and dynamic induced voltage (DIV).
5.1 Verification of SIV
For the purpose of acquiring SIV at one fixed
position within a period of time, set ∆ =x 0 where
BTM antenna is fixed right above the balise and apply the identical simulation conditions described above to the model. The simulation results obtained are illustrated in Figure 7(a), 7(c), 7(e) and 7(g); while the corresponding practical data are illustrated in parallel in Figure 7(b), 7(d), 7(f) and 7(h) as contrast.
[image:5.612.101.522.552.656.2]
872
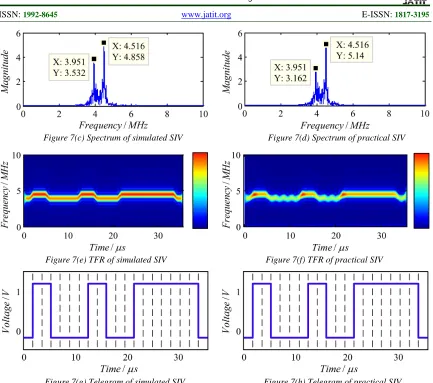
Figure 7(c) Spectrum of simulated SIV Figure 7(d) Spectrum of practical SIV
Figure 7(e) TFR of simulated SIV Figure 7(f) TFR of practical SIV
[image:6.612.92.525.67.450.2]
Figure 7(g) Telegram of simulated SIV Figure 7(h) Telegram of practical SIV
Figure 7 Simulation Results And Practical Data Of Siv And Div
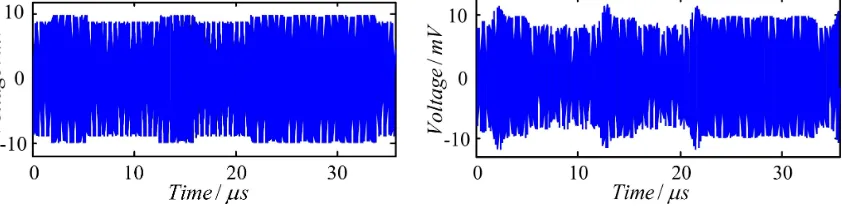
As shown in Figure 7(a) and 7(b) are the time-domain waveforms of SIV under simulation conditions and practical conditions respectively. It could be discovered that they are quite similar to each other no matter in aspect of the amplitude or the overall change law, in addition, the amplitude of simulated signal is fairly smooth due to its relatively ideal conditions, while the practical signal is somehow affected by the influence of noise and overshoot impulse phenomenon appears frequently on the waveform whenever the amplitude fluctuates. Spectrums of simulated signal and practical signal are displayed in Figure 7(c) and 7(d), each of them has two peaks corresponding to lower side frequency and upper side frequency respectively and the heights of peaks are also in consistency. What’s demonstrated in Figure 7(e) and 7(f) are the time-frequency representations (TFR) of SIV signal obtained by employing a time-frequency analysis method named as AOK-TFR
[10]. It could be seen that as time passes, the instantaneous frequency of the signal takes alternative values between lower side frequency and upper side frequency. After demodulation and decoding, the telegram information of simulated SIV and practical SIV are extracted, as displayed in Figure 7(g) and 7(h); it is obvious that the two of them are the same, also in consistency with that of input signal, which successfully proves the validity of this FEM model and credibility of the simulation results.
5.2 Verification of DIV
In this case, ∆x is changeable so that the BTM
873
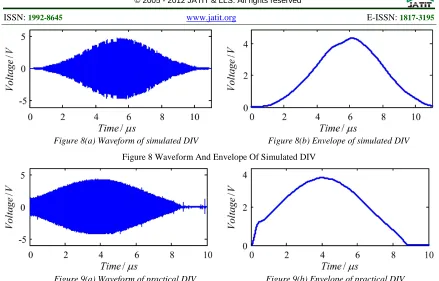
[image:7.612.87.526.64.345.2]Figure 8(a) Waveform of simulated DIV Figure 8(b) Envelope of simulated DIV
Figure 8 Waveform And Envelope Of Simulated DIV
Figure 9(a) Waveform of practical DIV Figure 9(b) Envelope of practical DIV
Figure 9 Waveform And Envelope Of Practical DIV
Figure 8(a) and 9(a) present the time-domain waveforms of BTM DIV signals corresponding to simulation conditions and practical conditions respectively; it is observed that they share nearly the same shape resembling a standard single-peak curve. Why the amplitude of practical signal starts from a certain value attributes to a fact that the data acquisition device from which the signal is acquired has a certain threshold so that only data exceed the threshold would be recorded. What’s displayed in Figure 8(b) and 9(b) are the envelopes extracted from the corresponding time-domain waveforms, and the change law of DIV could be attained by analyzing the envelopes: when the train is far away from the balise, the amplitude of DIV is pretty low, approximate to zero; as the train approaches the balise, DIV amplitude rises speedily and reaches the maximum when the train is right above the balise; with the train leaving the balise, DIV amplitude drops quickly and finally reaches the minimum.
6. CONCLUSIONS
This article proposed a finite element based method for researching the electromagnetic interaction process of BUDT in theoretical level. First, the basic structure and working principle of the system are described, based on that, the electromagnetic model of BUDT is then built by employing FEM. Later, through simulation, the electromagnetic field distribution of the process is
obtained, thus successfully simulated the dynamic balise data transmission process. Finally, contrast verification is accomplished using simulation results and practical data in two aspects, i.e., BTM SIV and BTM DIV, proving that the FEM based model is valid and the simulation results are credible, which will provide theoretical foundations for further studies regarding the optimization of balise information transmission.
ACKNOWLEDGEMENTS
This work was supported by the key project of China Ministry of Railway: “The research of basic theory of high-speed railway -- Research on basic theory of reliable transmission information of track
circuit and balise in high-speed railway”
(2011X021-C).
REFERENCES:
[1] M. Sandidzadeh, A. Khodadadi, “Optimization of balise placement in a railway track using a vehicle, an odometer and genetic algorithm”, Journal of Scientific & Industrial Research, Vol. 70, No. 3, 2011, pp. 210-214.
[2] JF. Sevillano, J. Mendizabal, “Reliability
analysis of an ERTMS on-board balise
transmission equipment”, European Safety and
874 Safety: Theory and Applications, September 7-10, 207-10, pp. 2317-2324.
[3] J Del Portillo, I. Adin, A. Villaro, “Safety analysis of the on-board front-end transceiver of
the Balise Transmission Module”, Reliability,
Risk and Safety: Theory and Applications, September 7-10, 2010, pp.2013-2019.
[4] R. Sharma, RM. Lourde, “Crosstalk Reduction in Balise and Infill Loops in Automatic Train
Control”, Proceedings of 11th International
Conference on Intelligent Engineering Systems, June 29-July 1, 2007, pp. 39-44.
[5] H. Zhao, S. Sun, “Dynamic characteristics modeling and adaptability research of the balise transmission module in high speed railways”, Proceedings of 12th International Conference on Computer System Design and Operation in the Railway and other Transit Systems, August 31-September 2, 2010, pp. 475-482.
[6] H. Zhao, K. Tang, “The Dynamic Characteristics
of Balise Transmission Module and the Assessment on Its Adaptability under High
Speed Condition”, China Railway Science, Vol.
31, No. 3, 2010, pp. 93-96.
[7] N. Xu, JL. Zhang, “The Crucial Techniques of Balise Onboard Test Equipment for High Speed
Train”, China Railway Science, Vol. 31, No. 4,
2010, pp. 131-137.
[8] Union Industry of Signaling SUBSET-036-V
2.4.1 Form Fit Function Interface Specification for Eurobalise 2007.
[9] Union Industry of Signaling SUBSET-085-V 2.2.2 Test Specification for Eurobalise Form Fit Function Interface Specification 2007.