ISSN: 1992-8645 www.jatit.org E-ISSN: 1817-3195
SPEED WARNING SYSTEM USING SOLAR POWER
1N. H. SHAMSUDIN 2N. A. MISDAR 3A. R. ABDULLAH 4M. S. S. M. BASIR 5N.A SELAMAT
1,2,3,4
Department of Electrical Engineering, Universiti Teknikal Malaysia Melaka, Hang Tuah Jaya,
.76100 Durian Tunggal, Melaka, Malaysia
E-mail: [email protected], [email protected], [email protected], 4
[email protected], [email protected]
ABSTRACT
It is recorded that road vehicle accidents in Malaysia are increasing yearly. The major cause to road accident is mostly caused by human speed. Police authorities have enforced the speed limits of the vehicle to control the road accidents. Thus, to monitor the traffic more efficiently, the speed of a moving vehicle is determined by using calculation from particular distance and time as an approach to estimate the vehicle speed. This system is designed to reduce the road accidents in development of speed warning system by using solar power energy. Solar is used to provide the energy to the system in terms of optimizing the operational cost and reducing the energy wastage. It requires a battery to store energy that automatically recharged from solar panel. Three light indicators which are green, yellow and red based on the speed level of vehicles are used in this system. The indicators shows the condition of the speed warning system, whether in slow, fast and very fast conditions. With that, people will be motivated to follow the rules and enhance their responsibilities on the road. At the same time, this system is implemented to increase awareness on people regarding safety. The results are performed for the status of light indicator, the time taken and condition based on the speed detected by the system to show the effectiveness of the system.
Keywords: Solar Energy, Vehicle Speed Detection, Sensor, Microcontroller, Indicator
1. INTRODUCTION
The number of road accidents kept increasing yearly that created problems such as traffic congestion, problem to deal with traffic monitoring and accident that gave negative impact to the road users. Traffic congestion became worse when the accident occurs in high risk areas such as in highway. It was due to the number of vehicles kept rising from 326815 to 477204 cases for over 10 years. Based on the analysis of road accident that was predicted by Malaysian Institute of road safety research (MIROS), the number of road accidents continued to increase from 8,760 in year 2015 and up to 10,716 in year 2020 [1]. The major cause to road accident was mostly caused by human speeding.
Automated Enforcement System (AES) is a speed camera placed at several locations along highways. Their main goals are to discourage speeding, to increase safety and traffic flow to avoid congestion during peak hour [2]. Even though this system is implemented, there are still disadvantages such as people do not compliance with speed limit, increasing the speed after AES is
located and difficult to control traffic congestion. When road accident occurs, it creates inconvenient for road users to cross the road smoothly. The aim of this project is to develop speed warning system by using solar power energy to reduce the road accidents. This system is designed to detect the speed of vehicle with effective cost.
ISSN: 1992-8645 www.jatit.org E-ISSN: 1817-3195
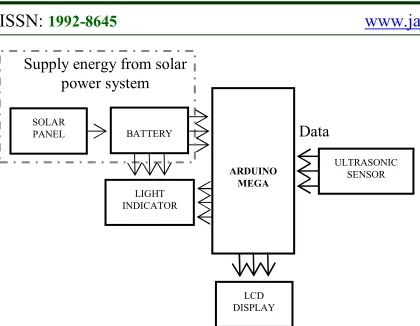
Figure 1: Block Diagram of Solar Powered Speed Warning System
2. SPEED DETECTION SYSTEM
The ultrasonic sensor is used to detect the speed detection of the vehicle. The concept is almost similar with available instruments such as speed trap, radar gun and GPS alert system that focused on speed of the vehicles. Therefore, the concept of this system also the same with available instruments, but this system is speed warning to alert the people about their speed. The common technique is to calculate the speed detection by knowing the distance and time. Where, the distance is set to be constant at 1 meter. As shown in equation 1, the speed measurement is calculated:
υ = tn d- to
( )
kmh (1)d = the real distance between two marking points (start point and end point) measure in meter
tn = the start time measured in seconds
to= the end time measured in seconds
3. RELATED PREVIOUS WORK
There are a few methods to determine vehicle speed detection. A camera system with single motion blurred image is used in [3] to produce speed detection of a vehicle. The speed of a vehicle can be identified within estimated range according to the imaging geometry and the relative position between the cameras by using passive device. The device consists of two components which are the RADAR receives a signal of moving vehicle and converts it to the speed and LIDAR is calculate the speed estimation by using formula. The parameter estimation and image deblurring processes are determined by calculation. Motion blur is a result of practical cameras and relative motion between the camera and moving objects. Blurred image is
captured based on a single image taken by a stationary camera. It occurs in a region of the image corresponding to the dynamic object for an extended period of camera exposure time. The blur image which is selected from the image restoration provides a way to identify the license plate of the vehicle if the motion blurred image is taken.
In [4], video and image processing are used to determine the speed of vehicle detection for traffic surveillance. The Doppler shift is a method used in this paper to detect the frequency shift in reflected wave which the more the Doppler shift, the greater the speed. An error occurred when the radar gun is not affected to the incoming vehicle. This technique is using new algorithms and camera optics to detect vehicle speed. This algorithm has a few components such as video camera, computer and detecting the speed of the vehicle in different lanes. This technique is using the combination and saturation values (CVS) methods for the purpose of background extraction and removal the mark point from background of moving object detection and calculated at the image frame.
An algorithm for automatic vehicle speed detection by using a video camera is applied in [5]. This paper presents a method based on digital image processing to realize the real-time automatic vehicle speed monitoring using video camera. The new algorithm is required to detect the vehicle speed automatically and accurately with only a single video camera. There are two steps to process the data which are the mapping of coordinates from image domain to real-world domain and vehicle detection in video images. The image has been transformed from 2D to 3D when video images are taken on the road traffic by the Formula for Coordinates Mapping. The camera was set up on the road to record the video on the road traffic. The calibration of the coordinate mapping is required to deduce geometrical optics. The video images are used to compare the background image to distinguish the foreground.
The superiority of this system is simple and less dependent in term of equipment used. A 12V battery is used as supply voltage to generate the whole system operation. Meanwhile, the LCD is used to display the speed measurement measured by sensors. From the speed detection as mentioned in [3–4], there is no speed sensor available in the market. Thereby, the ultrasonic sensor is implemented in the system due to its simplicity in detecting the speed. The advantage of this system is
Data SOLAR
PANEL
ARDUINO MEGA
LIGHT INDICATOR
BATTERY
ULTRASONIC SENSOR
LCD DISPLAY Supply energy from solar
ISSN: 1992-8645 www.jatit.org E-ISSN: 1817-3195 the usage of standalone solar panel that provide
supply source to charge the battery.
4. SYSTEM DEVELOPMENT
Figure 2 shows the flow chart of a project to develop the system. This system consists of input and output to design the flow of the process. Firstly, the solar panel is being setup with the battery. They are connected with the charger controller and the system itself. Solar panel acts as input to give a supply to the whole operation system. After being setup, the hardware is designed that includes LCD display, relay, Arduino 2560 and ultrasonic sensor. The sensor also acts as input to initialize the project that send the information to the Arduino 2560 for data processing. The connections of the system need to be tested for the functionality.
Figure 2: The Flow Chart of Solar Powered Speed Warning System
The hardware development of solar powered speed warning system is shown in Figure 3. The purpose of this system is to focus in development of speed warning system by using solar power energy. The solar panel is used to generate electricity directly from the sun to supply the system in terms of saving the environment and energy wastage. It contributes to the decrease of harmful greenhouse gas emission [6]. The energy is stored to the battery while the charger controller is used to keep the
battery from overcharging. This system requires two sensors to determine the speed measurement.
Figure 3: The Hardware Development of Solar Powered Speed Warning System
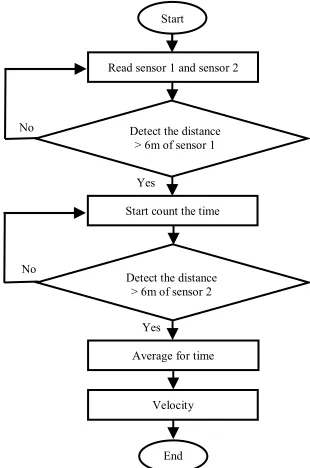
[image:3.612.318.517.129.260.2]Figure 4 shows the flow chart of speed measurement which indicates the process to determine the speed of the vehicle by using two ultrasonic sensors. When both ultrasonic sensors received a signal and the distance is detected up to 6 meters of the vehicle, the sensors start to read the data which include the time taken that has been programmed. Speed measurement is set to be constant. The distance is set at 1 meter between both of the sensor and the time taken is getting along both of the sensor. All of this process is repeated until an accurate speed is gained.
Figure 4: The Flow Chart of Speed Measurement Solar
panel
Electric current
Charger controller
Battery
Light indicator Solar irradiance
from the sun
Arduino
Ultrasonic sensor
Yes Solar as supply to the system
Display speed measurement on LCD Start
Initialization Input : Solar and sensor
Output : Liquid crystal display (LCD) and light indicator
Speed measurement by sensor from Arduino microcontroller
Light indicator is turned ON based on the level of speed measurement
Is it the speed measurement same with speedometer?
End
No
Read sensor 1 and sensor 2
Yes
Average for time
Velocity Start
Start count the time
End Detect the distance
> 6m of sensor 1
No
Detect the distance > 6m of sensor 2
[image:3.612.103.290.314.561.2] [image:3.612.351.506.444.678.2]ISSN: 1992-8645 www.jatit.org E-ISSN: 1817-3195 The simulation of the system connections that is
[image:4.612.329.524.74.212.2]designed to test the hardware is displayed in Figure 5. It consists of three parts which are ultrasonic sensor, LCD display and light indicator. The light indicator part requires relay to control light indicator based on the speed of the vehicle. This ultrasonic sensor part requires two sensors to detect the speed of the vehicle. Lastly, the LCD is used to display the speed measurement of the system.
Figure 5: Simulation Circuit of Solar Powered Speed Warning System by Using Proteus ISIS
5. SYSTEM LOCATION
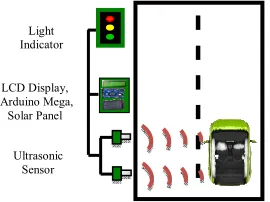
[image:4.612.125.274.205.334.2]Figure 6 shows the component arrangement on the roadside. This project is designed to be used in green energy environment. The sensor is located 4 meters from the light indicator to alert user about their vehicle speed. Then, light indicator is turned ON based on the speed of the vehicle. This system requires two ultrasonic sensors to measure the speed based on equation of distance over time.
Figure 6: The Illustration of the Component Arrangement
Figure 7 described connection of the component for solar powered speed warning system that consists of a solar panel, battery, charge controller, ultrasonic sensor and light indicators. This construction is the designed that used in speed detection system.
Figure 7: Connection of the Component for Solar Powered Speed Warning System
6. RESULTS
[image:4.612.371.487.447.533.2]In the development of this project, the results are tested and verified in order to ensure the system functionality and performance. The screen shows parameters of the vehicle speed detection that are programmed by using Arduino microcontroller. From Figure 8, the parameters such as vehicle speed, time taken and speed status are displayed by LCD. The parameters indicate the maximum speed detected by vehicle. Sensor (S1) and sensor (S2) are represented as ultrasonic sensor. Both of the sensors functions to detect the speed of the vehicle. Therefore, if one of the sensors or both of the sensors are detected, then it will be displayed on the screen of the system.
Figure 8: The Parameter of System Displayed On LCD
6.1 Limitation of Speed Detection
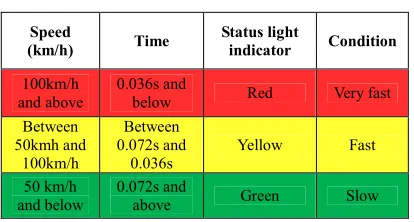
The testing performance is conducted to determine the effective speed used by the available instrument sensor. Particularly, there are three conditions regarding on the measuring speed. Table 1 depicts the testing performance condition for the status of light indicator, the time taken and condition based on the speed detected by the system. The first condition is when the status of light indicator shows green indicator to represent the ‘slowest’ condition. The time taken is above 0.072s, then, the speed captured is below 50 km/h. Next, the time taken to detect the speed is between Light
Indicator
Ultrasonic Sensor LCD Display, Arduino Mega,
Solar Panel
Solar Panel
Battery
Charger Controller Light
[image:4.612.125.260.506.607.2]ISSN: 1992-8645 www.jatit.org E-ISSN: 1817-3195 0.072s and 0.036s, whereby the speed limit detected
[image:5.612.172.516.69.361.2]is between 50 km/h and 100 km/h represent ‘fast’ condition. Thus, the status of the light indicator displays the yellow indicator. For last conditions, the light indicator appears in red indicator when the speed limit is above 100 km/h. Then, the time taken to detect the speed is 0.036 indicates ‘very fast’ conditions. The range of speed is programmed by using the Arduino 2560 compiler depending on location such as highway, school and urban area. The capability to detect the speed is proven if the speed is fulfilled in this condition.
Table 1: The Testing Performance Condition
Speed
(km/h) Time
Status light
indicator Condition
100km/h and above
0.036s and
below Red Very fast
Between 50kmh and
100km/h
Between 0.072s and
0.036s
Yellow Fast
50 km/h and below
0.072s and
above Green Slow
6.2 Validity of System
To validate the system, there are ten trials test that has been recorded to show the system is accurate. The vehicle test is done on the road side. Table 2 presents the result for the percentage error of the vehicle test including time taken, testing speed and exact speed. The speed measurement is the speed detection that being displayed on the LCD, while actual speed refers to the speedometer. The time taken is to determine the performance of the speed detection because the distance is set to be constant at 1 meter. However, the measurement speed should have the exact value as the actual speed. In this case, when the measurement speed did not meet the requirement of the actual speed, then the error percentage is calculated to reduce the error. The percentage error of the system is obtained as shown in:
Percentage error (%) = (Measurement speed – Actual speed)/(Actual speed) x 100% (2)
Table 2: Percentage Error for Vehicle Test
Trial
Time Taken
(s)
Measurement speed (km/h)
Actual speed (km/h)
Error (%)
1 0.094 38 48 20.83
2 0.088 41 50 18.00
3 0.090 40 48 16.67
4 0.092 39 46 15.22
5 0.099 36 42 14.29
6 0.102 35 40 12.55
7 0.105 34 38 10.52
8 0.099 36 39 7.69
9 0.099 36 38 5.26
10 0.083 43 44 2.27
Figure 9: Connection of the Component for the System
To further evaluate the accuracy of the system, the percentage error of vehicle speed detection is calculated as displayed in Figure 9. The graph of speed against trial for vehicle speed detection is plotted. The line graph indicated the speed measurement and actual speed to show an error during the testing. Several trials were done to reduce the error. The maximum percentage error that detected at the trial 1 is slightly different because of systematic error such as detection of sensor and an error at the Arduino. At trial 2 until 5 shows slightly decreased, by means it is at a constant percentage of error at 16.63%. While the percentage error for trial 5 until 7 at 35 km/h speed, it presented only minor percentage of error due to the less of error at the time recorded between sensor 1 and 2. The minimum percentage of error at trial 10 is reduced when more trial is repeated. Based on the analysis, the speed measurement has the lowest error which below 2.27% that gives a better result. The effectiveness of the system is improved when more trial is conducted as to reduce the error, thus the system is valid to be used. The percentage of error is obtained to ensure the system reached the desired speed.
6.3 Performance Test
The validity of speed is to verify the
speed measurement of a vehicle. The
Speed (km/h)
[image:5.612.92.299.254.365.2]ISSN: 1992-8645 www.jatit.org E-ISSN: 1817-3195
[image:6.612.92.299.272.713.2]performance testing
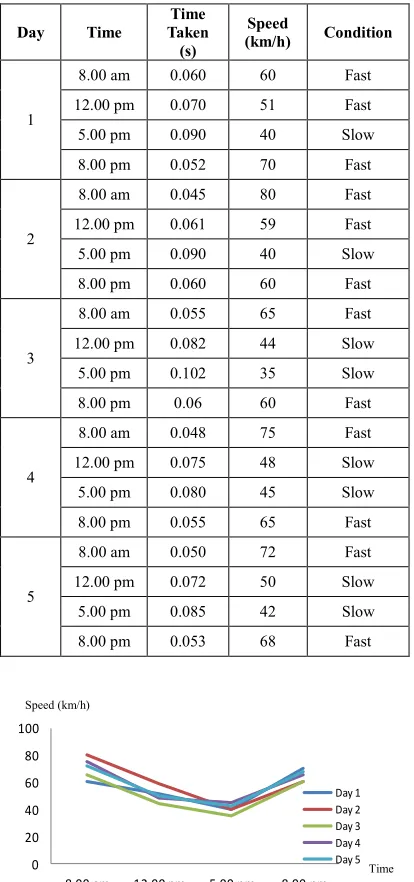
conducted on the road to ensure the system is accurate. Table 3 shows the data has been tested under different period of days. From the data, it presents the current traffic condition that response to time. The longer the period tested, the more accurate the results. As a requirement for speed detection based on the time taken that displayed on the LCD, it should have the exact time that can make the speed is correctly. From the table, it shows that the time taken is between 0.072s and 0.036s. Then, the speed is in fast condition. Besides that, in slow condition the time taken is below 0.072s.Table 3: Percentage Error for Vehicle Test
Day Time
Time Taken
(s)
Speed
(km/h) Condition
1
8.00 am 0.060 60 Fast
12.00 pm 0.070 51 Fast
5.00 pm 0.090 40 Slow
8.00 pm 0.052 70 Fast
2
8.00 am 0.045 80 Fast
12.00 pm 0.061 59 Fast
5.00 pm 0.090 40 Slow
8.00 pm 0.060 60 Fast
3
8.00 am 0.055 65 Fast
12.00 pm 0.082 44 Slow
5.00 pm 0.102 35 Slow
8.00 pm 0.06 60 Fast
4
8.00 am 0.048 75 Fast
12.00 pm 0.075 48 Slow
5.00 pm 0.080 45 Slow
8.00 pm 0.055 65 Fast
5
8.00 am 0.050 72 Fast
12.00 pm 0.072 50 Slow
5.00 pm 0.085 42 Slow
[image:6.612.94.302.273.715.2]8.00 pm 0.053 68 Fast
Figure 10: Testing Performance of Speed Detection
Figure 10 shows the testing performance of speed detection for the graph of speed against time that conducted on the road side. As for traffic road monitoring system, this graph analyzed the speed detection during peak hour to compute the effectiveness of the system. The average of speed detection for all trials at the morning is 70.4 km/h. This condition operates at high speed which can be categorized in fast speed condition. Traffic conditions between 8.00 am and 12.00 pm shows slightly decrease of speed detection. During this hour, the average of speed detection is 50.4 km/h. The speed can be considered as fast speed conditions. The speed between 40km/h and 45 km/h at the 5.00 pm represents the slow speed detection and the average of speed detection is 40.4km/h. At 8.00 pm, the average speed is increased to 64.6 km/h. The testing performance shows the efficiency of the system to be applied on the road.
6.4 Discharge Current of Battery
The battery is required to store the energy from the solar panel as a supply. Lithium ion battery is the type of rechargeable battery. The capacity of the battery used in this system is 12V and 7.2Ah. Table 4 shows the parameter of light indicators based on the datasheet as depicted in Figure 12. It required the parameter of load to know the time for charging and discharging. The voltage of the light indicator that used in this system is 12V, while the power energy of each light indicator is different. The value of power and current for light indicator of red is 7W and 0.58A. For the yellow indicator the power is 8W while the current is at 0.66A. Then the green indicator indicates the power is 9W and the current is at 0.75A. The charge and discharge current has been done testing. The testing start from the battery is empty until it is fully charging.
Table 4: The Parameter of Light Indicator
Red Yellow Green Voltage (V) 12 12 12
Current (A) 0.58 0.66 0.75
Power (W) 7 8 9
0 20 40 60 80 100
8.00 am 12.00 pm 5.00 pm 8.00 pm
Day 1 Day 2 Day 3 Day 4 Day 5 Speed (km/h)
ISSN: 1992-8645 www.jatit.org E-ISSN: 1817-3195
Figure 11: The Time Discharge Current for the Battery
Figure 11 represents the graph of time discharge current for the battery. The total current of the light indicator is 1.99A. The battery life is depending on the capacity of the current battery. By referring the graph as shown in Figure 13, the battery can last long up to 2 hours for discharge. The bigger the size of the capacity of the battery, the longer is the battery life span.
7. CONCLUSIONS
Safe driving environment leads to the minimization of road accidents. This environment can be achieved by the development of a speed warning system. The novelty of this system is measurement of vehicle speed by using sensors. There are three speed conditions consists of ‘red’ indicator for very fast, ‘yellow’ indicator for fast and ‘green’ indicator for slow. The system performance indicates the lowest percentage error of 2.27% among 10 trials conducted, verifying the effectiveness of the system to be implemented on the road. Meanwhile, the solar energy supplied to the system will be stored in a battery which has 2 hours of discharge capabilities due to the capacity of the battery.
ACKNOWLEDGEMENTS
The authors would like to thanks Universiti Teknikal Malaysia Melaka (UTeM) and to the Ministry of Higher Education Malaysia (MOHE) for giving the cooperation and funding to this research who make the research successful which are RAGS/2014/TK03/FKE/B00050. Their support is gratefully acknowledged.
REFRENCES:
[1] Royal Malaysia Police, Road Accident Statistics Malaysia 2007. Percetakan Nasional Malaysia Berhad, Kuala Lumpur, 2007.
[2] M. K. Hamzah, P. NG. Choy, F. H. Khairudin, M. A. Yusof, "The Automated Speed Enforcement System – A Case Study in Putrajaya", Proceedings of the Eastern Asia Society for Transportation Studies, Vol.9, 2013. [3] Z. Sen, Solar Energy Fundamentals and
Modeling Techniques: Atmosphere,
Environment, Climate Change and Renewable Energy: Springer, 2008.
[4] A. M. Flynn, “Combining Sonic and Infrared Sensors for Mobile Robot Navigation,” The International Journal of Robotics Research, vol. 7(6), 1988, pp. 5-14.
[5] Y. L. Huei ,J. L. Kun, H. C. Chia, “ Vehicle Speed Detection From a Single Motion Blurred Image”, Image and Vision Computing 26, pp 1327–1337, 2008.
[6] G. R. Arash, D. Abbas and M. R. Karim, "Vehicle Speed Detection in Video Image Sequences Using CVS Method", International Journal of the Physical Sciences Vol. 5(17), pp. 2555-2563, 18 December, 2010.
[7] J. P. Wu, Z. Liu, J. X. Li, "An Algorithm for Automatic Vehicle Speed Detection using Video Camera", Proceedings 4th International Conference on Computer Science & Education, 2009.
[8] A. Mota, J. Vieira, “Maximum Power Point Tracker Applied to Charging Batteries with PV Panels, Solar Collectors and Panels, Theory and Applications”, Dr. Reccab Manyala (Ed.), ISBN: 978-953-307-142-8, 2010.
[9] Z. Yi, H. Y. Khing, C. S. Chua, X. W. Zhou, ”Multi-ultrasonic Sensor Fusion for Mobile Robots,” Proc. of 2000 IEEE Int. Symposium on Intelligent Vehicle.
[10] N. Kassem, A. E. Kosba, M. Youssef, "RF-Based Vehicle Detection and Speed Estimation", 978-1-4673-0990-5/12, 2012. [11] R. W. Fransiska, E. M. P. Septia, W. K.
Vessabhu, W. Frans, W. Abednego, "Electrical Power Measurement using Arduino Uno Microcontroller and LabVIEW "3rd International Conference on Instrumentation, (ICICI-BME), pp. 226 - 229, 2010.
ISSN: 1992-8645 www.jatit.org E-ISSN: 1817-3195 System for Detecting Falling Objects on
Railways", June 1447, 2004.
[13] L. Feiyu, Y. Jijiang, "A study of precise vehicle speed Measurement using Bluetooth and SCM Technology", 978-1-4244-3693-4/09, 2009. [14] J. Garche, A. Jossen, H. Doring, “The Influence