R E S E A R C H
Open Access
Support system for classification of
beat-to-beat arrhythmia based on variability
and morphology of electrocardiogram
Jonathan Araujo Queiroz
*, Luana Monteiro Anaisse Azoubel and Allan Kardec Barros
Abstract
Background: Several authors use the R-R interval, which is the temporal difference between the largest waves (R waves) of the electrocardiogram (ECG), to propose a support system for the diagnosis of arrhythmias. However, R-R interval analysis does not measure ECG waveform deformations such as P wave deformations for atrial fibrillation. Objective: In this study, we propose an arbitrary analysis the any segment of the heartbeat. This analysis is a generalization of a previous work that measures the wave deformations of the ECG signal.
Methods: We proposed to investigate the voltage (mV) variation occurring at each heartbeat interval using statistical moments. Unlike the R-R interval in which each heartbeat is associated with a single real number, the proposed method associates each heartbeat to a set of points, that is, a vector. The heartbeats were obtained in the following databases: MIT-BIH Normal Sinus Rhythm, MIT-BIH Atrial Fibrillation (AF), and MIT-BIH Arrhythmia; and the classifiers used to evaluate the proposed method were linear discriminant analysis, k-nearest neighbors, and support vector machine. The experiments were conducted using 80% of the patients for training (16 healthy patients, 41 patients with arrhythmia, and 20 patients with AF) and 20% of the patients for testing (2 healthy patients, 6 patients with arrhythmia, and 3 patients with AF).
Results: The proposed method proved to be efficient in solving global (accuracy is up to 99.78% in the arrhythmia classification) and local (accuracy of 100% in the AF classification) heartbeat problems.
Conclusion: The results obtained by the proposed method can be used to support decision-making in clinical practices.
Keywords: Heartbeat, R-R interval, Morphological information, Statistical moments, Arrhythmias, Atrial fibrillation
1 Introduction
World Health Organization indicates that, each year, 17.3 million people die worldwide from cardiovascular disease [1]. In this context, the interest in noninvasive analysis techniques for the diagnosis of arrhythmias, such as the electrocardiogram (ECG), is increasing.
The ECG is an examination that records the variation of the electrical potentials of the cardiac muscle. ECG is composed of the P wave that corresponds to the electrical activity of the atria, by the Q, R, and S waves compos-ing the QRS complex that corresponds to depolarization
*Correspondence:[email protected]
Department of Electrical Engineering, Federal University of Maranhão, Av. dos Portugueses, 1966, Bacanga, 65080-805 São Luis, Maranhão, Brazil
of the ventricles, by the T wave that registers the repo-larization of the ventricles [2]. From the QRS complex, specifically the R waves (larger peaks of the ECG signals), it is possible to obtain R-R intervals which are the time difference between two R waves.
Conventionally, the R-R interval is used to data extrac-tion from the ECG signal in order to diagnose different types of arrhythmia [3–8]. However, the analysis of the R-R intervals is not able to measure changes on other ECG waves, such as the distortions on P wave for atrial fib-rillation (AF) [9–12]. Thereby, some studies segment the ECG signal [13–17]. Nevertheless, the diagnosis is still not ideal. The present research proposes an arbitrary analysis to any segment of the ECG signal. This analysis is based on ECG variability and morphology. The morphological
information of the ECG signal is obtained by the voltage (mV) variation investigation occurring to each heartbeat interval. This new method of data extraction will allow a beat-to-beat analysis. Unlike the R-R interval in which each heartbeat is associated with a single real number, the proposed method associates each heartbeat to a set of points, that is to say, to a vector.
In this study, we propose to investigate the morphologi-cal information occurring at each heartbeat interval using statistical moments. The statistical moments used were variance, skewness, and kurtosis. The improvement in performance is due to the information obtained from the voltage variability and the morphology of the ECG signal, i.e., in addition to the frequency modulation informa-tion used in the heart rate variability (HRV) calculainforma-tion, we added the amplitude modulation. Thus, to classify different types of arrhythmias, we use two modulation information of the ECG signal (frequency and amplitude), not just one as in the calculation of HRV. Unlike the R-R interval, in which each heartbeat is associated with a single real number, the proposed method associates each heartbeat with a set of points, that is, a vector.
The ECG signals were obtained in the databases MIT-BIH Normal Sinus Rhythm, MIT-MIT-BIH Atrial Fibrillation, and MIT-BIH Arrhythmia. The classifiers used to evaluate the proposed method were linear discriminant analysis, k-nearest neighbors, and support vector machine.
2 Materials and methods
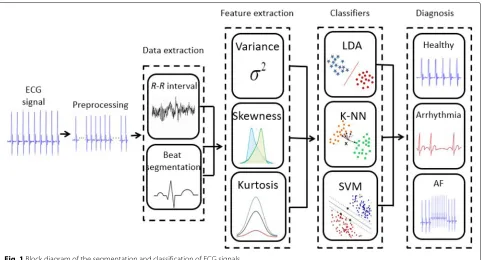
The proposed method is based on the observation that arrhythmias episodes change the morphology of the ECG
signal. A block diagram is shown in Fig.1, and each of the processing blocks is described in the following.
2.1 Datasets
The ECG signals were obtained from the databases (DB): MIT-BIH Normal Sinus Rhythm (NSR) database contains 18 ECG recordings of approximately 24 h duration. Sub-jects included in this database had no significant arrhyth-mias; they include 5 men, aged 26 to 45, and 13 women, aged 20 to 50 [18]; MIT-BIH Arrhythmia database con-tains 48 half-hour excerpts of two-channel ambulatory ECG recordings, obtained from 47 subjects [19], and MIT-BIH AF contains 319 episodes of atrial fibrillation. The individual recordings have approximately a 10-h duration of 25 individuals [20].
Database records contain the rhythm types: atrial bigeminy, atrial fibrillation, atrial flutter, ventricular bigeminy, 2o heart block, idioventricular rhythm, nor-mal sinus rhythm, nodal (A-V junctional) rhythm, paced rhythm, pre-excitation (WPW), sinus bradycardia, supraventricular tachyarrhythmia, ventricular trigeminy, ventricular flutter, and ventricular tachycardia.
2.1.1 Pre-processing
In the preprocessing step, the goal is to reduce contamina-tion of different types of noise and artifacts in the ECG sig-nal. Therefore, to perform this work, the following types of noise have been removed: a signal in the frequency of 60 Hz and its bandwidth below 1 Hz; baseline wan-der, a low-frequency (0.15 up to 0.3 Hz) noise that results from the patient inhaling and compels a baseline shifting
of the ECG signals; electrode contact noise, noise that results from a deficiency in the contiguity between the electrode and skin, which adequately cuts off the measure-ment system from the subject; electrode motion artifacts, artifacts that result from variations in the electrode-skin impedance with electrode motion; muscle contractions, noise that results from the contraction of other muscles apart from the heart; electrosurgical noise, noise pro-duced from other medical apparatus in the patient care circumstance at frequencies between 100 and 1 MHz; and instrumentation noise, noise produced by the electronic equipment utilized in the ECG measurements [21].
From the records of the MIT-BIH NSR, MIT-BIH Arrhythmia, and MIT-BIH AF bases, as described in Section 2, 50,000 healthy heartbeat and 50,000 heart-beat of people with AF were withdrawn. Less than 1%, at the beginning and at the end, of the ECG signals were excluded due to measurement error. The ECG signal was normalized, and the sampling frequency was set to 128 Hz with 12-bit resolution in a range of±10 mV. Two or more cardiologists independently annotated each record; disagreements were resolved to obtain the computer-readable reference annotations for each beat (approx-imately 110,000 annotations in all) included with the database.
2.2 Data extraction of the heartbeat
The data extraction of the ECG signal proposed in this study is carried out by analyzing the voltage variation on each heartbeat and is given by [22]
B=(bstart,b2,· · ·,bend), (1)
whereBis a heartbeat,bstartandbendare given by
bstart=PR−Fsλ, (2)
and
bend=PR+Fsθ, (3)
wherePRis the position of theRpeak (PRare found in
annotation files in MIT-BIH database),Fsis the sampling
frequency, andλandθ are the proportion weights of the heartbeat, beingλ+θ ≤ 1. The parametersλandθ are heuristically assigned and function as slidingwindowson the heartbeat.
2.3 Method’s generalization
The method presented in the previous Section2.2 specifi-cally analyzes heartbeat. Nevertheless, an arbitrary analy-sis to any segment of the heartbeat is defined as
X=(xstart,x2,· · ·,xend), (4)
whereXis any segment of a heartbeat. If the segment of interest in the heartbeat begins before the peak of the R wave, Eq.2must be used, but if the segment of interest
starts after the peak of the R wave, Eq.3should be used. Both equations are heuristically adjusted. The end of an arbitrary segment in the ECG signal, from a specific part in a given heartbeat or even a succession of heartbeats, is given by
xend =taFs, (5)
where ta is the arbitrary period in the heartbeat or the
ECG signal.
Another point of interest within the ECG is the peak of the P, QRS, and T waves. Therefore, the peak of the waves is defined as
PX=max(X). (6)
Finally, a heartbeat can be defined as
B=PPQQRSSTT = (7)
2.4 Feature extraction of the heartbeat
Modulation of the ECG signal can be performed in time (or frequency) and in amplitude (or energy). For frequency modulation, HRV is used, and for amplitude modula-tion, presented in Section2.3, the voltage variation of the ECG signal was used. Thus, to classify different types of arrhythmias, we use two modulation information of the ECG signal, unlike several authors that only use the time modulation (HRV) [23–28]. The use of the two modula-tions allows a greater characterization of the ECG signal, improving the quality of the classification of arrhythmia. The variance, skewness, and kurtosis were used in this study to extract characteristics of both the ECG signal modulations.
Proposed method will be evaluated in a generalist (arrhythmia classification) and specialist (AF classifica-tion) manner.
2.5 Performance evaluation
Metrics for evaluation are specificity (SPEC—how effi-cient is the method for diagnosing healthy patients), sen-sibility (SENS—how efficient is the method for diagnos-ing patients with arrhythmias), and accuracy (ACC—how efficient is the method regarding the diagnosis).
The sensitivity and specificity are defined, respectively, given by
And the accuracy is given by
ACC= TP+TN
TP+TN+FN+FP ×100 (16)
where TP is the true positive, TN is the true negative, FP is the false positive, and FN is the false negative.
3 Results
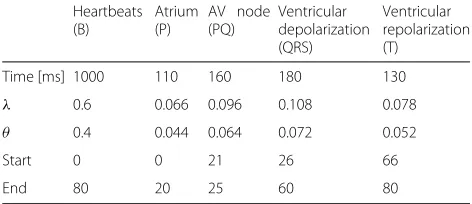
The experiments were conducted using 150,000 heart-beats (50,000 healthy heartheart-beats, 50,000 heartheart-beats of people with arrhythmia, and 50,000 heartbeats of people with AF). In the experiments, we used 80% of the patients for training (16 healthy patients, 41 patients with arrhyth-mia, and 20 patients with AF) and 20% of the patients for testing (2 healthy patients, 6 patients with arrhythmia, and 3 patients with AF). The classification of heartbeats was performed based on the following: the linear dis-criminant analysis (LDA) was used in its linear version; k-nearest neighbors (k-NN) ranged in up to 2–5 nearest neighbors, and support vector machine (SVM) used the polynomial kernel function. Heartbeat obtained accord-ing to Section2.1and the parameters used were shown in Table1.
Table 2 shows the average accuracy of the classifiers (LDA, k-NN, SVM) for 4 different ECG windows (heart-beat, P wave, QRS complex, T wave).
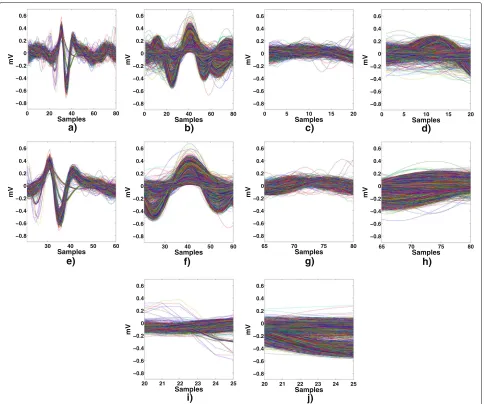
Figure 2 illustrates the heartbeat, P wave, QRS com-plex, T wave, and PQ segment processed by the proposed
Table 1Parameters used in the ECG window
Heartbeats
Time [ms] 1000 110 160 180 130
λ 0.6 0.066 0.096 0.108 0.078
θ 0.4 0.044 0.064 0.072 0.052
Start 0 0 21 26 66
End 80 20 25 60 80
λis the proportion weight used from the start of the heartbeat, andθis the proportion weight used from the end of the heartbeat
Table 2ECG window by the method proposed in 5 different cases
Average accuracy %
Classifier Heartbeat P QRS T
Healthy LDA 99.99 99.95 99.98 99.95
k-NN 99.99 99.96 99.98 99.95
SVM 99.99 99.96 99.98 99.96
Arrhythmia LDA 99.97 99.01 99.93 99.03
k-NN 99.97 99.03 99.94 99.04
SVM 99.97 99.08 99.94 99.04
Atrial fibrillation LDA 99.97 98.07 99.95 99.98
k-NN 99.97 99.07 99.98 99.98
SVM 99.99 99.03 99.98 99.07
LDAlinear discriminant analysis,k-NNk-nearest neighbors,SVMsupport vector machine
method according to the parameters described in the Table1
Table 3 shows the average accuracy of the classifiers using variance, skewness, and kurtosis in the diagnosis of arrhythmia and AF. The results in this study are eval-uated using 10-fold cross-validation, that is, definitive classification is the mean of the metrics (specificity, sensi-tivity, and accuracy) for ten different sets of training and testing.
Figure3illustrates the dispersion to features extracted by the proposed method for each heartbeat.
4 Discussion
0 20 40 60 80
Fig. 2Proposed method for data extraction of the heartbeats.aHealthy,barrhythmia,cP wave,dP wave,eQRS complex,fQRS complex,gT wave,hT wave,iP-Q interval,jP-Q interval
Table 3Average accuracy of the classifiers (LDA, k-NN, SVM) using the proposed data extraction
Average accuracy %
R-R σ2
X γX κX σX2+γX σX2+κX γX+κX σX2+γX+κX
Arrhythmia
LDA 84.40 92.07 91.43 93.02 96.73 99.45 99.28 99.78
k-NN 84.40 92.07 91.43 93.02 96.73 99.45 99.28 99.78
SVM 84.40 92.07 91.43 93.02 96.73 99.45 99.28 99.78
Atrial fibrillation
LDA 85.70 94.73 93.45 95.52 97.72 99.97 99.78 100
k-NN 85.70 94.73 93.45 95.52 97.72 99.97 99.78 100
SVM 85.70 94.73 93.45 95.52 97.72 99.97 99.78 100
LDAlinear discriminant analysis,k-NNk-nearest neighbors,SVMsupport vector machine,σ2
X
0 0.05 0.1 0.15 0.2 −5
0 5
0 2 4 6 8 10
Variance
a)
Skewness
kurtosis
Healthy Arrhythmia
0 0.5 1 1.5 2
−5 0 5
0 2 4 6 8 10
Variance
b)
Skewness
kurtosis
Healthy AF
Fig. 3Dispersion of the features extracted by the proposed method (variance, skewness, and kurtosis) for each heartbeat.aFeatures of healthy patients and patients with arrhythmia.bFeatures of healthy patients and patients with AF
The proposed method proved to be efficient in solv-ing global (accuracy is up to 99.78% in the arrhythmia classification) and local (accuracy of 100% in the AF classi-fication) heartbeat problems. The improvement in perfor-mance is due to the information obtained from the voltage variability and the morphology of the ECG signal, i.e., in addition to the frequency modulation information used in the HRV calculation, we added the amplitude modula-tion. The variation ofkvalues (2–5 nearest neighbors) in the classification of the heartbeats was lower than 0.07%. The accuracy rate of the moments (variance, skewness, and kurtosis) when used separately is up to 9.82% and together is up to 15.38% when compared to the R-R inter-val (Table 3). The invariance in the average accuracy of the classifiers used (LDA, k-NN, SVM) is due to separabil-ity between healthy and with arrhythmia patients (Fig.3a) and also between healthy and with AF patients (Fig.3b).
The separability between healthy and those with arrhythmia patients (Fig. 3a), also between healthy and those with AF (Fig.3b), is due to the information obtained from the voltage variability and the morphology of the ECG signal, i.e., in addition to the frequency modula-tion informamodula-tion used in the heart rate variability (HRV), we added the amplitude modulation. Thus, to classify different types of arrhythmias, we use two modulation information of the ECG signal (frequency and amplitude). In addition, the value in the right part of the image (cross red) corresponds to a single beat that is located at the beginning of the ECG signal. Of course, the 1% rejection window used in this work was not large enough to exclude this beat.
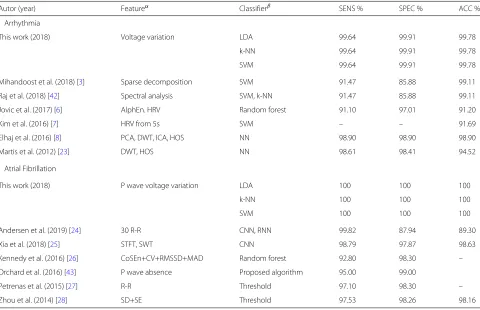
Table 4Sensitivity, specificity, and accuracy of the proposed methodology compared to the literature for arrhythmia and AF classification, evaluated for MIT-BIH Normal Sinus Rhyth, MIT-BIH Arrhythmia, and MIT-BIH Atrial Fibrillation databases
Autor (year) Featureα Classifierβ SENS % SPEC % ACC %
Arrhythmia
This work (2018) Voltage variation LDA 99.64 99.91 99.78
k-NN 99.64 99.91 99.78
SVM 99.64 99.91 99.78
Mihandoost et al. (2018) [3] Sparse decomposition SVM 91.47 85.88 99.11
Raj et al. (2018) [42] Spectral analysis SVM, k-NN 91.47 85.88 99.11
Jovic et al. (2017) [6] AlphEn. HRV Random forest 91.10 97.01 91.20
Kim et al. (2016) [7] HRV from 5s SVM – – 91.69
Elhaj et al. (2016) [8] PCA, DWT, ICA, HOS NN 98.90 98.90 98.90
Martis et al. (2012) [23] DWT, HOS NN 98.61 98.41 94.52
Atrial Fibrillation
This work (2018) P wave voltage variation LDA 100 100 100
k-NN 100 100 100
SVM 100 100 100
Andersen et al. (2019) [24] 30 R-R CNN, RNN 99.82 87.94 89.30
Xia et al. (2018) [25] STFT, SWT CNN 98.79 97.87 98.63
Kennedy et al. (2016) [26] CoSEn+CV+RMSSD+MAD Random forest 92.80 98.30 –
Orchard et al. (2016) [43] P wave absence Proposed algorithm 95.00 99.00
Petrenas et al. (2015) [27] R-R Threshold 97.10 98.30 –
Zhou et al. (2014) [28] SD+SE Threshold 97.53 98.26 98.16
The symbol (–) represent the values not specified in the works
AlphEnalphabet entropy,HRVheart rate variability,PCAprincipal component analysis,DWTdiscrete wavelet transform,ICAindependent component analysis,HOShigher order spectra,CoSEncoefficient of sample entropy,CVcoefficient of variance,RMSSDroot mean square of the successive differences,MADmedian absolute deviation,SD symbolic dynamics ,SEShannon entropy,RRR-R intervals,STFTshort-term Fourier transform,SWTstationary wavelet transform,LDAlinear discriminant analysis,k-NN k-nearest neighbors,SVMsupport vector machine,NNneural network,CNNconvolutional neural network,RNNrecurrent neural network
Table 4 shows that even when compared with linear
techniques such as SVM or nonlinear techniques like neu-ral network, this study showed superior results in the arrhythmia classification (accuracy of 99.78%) and AF classification (accuracy of 100%). The improvement in performance is due to the information obtained from the voltage variability and the morphology of the ECG signal, i.e., in addition to the frequency modulation information used in the HRV calculation, we added the amplitude modulation. Thus, to classify different types of arrhyth-mias, we use two modulation information of the ECG signal (frequency and amplitude), not just one as in the calculation of HRV.
4.1 Limitation
The proposed data extraction is measured by statistical moments. The statistical moments are dependent on the average of the samples; actually, a large number of out-liers can complicate the analysis of the data. In addition, the temporal information of the ECG signal can not be
obtained directly, that is, it is not trivial to verify changes in the heart rate by the proposed method.
5 Conclusions
a prognosis for various arrhythmias. Our next challenge is to implement and evaluate the proposed method in real time.
Abbreviations
AlphEn: Alphabet entropy; CV: Coefficient of variance; ACC: Accuracy; AF: Atrial fibrillation; CoSEn: Coefficient of sample entropy; DWT: Discrete wavelet transform; ECG: Electrocardiogram; HOS: Higher order spectra; HRV: Heart rate variability; ICA: Independent component analysis; k-NN: k-Nearest neighbors; LDA: Linear discriminant analysis; MAD: Median absolute deviation; mV: voltage; NSR: Normal Sinus Rhythm; PCA: Principal component analysis; RMSSD: Root mean square of the successive differences; SD: Symbolic dynamics; SE: Shannon entropy; SENS: Sensibility; SPEC: Specificity; SVM: Support vector machine
Acknowledgements
We would like to thank PPGEE-UFMA for infrastructure development.
Funding
We would like to thank FAPEMA and CNPq for financial support.
Availability of data and materials
The database used in this study is public and can be found inhttps:// physionet.org/.
Authors’ contributions
All authors contributed to the design and analysis of the paper and participated in the writing of the document. JAQ drafted the manuscript, carried out the basic literature review, and elaborated the method of the presented approach. LMAA developed the methods of the data evaluation. AKB reviewed the manuscript and evaluation of all the proposed methods. All authors read and approved the final manuscript.
Ethics approval and consent to participate
Not applicable.
Consent for publication
All authors reviewed the manuscript critically. All authors read and approved the final manuscript.
Competing interests
The authors declare that they have no competing interests.
Publisher’s Note
Springer Nature remains neutral with regard to jurisdictional claims in published maps and institutional affiliations.
Received: 26 July 2018 Accepted: 4 February 2019
References
1. S. Mendis, P. Puska, B. Norrving, World Health Organization, World Heart Federation, et al.,Global atlas on cardiovascular disease prevention and control. (S. Mendis, ed.) (World Health Organization, Geneva, 2011).http:// www.who.int/iris/handle/10665/44701
2. S. A. Khonsary,Guyton and Hall Textbook of Medical Physiology. (Department of Neurosurgery, Skull Base Laboratory, UCLA School of Medicine, Los Angeles, 2015).https://doi.org/10.4103/sni.sni_327_17
3. S. Raj, K. C. Ray, Sparse representation of ecg signals for automated recognition of cardiac arrhythmias. Expert Syst. Appl.105, 49–64 (2018).
https://doi.org/10.1016/j.eswa.2018.03.038
4. D. Ai, J. Yang, Z. Wang, J. Fan, C. Ai, Y. Wang, Fast multi-scale feature fusion for ecg heartbeat classification. EURASIP J. Adv. Signal Process.2015(1), 46 (2015).https://doi.org/10.1186/s13634-015-0231-0
5. H. Sheikhzadeh, R. L. Brennan, S. So, Real-time cardiac arrhythmia detection using wola filterbank analysis of egm signals. EURASIP J. Adv. Signal Process.2007(1), 076256 (2007).https://doi.org/10.1155/2007/ 76256
6. A. Jovic, F. Jovic, Classification of cardiac arrhythmias based on alphabet entropy of heart rate variability time series. Biomed. Signal Process. Control.31, 217–230 (2017).https://doi.org/10.1016/j.bspc.2016.08.010
7. Y. J. Kim, J. Heo, K. S. Park, S. Kim, Proposition of novel classification approach and features for improved real-time arrhythmia monitoring. Comput. Biol. Med.75, 190–202 (2016).https://doi.org/10.1016/j. compbiomed.2016.06.009
8. F. A. Elhaj, N. Salim, A. R. Harris, T. T. Swee, T. Ahmed, Arrhythmia recognition and classification using combined linear and nonlinear features of {ECG} signals. Comput. Methods Prog. Biomed.127, 52–63 (2016).https://doi.org/10.1016/j.cmpb.2015.12.024
9. A. Martínez, R. Alcaraz, J. J. Rieta, Morphological variability of the p-wave for premature envision of paroxysmal atrial fibrillation events. Physiol. Meas.35(1), 1 (2014)
10. A. Petrenas, V. Marozas, A. Sološenko, R. Kubilius, J. Skibarkiene, J. Oster, L. Sörnmo, Electrocardiogram modeling during paroxysmal atrial fibrillation: application to the detection of brief episodes. Physiol. Meas.38(11), 2058 (2017)
11. A. Maan, M. Mansour, J. N. Ruskin, E. K. Heist, Impact of catheter ablation on p-wave parameters on 12-lead electrocardiogram in patients with atrial fibrillation. J. Electrocardiol.47(5), 725–733 (2014).https://doi.org/ 10.1016/j.jelectrocard.2014.04.010
12. I. Romero, J. Penders, C. Kriatselis, P-wave analysis for atrial fibrillation detection in ambulatory recordings. J. Electrocardiol.43(6), 647 (2010).
https://doi.org/10.1016/j.jelectrocard.2010.10.022
13. G. Ganeshapillai, J. Guttag, Real time reconstruction of quasiperiodic multi parameter physiological signals. EURASIP J Adv. Signal Process.2012(1), 173 (2012).https://doi.org/10.1186/1687-6180-2012-173
14. I. Beraza, I. Romero, Comparative study of algorithms for ecg segmentation. Biomed. Signal Process. Control.34, 166–173 (2017).
https://doi.org/10.1016/j.bspc.2017.01.013
15. P. Fonseca, R. M. Aarts, J. Foussier, X. Long, A novel low-complexity post-processing algorithm for precise qrs localization. SpringerPlus.3(1), 376 (2014).https://doi.org/10.1186/2193-1801-3-376
16. H. Khamis, R. Weiss, Y. Xie, C. W. Chang, N. H. Lovell, S. J. Redmond, Qrs detection algorithm for telehealth electrocardiogram recordings. IEEE Trans. Biomed. Eng.63(7), 1377–1388 (2016).https://doi.org/10.1109/ TBME.2016.2549060
17. R. He, K. Wang, Q. Li, Y. Yuan, N. Zhao, Y. Liu, H. Zhang, A novel method for the detection of r-peaks in ecg based on k-nearest neighbors and particle swarm optimization. EURASIP J. Adv. Signal Process.2017(1), 82 (2017).
https://doi.org/10.1186/s13634-017-0519-3
18. A. L. Goldberger, L. A. Amaral, L. Glass, J. M. Hausdorff, P. C. Ivanov, R. G. Mark, J. E. Mietus, G. B. Moody, C.-K. Peng, H. E. Stanley, Physiobank, physiotoolkit, and physionet components of a new research resource for complex physiologic signals. Circulation.101(23), 215–220 (2000) 19. A. L. Goldberger, L. A. N. Amaral, L. Glass, J. M. Hausdorff, P. C. Ivanov, R. G.
Mark, J. E. Mietus, G. B. Moody, C.-K. Peng, H. E. Stanley, Physiobank, physiotoolkit, and physionet. Circulation.101(23), 215–220 (2000).
https://doi.org/10.1161/01.CIR.101.23.e215.http://arxiv.org/abs/http:// circ.ahajournals.org/content/101/23/e215.full.pdf
20. G. B. Moody, R. G. Mark, A new method for detecting atrial fibrillation using R-R intervals. Comput. Cardiol.10, 227–230 (1983)
21. S. K. Berkaya, A. K. Uysal, E. S. Gunal, S. Ergin, S. Gunal, M. B. Gulmezoglu, A survey on ecg analysis. Biomed. Signal Proc. Control.43, 216–235 (2018).
https://doi.org/10.1016/j.bspc.2018.03.003
22. J. A. Queiroz, A. Junior, F. Lucena, A. K. Barros, Diagnostic decision support systems for atrial fibrillation based on a novel electrocardiogram approach. J. Electrocardiol. (2017).https://doi.org/10.1016/j.jelectrocard. 2017.10.014
23. R. J. Martis, U. R. Acharya, C. M. Lim, K. M. Mandana, A. K. Ray, C. Chakraborty, Application of higher order cumulant features for cardiac health diagnosis using ecg signals. Int. J. Neural Syst.23(4), 1350014-1–1350014-19 (2013) 24. R. S. Andersen, A. Peimankar, S. Puthusserypady, A deep learning
approach for real-time detection of atrial fibrillation. Expert Syst. Appl.
115, 465–473 (2019).https://doi.org/10.1016/j.eswa.2018.08.011
25. Y. Xia, N. Wulan, K. Wang, H. Zhang, Detecting atrial fibrillation by deep convolutional neural networks. Comput. Biol. Med.93, 84–92 (2018).
https://doi.org/10.1016/j.compbiomed.2017.12.007
26. A. Kennedy, D. D. Finlay, D. Guldenring, R. R. Bond, K. Moran, J. McLaughlin, Automated detection of atrial fibrillation using r-r intervals and multivariate-based classification. J. Electrocardiol.49(6), 871–876 (2016).https://doi.org/10.1016/j.jelectrocard.2016.07.033
28. X. Zhou, H. Ding, B. Ung, E. Pickwell-MacPherson, Y. Zhang,et al, Automatic online detection of atrial fibrillation based on symbolic dynamics and shannon entropy. Biomed. Eng. Online.13(1), 18 (2014) 29. R. Llinares, J. Igual, Exploiting periodicity to extract the atrial activity in atrial arrhythmias. EURASIP J. Adv. Signal Process.2011(1), 134 (2011).
https://doi.org/10.1186/1687-6180-2011-134
30. M. Masè, M. Disertori, M. Marini, F. Ravelli, Characterization of rate and regularity of ventricular response during atrial tachyarrhythmias. insight on atrial and nodal determinants. Physiol. Meas.38(5), 800 (2017) 31. A. Kennedy, D. D. Finlay, D. Guldenring, R. R. Bond, J. McLaughlin,
Detecting the elusive p-wave: A new ecg lead to improve the recording of atrial activity. IEEE Trans. Biomed. Eng.63(2), 243–249 (2016).https:// doi.org/10.1109/TBME.2015.2450212
32. Y. Huo, F. Holmqvist, J. Carlson, T. Gaspar, G. Hindricks, C. Piorkowski, A. Bollmann, P. G. Platonov, Variability of p-wave morphology predicts the outcome of circumferential pulmonary vein isolation in patients with recurrent atrial fibrillation. J. Electrocardiol.48(2), 218–225 (2015).https:// doi.org/10.1016/j.jelectrocard.2014.11.011
33. V. Vancura, D. Wichterle, M. Brabec, J. Bytešník, K. Lefflerová, J. Kautzner, The relationship between right ventricular pacing voltage and qrs complex duration. Physiol. Meas.30(5), 517 (2009)
34. D. C. Sigg, P. A. Iaizzo, B. He,Cardiac Electrophysiology Methods and Models. (Springer, New York, 2010). ISBN 978-1-4419-6657-5 e-ISBN 978-1-4419-6658-2
https://doi.org/10.1007/978-1-4419-6658-2
35. Q. A. Rahman, L. G. Tereshchenko, M. Kongkatong, T. Abraham, M. R. Abraham, H. Shatkay, Utilizing ecg-based heartbeat classification for hypertrophic cardiomyopathy identification. IEEE Trans. NanoBioscience.
14(5), 505–512 (2015).https://doi.org/10.1109/TNB.2015.2426213
36. S. Lee, D. Park, K. H. Park, Qrs complex detection based on primitive. J. Commun. Netw.19(5), 442–450 (2017).https://doi.org/10.1109/JCN.2017. 000076
37. S. A. Immanuel, A. Sadrieh, M. Baumert, J. P. Couderc, W. Zareba, A. P. Hill, J. I. Vandenberg, T-wave morphology can distinguish healthy controls from lqts patients. Physiol. Meas.37(9), 1456 (2016)
38. A. Vinet, B. Dubé, R. Nadeau, O. Mahiddine, V. Jacquemet, Estimation of the qt-rr relation: trade-off between goodness-of-fit and extrapolation accuracy. Physiol. Meas.38(3), 397 (2017)
39. G. T. Lines, B. L. de Oliveira, O. Skavhaug, M. M. Maleckar, Simple t-wave metrics may better predict early ischemia as compared to st segment. IEEE Trans. Biomed. Eng.64(6), 1305–1309 (2017).https://doi.org/10. 1109/TBME.2016.2600198
40. J. Ramírez, M. Orini, J. D. Tucker, E. Pueyo, P. Laguna, Variability of ventricular repolarization dispersion quantified by time-warping the morphology of the t-waves. IEEE Trans. Biomed. Eng.64(7), 1619–1630 (2017).https://doi.org/10.1109/TBME.2016.2614899
41. B. M. Glover, P. Brugada,Clinical Handbook of Cardiac Electrophysiology. (Springer International Publishing, Brussels, 2016).https://doi.org/10. 1007/978-3-319-40818-7
42. S. Mihandoost, M. C. Amirani, Cyclic spectral analysis of electrocardiogram signals based on garch model. Biomed. Signal Proc. Control.31, 79–88 (2017). ISBN 9783319408187 (online)97833194 08163 (print)https://doi. org/10.1016/j.bspc.2016.07.012
43. J. Orchard, N. Lowres, S. B. Freedman, L. Ladak, W. Lee, N. Zwar, D. Peiris, Y. Kamaladasa, J. Li, L. Neubeck, Screening for atrial fibrillation during influenza vaccinations by primary care nurses using a smartphone electrocardiograph (iecg): A feasibility study. Eur. J. Prev. Cardiol.