Summarization Approaches Based on Document Probability
Distributions
?Sandeep Sripadaa and Jagadeesh Jagarlamudib
a
Computer Science Department, Stanford University, 353 Serra Mall, Stanford CA 94305-9025
School of Computing, University of Utah, 50 S Central Campus Drive 3190, Salt Lake City UT 84112
Abstract. One of the main purposes of a summary is to be able to replace the original doc-ument. We assume that a summary would be able to replace or act as a substitute for the document if its probability distribution is similar to that of the original document. With this hypothesis in mind, we carry out our analysis using datasets from Document Understanding Conference (DUC), studying the results of unigram probability models and also looking at Kullback-Leibler Divergence (KLD) as a measure of ‘closeness’ between probability models of the documents and their summaries. In this paper, we also discuss two summary genera-tion approaches that were designed based on the above hypothesis (a) Summary generagenera-tion by extraction of sentences based on its coverage and (b) Minimum KLD Summary Gener-ation Method (uses a metric for reducing redundancy). Our research shows that the above summarizer, which is light and simple, can deliver good summaries comparable to other state-of-the-art systems.
Keywords: multi-document summarization, frequency, unigram model, KL-Divergence
1 Introduction
With the rapid growth of electronic information services, information is becoming available at an incredible rate. The phenomenon of information overload has meant that access to consistent and correctly-developed summaries is very important. As access to data has increased so has the interest in automatic summarization.
Most current automatic summarization systems use sentence extraction, where key sentences in the input documents are selected to form the summary. Sentence scoring methods utilize both purely statistical and purely semantic features, for example as in (Nenkova et al., 2006; Vander-wende et al., 2006; Yih et al., 2007). Systems that go beyond sentence extraction, reformulating or simplifying the text of the original articles, must decide which sentences should be simplified, compressed, fused together or rewritten (Barzilay and McKeown, 2005; Daum´e III and Marcu, 2005; Jing and McKeown, 2000; Knight and Marcu, 2002; Vanderwende et al., 2004). Common approaches for identifying important sentences to include in the summary include training a bi-nary classifier (Kupiec et al., 1995), training a Markov model (Conroy et al., 2004), or directly assigning weights to sentences based on a variety of features and heuristically determined feature weights (Lin and Hovy, 2002; Schiffman et al., 2002).
In this paper, we show that a very simple approach to multi-document summarization can yield results that are comparable to the best systems. We present two effective and simple fully automatic summary generation techniques which were designed keeping in mind the hypothesis
?Work done at Multilingual Systems group at Microsoft Research Lab, India.
that the summaries would be effective if the summary document models are similar to that of the original documents. Despite the simplicity of the techniques, our results are among the best in multi-document summarization. Our approaches attempt to use subject-independent techniques, based mainly on fast, statistical processing and also explicitly deal with the issue of reducing redundancy.
We compare our results against the SumBasic system (Nenkova et al., 2006; Nenkova and Van-derwende, 2005) and also the system which generates summaries based on maximizing Informa-tive Content-Words (ICW) (Yih et al., 2007). SumBasic is extremely simple, but its performance is within statistical noise of the best system of DUC-2004. SumBasic first computes the probability of each content-word (i.e., verbs, nouns, adjectives and numbers) by simply counting its frequency in the document set. Each sentence is scored as the average of the probabilities of the words in it. The summary is then generated through a simple greedy search algorithm: it iteratively selects the sentence with the highest-scoring content-word, breaking ties by using the average score of the sentences. This continues until the maximum summary length has been reached. In order not to select the same or similar sentence multiple times, SumBasic updates probabilities of the words in the selected sentence by squaring them, modeling the likelihood of a word occurring twice in a summary. The ICW system improves on the SumBasic system in three ways. Firstly, they consider both the frequency and position information in their approach. Secondly, they use a discrimina-tive, machine-learning based algorithm to combine these information sources. Finally, instead of applying the greedy heuristic they proceed by using an optimization technique that searches for the best summary.
We first compare the results of our first approach (which is motivated by the SumBasic system but designed to incorporate our hypothesis) with the above mentioned systems and then show how a simple, light technique can produce summaries that are comparable with the best. We then move on to our second approach (which improves on the first one) and show the difference in the results and also the effectiveness of the algorithm when compared to the latter system described above.
Our paper is organized as follows. Section 2 describes our main hypothesis which forms the basis for our paper. Initial experiments and observations that were conducted are described in Section 3. Our summary generation techniques are outlined in Section 4. We present our results on summarization in Section 5. We conclude and discuss future work in Section 6.
2 Hypothesis
As mentioned earlier, one of the main purposes of a summary is to replace the original document. We assume that a summary would be able to replace or act as substitute for the document if its model is closer to the document.
Summary Model≈Document Model
Based on this hypothesis, we proceed by looking at the models which can be used to represent the document and also the measure that can be used to find the ‘closeness’ between the probability distributions. Since N-gram models are widely used to represent documents and summaries, we started by looking at unigram models to conduct our experiments. Also we used KL-Divergence as it is widely accepted and used to measure closeness between two probability distributions.
3 Initial Study
In the field of Statistics and Information theory, one of the methods used to establish the similarity between two probability distributions is Kullback-Leibler Divergence.
distribution Q. It is a measure between the unigram probability distributions learned from seen document setp(w/R)and new document setq(w/N).
DKL(PkQ) = X
i∈w
P(i) logP(i)
Q(i) (1)
The words considered to calculate KL divergence are the ones that are present in both the document sets. Since this measure is asymmetric,
DKL(PkQ)6=DKL(QkP) (2)
we considered a slight modification and calculated
KL(PkQ) +KL(QkP)
2 (3)
Using the above measure, we performed the experiments on a set of 35 systems from DUC 2004 (50 topics) to see how the measure correlates with the ROUGE scores. The above described measure was calculated between the unigram distributions of the documents and their summaries along with the ROUGE scores for all the summaries (ROUGE-1.5.5 was used). The resulting correlation values were: ROUGE-1 and KLD = 0.66, ROUGE-2 and KLD = 0.58, ROUGE-SU4 and KLD = 0.61. Taking these correlation values, we moved on to generate summaries using the hypothesis that might get better ROUGE scores. The next section presents the summarization techniques that were designed based on our hypothesis as mentioned in Section 2.
4 Generation Techniques
4.1 Description
This section describes the algorithms that have been developed to produce summaries based on the above mentioned hypothesis. The two generation techniques are:
• Extraction of sentences based on its coverage - depending on the document distribution. • Minimum KLD Summary Generation method.
4.1.1 Extraction of sentences based on its coverage: This algorithm generates summaries by extracting sentences based on the idea of the coverage of words. We consider the unigram model to represent the documents. Initially, the word probabilities of the input document are calculated by taking the unigram frequencies of the input document and normalized by the total number of words in the document. Once the word probabilities are calculated, we move on to calculate the estimated number of times each word should occur in the summary to make the probability distribution as close as possible (which is our main hypothesis). Now the frequencies of the constituent summary words are generated by taking the word probabilities and multiplying them by the length of the required summary.
Letp1, p2, p3. . . pn be the probabilities of the ‘n’ words in the document and let ‘N’ be the number of words that a summary should contain. Now, the number of times the words should occur (expected frequency) in a ‘N’ word summary is given byN∗p1, N∗p2, N∗p3. . . N∗pn. After this, our focus is to select ‘units’ from the document that satisfy the above condition. These ‘units’ could be either paragraphs, words, sentences or even phrases. The ‘unit’ that we considered to manage the text in the document is a sentence. So our focus now is to select a sentence that would satisfy the above constraint.
that we can make use of is ‘FREQUENCY’ (Nenkova et al., 2006). In order to use the aforemen-tioned attribute, the algorithm that we designed includes a metric called spanthat is defined as the number of words that are above the upper threshold (in terms of the frequency of occurrence) to the total of words in the particular ‘unit’, which here is a sentence. The threshold here acts as a barrier for the low-frequency words from being included inspan. If the threshold is high, the number of words considered in the calculation of spanwhose frequency is high would be low thereby reducing the effectiveness of the measure. On the other hand, if the threshold is low, the number of words considered in the calculation ofspanis higher again reducing the effectiveness (as low-frequency words might be included). So the threshold needs to be set based on empirical analysis.
span(u) =|Wt|/|W| (4)
where |Wt|: The number of words above a threshold, |W|: The number of words in the unit,
span(u): ‘Span’ of the unit.
This gives a very basic ranking mechanism among the participant sentences(units) as this mea-sure only gives an indication of the build of the sentence, i.e. a higher value ofspanimplies that the sentence is made of words that are ‘important’ or most frequent as per our estimated word oc-currence frequency. Even though this gives us a good classification, this measure alone cannot be taken as the deciding factor as there is more information that can be utilized. This can be improved by taking into consideration the individual frequencies of the words above the frequency threshold. To include this observation, thespanof a sentence is multiplied by the coverage of the sentence, which is defined as the sum of the frequencies of the sentence constituents (words). Multiplying it with the weight of the sentence makes sure that it selects sentences that are comprised of the words which are among the most frequent in the document along with containing most number of such words.
N etweight(u) =span(u)∗X w∈u
f(w) (5)
wheref(w): frequency of the constituent word,span(u): ‘Span’ of the unit as calculated above. The sentences are sorted based on theN etweightscore and the sentence that scores the maxi-mum is selected. This procedure is repeated till the length of the summary is reached.
Another important part that needs to be handled is redundancy. Eliminating redundancy im-proves the quality of the summary by including content intelligently. This is handled by reducing the frequency of the word occurrences by the number of times it has occurred in the selected sen-tence. With the updated probabilities taken into consideration, this method would help in building a summary that satisfies our basic hypothesis. As a word reaches its projected frequency in the generated summary, negative weight would be associated with it that would reduce theN etweight
measure thereby decreasing the chances of it being selected. Here is an overview of the algorithm:
• Calculate the unigram probabilities of the input (source) • Obtain word-frequencies of the input.
• Calculatespanfor all sentences.
• Calculate the effectivecoverageand then theN etweight.
• Sort the sentences based on the obtained value and select the maximum scoring sentence. • Update the frequencies to handle redundancy.
The algorithm which is very light and simple performs well as shown below in Section 5 of the paper. The results give us an indication that our hypothesis which tries to bring the summary as close as possible to the document in terms of the model might prove to be an effective approach. This algorithm can by itself compete with some of the best systems in the summarization task as shown in the results. The results are comparable to the system described in (Yih et al., 2007) and also to most of the systems in DUC 2004.
The above algorithm can be improved by looking at the way in which the sentences are picked. A greedy approach is employed by the above iterative algorithm selecting the best scoring sen-tence. Although some consideration is given to the prior sentences selected, it does not fully take advantage of the information that is passed on by the already selected sentences which can be used to generate a summary that is ‘closer’ to the original document. An improved algorithm that was designed to overcome to the non-optimal solution problem uses the stack decoder algorithm as a template and builds on it to produce summaries that are closer to the optimal.
4.1.2 Minimum KLD Summary Generation method: To generate summaries for a topic hav-ing low KLD values, we use the Stack Decoder Algorithm. This algorithm can test multiple summary lengths and as a result it is in a position to give a global optimal.
One innovative aspect of our system is that we have moved from an algorithmic description to a scoring description: potential summaries are given an overall score based on the scores of the included content units, and the goal is to find the summary with the best overall score i.e. minimum KLD.
The iterative algorithms previously mentioned (SumBasic and Coverage based) use the greedy approach which might not produce the best summary as per the constraints. So, we developed a more complex algorithm that could explicitly search for the best combination of sentences. Our algorithm is based on a stack decoder (Jelinek, 1969). One typical problem of stack decoders is that they have trouble comparing hypotheses of different lengths. Although it is sometimes solved with an A* search (Paul, 1991), this requires finding an admissible cost function, which does not always exist. Instead of using an A* search, we chose to use multiple stacks, with each stack representing hypotheses of different lengths (Magerman, 1994).
Our summary generation technique takes as input the set of all sentences from the input docu-ment, as well as the scores used to weight the sentences. The score here is nothing but the KLD value of the sentence with respect to the document. The method usesmaxlengthstacks: one for each length, up to the maximum length of the summary. Each stack contains the best summaries so far, of exactly that length. (The last stack,stack[maxlength], may contain summaries longer than
maxlengthbut the summaries below the summary length are only taken as part of the scoring). There will be at most stacksize different hypotheses on any given stack. The algorithm proceeds by examining a particular stack. It looks at every solution on that stack (a solution is a set of sen-tences). It then tries to extend that solution with every sentence from the document cluster. These extensions are then placed on the stack of the appropriate length. In order to avoid an exponential blowup in the number of solutions on any given stack, we use a priority queue, and only keep the top stacksize highest scoring solutions on any given stack.
Observe that if we do not consider redundancy and if we did not truncate the very last sentence as part of the scoring procedure, then this problem would be equivalent to the Knapsack Problem. Without the no-duplication limitation, and when using a stack size of 1, the algorithm devolves to the standard exact solution using dynamic programming for the Knapsack Problem.
Some of the important points to note in this algorithm are:
• The sentences below a min-sentence length are not considered.
certain value. The inclusion of the above feature helps in countering redundancy and also in dealing with the case where another sentence is comprised of the same words.
• The number of solutions maintained in the priority queue is restrained, as described above, to counter exponential blowup.
Algorithm: Initially, all the sentences are placed at their respective length positions along with the (score, id) pair in a priority queue, that has stacksize number of solutions.
for i = 0 to maxlength-1 do for all sol in Stack[i] do
for all s in Sentences do
newlen = min(i+length(s),maxlength) if cosine similarity < threshold
newsol = sol U {s} else
next
score = score(KLD) of newsol w.r.t the document Insert newsol, score into queue stack[newlen] end for
end for end for
Return best solution in stack[maxlength]
(Best solution here is the global minimum of the KLD value among all the solutions.)
5 Experiments
We conducted the experiments on the topics taken from DUC2004. In the multi-document sum-marization task in DUC-2004, participants are given 50 document clusters, where each cluster has 10 news articles discussing the same topic, and are asked to generate summaries of at most 100 words for each cluster. The above described measures were calculated between the unigram dis-tributions of the documents and the summaries. After evaluating the above measures, the ROUGE scores i.e. ROUGE-1, ROUGE-2, ROUGE-SU4 were calculated for all the summaries.
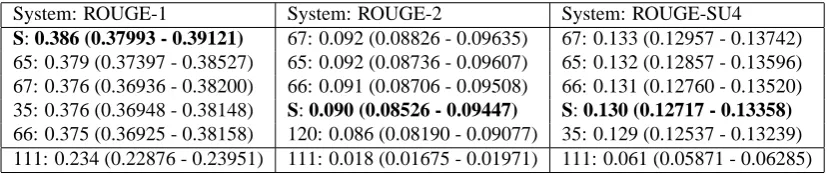
Table 1: DUC-04: ROUGE scores and 95% conf. intervals (S - Stack based system) System: ROUGE-1 System: ROUGE-2 System: ROUGE-SU4 S: 0.386 (0.37993 - 0.39121) 67: 0.092 (0.08826 - 0.09635) 67: 0.133 (0.12957 - 0.13742) 65: 0.379 (0.37397 - 0.38527) 65: 0.092 (0.08736 - 0.09607) 65: 0.132 (0.12857 - 0.13596) 67: 0.376 (0.36936 - 0.38200) 66: 0.091 (0.08706 - 0.09508) 66: 0.131 (0.12760 - 0.13520) 35: 0.376 (0.36948 - 0.38148) S: 0.090 (0.08526 - 0.09447) S: 0.130 (0.12717 - 0.13358) 66: 0.375 (0.36925 - 0.38158) 120: 0.086 (0.08190 - 0.09077) 35: 0.129 (0.12537 - 0.13239) 111: 0.234 (0.22876 - 0.23951) 111: 0.018 (0.01675 - 0.01971) 111: 0.061 (0.05871 - 0.06285)
In Table 1, we display the scores of the stack based algorithm on DUC 2004 data and in Table 2, we display the scores of our coverage based system on DUC 2004 data. Top 5 systems in each category are shown along with the bottom system to show the difference our system achieves using the hypothesis. The important thing to observe is that the 95% confidence intervals signify that the results are within the statistical noise of the best systems. The values of the parameters involved in the algorithms are as follows: Stack: Min-Sentence-length = 6, Cosine-Similarity-cutoff = 0.7, Stacksize = 30 and Coverage: Threshold = 0.4 (obtained empirically, no familiarity with test data).
Table 2: DUC-04: ROUGE scores and 95% conf. intervals (C - Coverage algorithm based system) System: ROUGE-1 System: ROUGE-2 System: ROUGE-SU4 65: 0.379 (0.37397 - 0.38527) 67: 0.092 (0.08826 - 0.09635) 67: 0.133 (0.12957 - 0.13742) C: 0.376 (0.36981 - 0.38235) 65: 0.092 (0.08736 - 0.09607) 65: 0.132 (0.12857 - 0.13596) 67: 0.376 (0.36936 - 0.38200) 66: 0.091 (0.08706 - 0.09508) 66: 0.131 (0.12760 - 0.13520) 35: 0.376 (0.36948 - 0.38148) C: 0.086 (0.08199 - 0.09060) 35: 0.129 (0.12537 - 0.13239) 66: 0.375 (0.36925 - 0.38158) 120: 0.086 (0.08190 - 0.09077) C: 0.129 (0.12528 - 0.13269) 111: 0.234 (0.22876 - 0.23951) 111: 0.018 (0.01675 - 0.01971) 111: 0.061 (0.05871 - 0.06285)
the baseline system (greedyline) in DUC-2004. Greedyline simply takes the first 100 words of the most recent news article in the document cluster as the summary. For the evaluation, we use the ROUGE-2 (bigram overlap) metric. In addition, we also report the performance on ROUGE-1 (which has been shown to correlate well with human judgments (Lin, 2004; Lin and Hovy, 2003) and which was found to have one of the best correlations with human judgments on the DUC-2004 data (Over and Yen, 2004)) and ROUGE-SU4 (skip bigram) metrics.1
Table 3: DUC-04: ROUGE-1, ROUGE-2 and ROUGE-SU4 scores (*: stemmed, stop-words removed) System R-1 R-2 R-SU4
peer 65 0.379 0.091 0.132
S(stack) 0.386 0.090 0.131
C(coverage) 0.376 0.086 0.129 content -train 0.327* 0.086 0.129 sum 0.283* 0.079 0.122 greedyline 0.202* 0.061 0.099
In Table 3, the content systems use the Maximizing Informative Content-Words method (Yih et
al., 2007) and sum systems use SumBasic’s iterative algorithm. Also, discriminative training in content systems is represented by -train. The systems S(stack) and C(coverage) use the above
mentioned hypothesis with S(stack) using the optimized search method using the stack decoder and C(coverage) using the coverage based method.
Table 4 presents a sample summary that is generated for topic 31 of DUC 2004 data set by following the stack and coverage based algorithms. The table also contains the oracle summary for that topic.
6 Conclusions and Future Research
Our results are among the best reported on the DUC 2004 summarization tasks. Our approaches perform well in the ROUGE scores and is better than most systems in the 2 and ROUGE-SU4 category. The system is among the best scores in ROUGE-1, ROUGE-2 and ROUGE-ROUGE-SU4. Since the ROUGE-1 scores could not be compared (stop-words and stemming settings are differ-ent), the table above shows that we have performed well in that section as well when compared to other systems scored using the same environment. We have achieved these results using a system that is less complex, lightweight than the previous systems.
We achieved these results based on our hypothesis that the summaries perform well when their model is closer to that of the original document. The above results help us to show that our hypothesis might seem to be valid and that using the document model as a reference and generating
1
Table 4: Sample summary: DUC 2004, Topic 31 (Oracle summary, summaries generated by Stack and Coverage based method are shown)
ORACLE: Once completed, the 16-nation space station will have a mass of 1 million pounds, be longer than a football field, and house up to seven astronauts and cosmonauts. Endeavour and its astronauts closed in Sunday to capture the first piece of the international space station, the Russian-made Zarya control module that had to be connected to the Unity chamber aboard the shuttle. A last-minute alarm forced NASA to halt Thursday’s launching of the space shuttle Endeavour, on a mission to start assembling the international space station. The 36-foot, 25,000-pound Unity will serve as a connecting passageway, or vestibule, for future modules.
STACK: In all, three spacewalks were planned for Endeavour’s 12-day flight. The astronauts will use the shuttle robot arm to capture the Russian space station piece and attach it to Unity. The 36-foot, 25,000-pound Unity, the first American-made component, will serve as a connecting passageway, or vestibule, for future modules. A last-minute alarm forced NASA to halt Thursday’s launching of the space shuttle Endeavour, on a mission to start assembling the international space station. The antennas must be fully deployed in order for Zarya’s manual docking system to work; that system won’t be needed before next summer, officials said.
COVERAGE: Endeavour and its astronauts closed in Sunday to capture the first piece of the international space station, the Russian-made Zarya control module that had to be connected to the Unity chamber aboard the shuttle. NASA has only five minutes or less each day to launch Endeavour in order to meet up with the first space station part, which was put in orbit two weeks ago by the Russians. The astronauts will use the shuttle robot arm to capture the Russian space station piece and attach it to Unity.
summaries to be ‘close’ to the model might prove to be useful. We also described a simple search procedure using a stack decoder that can find the best sentences to form a summary, given the scores. In contrast to more common approaches using heuristic or greedy methods, such as the iterative algorithm of SumBasic, the explicit search method is not only more principled and with a clear objective function, but also better empirically.
As for future research we would like to look at how various other measures like JSD perform and also to have a look as to how using minimum KLD as a feature would perform. We considered the unigram model for documents but we would like to test the effect of various other models like Bigram, N-grams on the scores. We would like to work upon the readability of the summaries and also on how positional information might help in improving the scores.
References
Barzilay, R. and K. McKeown. 2005. Sentence fusion for multidocument news summarization.
Computational Linguistics, 31(3), 2005.
Conroy, J., J. Schlesinger, J. Goldstein and D. O’Leary. 2004. Left-brain/right-brain multi-document summarization. Proceedings of the 4th Document Understanding Conference (DUC’04).
Daum´e III, H. and D. Marcu. 2005. Bayesian multi-document summarization at mse.
Proceed-ings of the Workshop on Multilingual Summarization Evaluation (MSE), Ann Arbor, MI.
Jelinek, F. 1969. Fast sequential decoding algorithm using a stack. IBM Journal of Research and
Development.
Jing, H. and K. McKeown. 2000. Cut and paste based text summarization. Proceedings of the 1st
Conference of the North American Chapter of the Association for Computational Linguistics (NAACL’00).
Kupiec, J., J. Perersen and F. Chen. 1995. A trainable document summarizer. Research and
Development in Information Retrieval, pages 68-73, 1995.
Lin, C.-Y. 2004. ROUGE: a package for automatic evaluation of summaries. Proceedings of the
Workshop in Text Summarization, ACL 2004.
Lin, C.-Y. and E. Hovy. 2003. Automatic evaluation of summaries using n-gram co-occurrence statistics. Proceedings of HLT-NAACL.
Lin, C.-Y. and E. Hovy. 2002. Automated multi-document summarization in neats. Proceedings
of the Human Language Technology Conference (HLT2002).
Magerman, D. 1994. Natural Language Parsing as Statistical Pattern Recognition. PhD thesis, Stanford University.
Nenkova, A., L. Vanderwende and K. McKeown. 2006. A compositional context sensitive multi-document summarizer: exploring the factors that influence summarization. SIGIR, pages 573-580. ACM.
Nenkova, A. and L. Vanderwende. 2005. The impact of frequency on summarization. Technical
report, MSR-TR-2005-101.
Over, P. and J. Yen. 2004. An introduction to DUC 2004 intrinsic evaluation of generic news text summarization systems. Proceedings of DUC.
Paul, D. 1991. An efficient A* stack decoder algorithm for continuous speech recognition with a stochastic language model. ICASSP.
Schiffman, B., A. Nenkova and K. McKeown. 2002. Experiments in multidocument summariza-tion. Proceedings of the Human Language Technology Conference.
Vanderwende, L., H. Suzuki and C. Brockett. 2006. Microsoft research at DUC2006: Task-focused summarization with sentence simplification. DUC 2006: Document Understanding
Workshop, Brooklyn, NY, USA.
Vanderwende, L., M. Banko and A. Menezes. 2004. Event-centric summary generation. In
Proceedings of the Document Understanding Conference (DUC’04).
Yih, W.H., J. Goodman, L. Vanderwende and H. Suzuki. 2007. Multi-document summarization by maximizing informative content words. IJCAI 2007: 20th International Joint Conference