Monitoring of Temperature and Humidity of
Remote Place using Cloud Computing
Mohd.Sadim
1, Dr. R. K.Sharma
2Research Scholar, Department of Computer Science and Engineering, AFSET, Faridabad, India1
Assistant Professor, Department of Computer Science and Engineering, FET, Agra College, Agra, India2
ABSTRACT: To evaluate new products and techniques in this digital era, climate change which highly effects the properties of electronic and computer devices, needs to be taken into consideration during long- and short-term testing. For a research facility, a measurement system for temperature and relative humidity (RH) values has been developed for testing purpose. The system consists of temperature and humidity sensors, placed at remote location, and a data acquisition system (DAQ) is developed using Arduino Microcontroller. Data from the temperature and humidity sensors is acquired continuously and stored into a cloud-based service which provides fast and easy access to the logged climate data.
KEYWORDS: Humidity, Temperature, Cloud Network, Arduino Microcontroller, DHT11, ESP8366
I. INTRODUCTION
The next wave of digital in the era of computing will be more advanced when compared with traditional system. In the perception of Internet computing one can be aware of that it is connecting the objects that surround us will be on the network in one form or another sensor network technologies will escalate to meet the new challenges, in which information and communication systems are imperceptibly embedded in the environment around us. Linking the embedded devices to internet is fruition as it plays a dual role for both hardware as well as in software technology where the duo logy hold the key role and formulate us to call the things which are linked to internet. For better deployment and making things more interactive makes the system objective as main achievement in Internet Computing where data from the devices acts as fuel to these technologies on software side. So when we talked about the data these embedded devices either offline or online generates the data, so generating the data offline is of no use in Internet Computing level so the technical stuff behind the hardware and software should sync one another in order to produce the efficient model. When this results in the generation of huge amounts of data which have to be stored, presented and processed in a flawless, efficient, and easily sizeable form. The cloud computing model will consist of services that are commodities and delivered in a manner similar to traditional commodities. Cloud computing can provide the virtual infrastructure for such efficacy computing which integrates monitoring devices, storage devices, analytics tools, visualization platforms and client delivery. The cost based model that Cloud computing presents will enable end-to- end service provisioning for businesses and users to access data on demand from anywhere. So connecting the embedded devices to the internet with respect to cloud have a significant effect to send the data to any cloud server and monitoring the real time data from anywhere via cloud computing. The main aim of this paper to monitoring the temperature and humidity of rmote place using the cloud computing, and also understand how to integrate the embedded device to the cloud to upload the temperature and humidity data wirelessly.
AIM:
low cost Wi-Fi module chip, connect it to Arduino microcontroller board via a UART serial connection and build our own code for the Wi-Fi communication & remote interface.
II. PROPOSED SYSTEM
Our proposed system has extension in its concepts in a successful way, this is an smart thing of our system. To encourage the sensor network for cloud based data storage service, we decided to work on the design a specific system using Arduino Uno board and example of sending data of real time humidity and temperature over thingspeak.com cloud and monitoring it over Internet. The existing real time systems monitor the parameters with less accuracy due to the improper time interval between the updation of sensed value of temperature & humidity using DHT11. So we are mainly focused on this limitation of the existing systems & by selecting proper time interval between the updation of sensed value of parameters using DHT11 and ESP8366 Wi-Fi chip in our proposed system is more accurate than the existing systems.
Required Tools:
Temperature and Humidity Sensor (DHT11) Embedded board (Arduino Uno Board)
Wi-Fi Module (for wireless/internet Transmitter and Receiver) Thingspeak Cloud Services
III. SYSTEM ARCHITECTURE
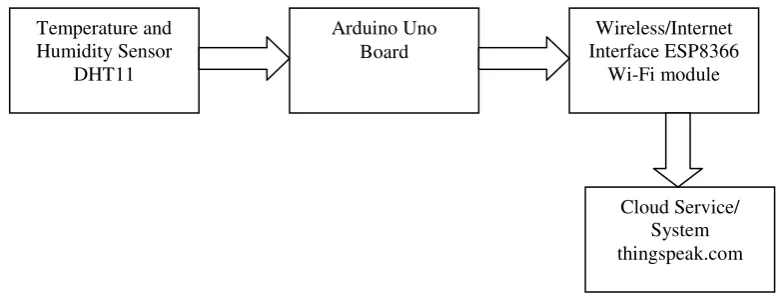
The system model block diagram consists of Arduino Uno Board , Cloud system, sensing circuit, wireless/Internet Interface. The main purpose of our proposed system is to design a Embedded based circuit which can monitor humidity & temperature continuously on cloud using wirelessly. The connectivity between the various above components of system is shown in fig 1.
Figure 1 Block Diagram of Our Proposed System
Block diagram includes Arduino Microcontroller on board, Humidity and temperature circuitry (DHT11) and Internet connecting Port for Arduino board. Continuous signals can be given to the microcontroller through the analog terminal which can convert into the digital signal and processed to send through internet in to the packet format. The processed data will be sent to cloud server using web access through Wi-Fi Module ESP8366. It requires ANSI C programming. It can intimate irrelevant data or uncontrolled data through cloud to particular person in case of disaster management who is going to access public data.
Temperature and Humidity Sensor
DHT11
Arduino Uno Board
Wireless/Internet Interface ESP8366
Wi-Fi module
Hardware description: A. Sensing Circuit:
DHT11:
DHT11 digital humidity & temperature Sensor is calibrated with a digital signal output. It can ensure high reliability and excellent long-term stability by using the exclusive digital-signal acquisition technique and humidity & temperature sensing technology. DHT11 incorporates a humidity measurement component which is resistive type and a negative temperature coefficient temperature measurement component. When connected to an excellent quality 8- bit microcontroller, shows quick response, non-interference ability. The whole setup is economical. DHT11 sensors are very carefully calibrated in lab. These sensors are very precise on humidity calibration. The calibration coefficients are saved in the onetime programmable memory as programmed. These coefficients are used by the DHT11’s internal signal while calculating humidity and temperature. The single-wire serial interface makes framework joining fast and simple. DHT11 works on a very low power, its size is very small and can transmit signal up-to- 20 meter, because of these features DHT11 can be used for various applications.[16]
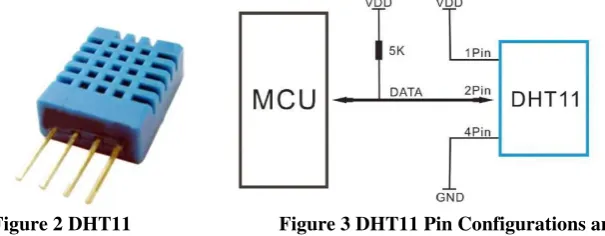
DHT11 is shown in figure 2. Its specifications are Humidity range – 20% RH to 90%RH with an accuracy of ±5% RH and resolution of 16 bit. Temperature range – 0 -50 with an accuracy of ±2 with a resolution of 16 bit.
In DHT11 Pin 1 is power supply pin. Power supply can vary from 3-5.5V DC. When the sensor is powered, no instructions should be given to the sensor up to one second so as to pass the unstable status. A capacitor of 50nF can be connected for power filtering purposes (between VDD and GND). Pin 2 of DHT11 is a data pin. One communication process lasts till 4ms.
Figure 2 DHT11 Figure 3 DHT11 Pin Configurations and Connection
A complete data transmission is of 5 byte. The data has decimal and integral parts. Data format is, 1byte integral humidity data + 1 byte integral temperature data +1 byte decimal humidity data + 1 byte decimal temperature data + 1 byte check sum. The transmitted data can be checked by adding the first four byte i.e be sum of "1 byte integral humidity data ,1byte integral temperature data, 1 byte decimal humidity data ,1 byte decimal temperature data", this should be equal to the last byte i.e check sum byte, if not equal then the transmitted data is wrong.
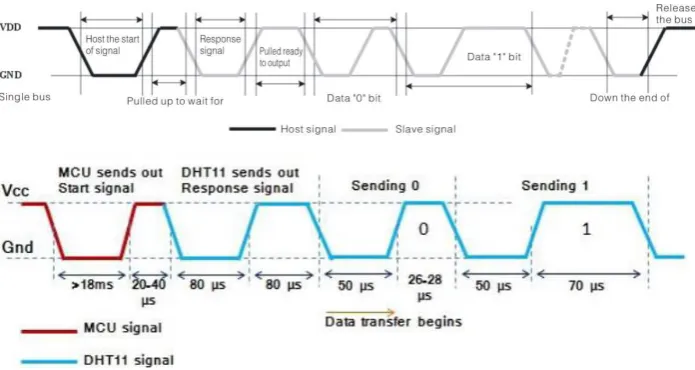
At first the microcontroller unit gives a start signal, then the mode of DHT11 changes to the running-mode from the low-power-consumption mode. And then DHT11waits for microcontroller unit for the completion of the start signal. DHT11 gives a response signal of 5 byte data after its completion. This includes the temperature and relative humidity information to MCU. When the communication between MCU and DHT11 starts, the data bus voltage level is set from high to low by program in the microcontroller and the data bus is kept low for at least 18ms to ensure that DHT11 has detected MCU's signal, then MCU pulls up voltage and waits 20-40us for DHT’s response. Once DHT identifies the start signal, it transmits a low-voltage-level response signal, which lasts up to 80us, followed by a high voltage-level response signal which also lasts up to 80us.This is for DHT11’s preparation for transmitting data. The data format of DHT11 for simplified single bus communication is as follows:
Single bus to transfer data defined
Data Format: The 8 bit humidity integer data+ 8 bit humidity decimal data+ 8 bit temperature integer data+ 8 bit fractional temperature data+ 8 bit parity bit.
Parity bit data definition: “8 bit humidity integer data+ 8 bit humidity decimal data+ 8 bit temperature integer data+ 8 bit fractional temperature data” 8bit checksum is equal to the results of the last eight.
For example: Say 40 bit data is received
𝐻𝑖𝑔ℎ ℎ 𝑚𝑖 𝑖 𝑦 8
𝐿 𝑤 ℎ 𝑚𝑖 𝑖 𝑦 8
𝐻𝑖𝑔ℎ 𝑚 𝑟 𝑟 8
𝐿 𝑤 𝑚 𝑟 𝑟 8
𝑃 𝑟𝑖 𝑦 𝑖
+ + + =
Received data is correct as parity bit and sum of humidity and temperature data is equal so we can say data can be cross checked with help of parity bit at the end of receiver. In above example the value of humidity and temperature is as follows:
Value of humidity = = 𝐻 = % 𝑅𝐻 and, Value of temperature = = 8 𝐻 = ℃.
If we say same data and parity bit is different than we have to give up the data and re-receive data from DHT11. User host (MCU) to send a signal, DHT11 converted from low-power mode to high-speed mode, until the host began to signal the end of the DHT11 send a response signal to send 40bit data, and trigger a letter collection. The signal is sent as shown.
Figure 4 DHT11 data transmission
Note: The host reads the temperature and humidity data from DHT11 always the last measured value, such as twice the measured interval of time is very long, continuous read twice to the second value of real-time temperature and humidity values. When the sensor is transmits information to microcontroller, each bit of the data starts with the 50us low-voltage-level followed by a high voltage level. If the duration is 70us then the data bit is ‘1’ or if the duration is 26-28us then the data bit is ‘0’.
ARDUINO UNO:
Power supply to Arduino can be given through USB connection or from an external power supply. External power can come either from an AC-to-DC adapter (2.1mm center-positive plug) or from a battery. Leads from a battery can be inserted in the Gnd and Vin pin headers of the power connector.
Arduino board operates on an external supply of 6 to 20 volts. If it is supplied with a voltage less than 7V then the 5V pin may supply less than 5V and the board may become unstable. If it is supplied with a voltage more than 12V, then the board gets damaged due overheating of voltage regulator. Thus 7 to 12 volts is recommended range.
The ATmega328 has 32 KB of Flash memory. It also has 2 KB of SRAM and 1 KB of EEPROM The 14 digital pins on the board can be used as an input or output. These pins operate at 5 volts . The DC current per input/output pin is about40 mA and the pins have an internal pull-up resistor of 20-50 kOhms.
Figure 5ARDUINO UNO Board Figure 6 ESP8266 Wi-Fi Pin-out Top Vie
The board has 14 digital input/output pins out of which 6 provide PWM output(pin 3, pin5, pin6 ,pin 9, pin10and pin 11). The DC current for 3.3V pin is about 50 mA.
The Arduino board has 6 analog inputs, each of which provides 10 bits of resolution or 1024 different values. By default they measure from ground to 5 volts. Its clock speed is about 16MHz.
ESP8366:
ESP8266 is an impressive, low cost Wi-Fi module suitable for adding WiFi functionality to an existing microcontroller project via a UART serial connection. The module can even be reprogrammed to act as a standalone Wi-Fi connected device–just add power! The feature list is impressive and includes:
1. 802.11 b/g/n protocol 2. Wi-Fi Direct (P2P),
3. soft-AP Integrated TCP/IP protocol stack
The hardware connections required to connect to the ESP8266 module are fairly straight-forward but there are a couple of important items to note related to power:
1. The ESP8266 requires 3.3V power–do not power it with 5 volts!
2. The ESP8266 needs to communicate via serial at 3.3V and does not have 5V tolerant inputs, so you need level conversion to communicate with a 5V microcontroller like most Arduinos use.
Here are the connections available on the ESP8266 Wi-Fi module:
When power is applied to the module you should see the red power light turn on and the blue serial indicator light flicker briefly. Here are the connections required to enable communication with the module over serial in this configuration:
With the hardware connections in place you can communicate with the WiFi module through a serial terminal.
Using Arduino IDE Serial Monitor 1. Plug in the WiFi module.
3. Open the Serial Monitor via the Tools menu or “magnifying glass” icon on the editor window.
4. For the default firmware version (00160901), ensure Carriage return is selected in the line ending pop-up menu at the bottom of the serial monitor. (For later versions it must be set to Both NL & CR .)
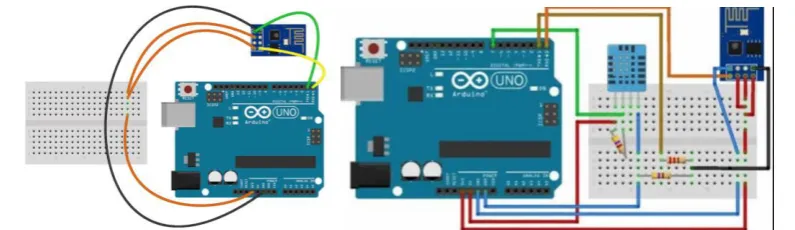
Figure 7 Layout of connection of Wi-Fi Module Figure 8 Hardware layout of DHT11 and Wi-Fi module
ESP8266
5. For the default firmware version, ensure the communication speed is set to 115200 baud . (For later versions or if it has been modified it will need to be 9600 baud or similar.)
The Arduino Uno can be programmed with the Arduino software.
Protocols:
This is one of the main part for sending the data we use HTTP protocol to send to cloud data store where the default data from Arduino which will be sent is string data after that when app engine consume the data from Arduino it will convert into required data type so main thing to be considered is pushing the data using internet communication by using HTT protocol. MQTT: The MQ Telemetry Transport (MQTT) protocol is a lightweight publish/subscribe
protocol flowing over TCP/IP for remote sensors and control devices through low bandwidth, unreliable or intermittent communications. This protocol is developed by IBM and presently they are using it in Ibm blue-mix IOT foundation. This protocol is very light weight protocol where there will publisher and subscriber and broker which acts as a middleware. With respect to the above protocols the Arduino uno board will be able to send the data to any server specified URL. In case of MQTT we need use port with respect to URL also.
CLOUD SYSTEM:
Cloud computing has become the rapidly growing area in industry today with the advancements in the field of science and technology. Cloud computing by using the resources, information, software and shared equipment provides a client’s service within a specific time. Cloud computing is a way to increase the capacity or add capabilities dynamically without investing in new infrastructure, training new personnel, or licensing new software. It extends Information Technology’s (IT) existing capabilities. There are cloud service providers who provide large scale computing infrastructures as services in which the users can use it according to their requirements. In present day scenario of the network cascaded with task consummation, and the aspect of heterogeneity along with platform divergence, dynamic load balancing plays a vital role in optimizing the performance of the server in the cloud computing environment [12].
SYSTEM IMPLEMENTATION
:
1) The data pins of the four sensors are connected to four analog inputs of Aruino board . Sensor 1 to port A5, sensor 2 to port A4, sensor 3 to port A3 and sensor 4 to port A2.
2) An Arduino SD card Shield is connected to the board.
3) Wi-Fi module is connected to Arduino through digital pins 2 to 5, DB7 pin to digital pin 2 , DB6 pin to digital pin 3 , DB 5 pin to digital pin 4, DB4 pin to digital pin 5.
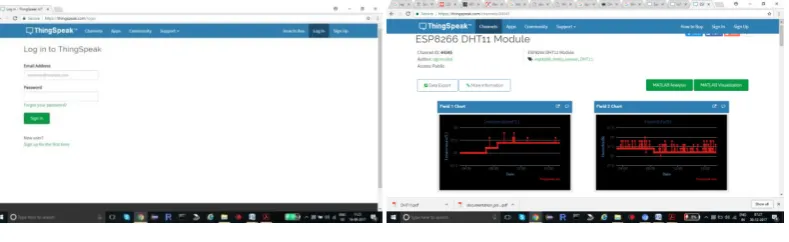
Thingspeak.com cloud is to be used for data storage of temperature and humidity which we send through ESP8366 with the help of internet. So first we need to create an account, which is free for public use it provide different channels to upload you data. The comma separated value (.csv) file is automatically generated at the end of server which is downloadable and can be open in Microsoft Excel.
Figure 9 screenshot of login to thingspeak.com Figure 10 screenshot of after login to thingspeak.com cloud
After login to my account the next screen will appear in which the channel shows the temperature and humidity graphical representation.
Send Data to ThingSpeak with Arduino
Getting Started
In order to send data to ThingSpeak™ using an Arduino®
, you need an Arduino with network connectivity either onboard or with a shield. We have an official library for ThingSpeak and we require Arduino 1.6.x or above running on Windows®, MAC OS X®, and Linux®. This library needs to be installed and used by the Arduino device in order to send data to ThingSpeak using one of our examples.
Setup ThingSpeak
ThingSpeak requires a user account and a channel. A channel is where you send data and where ThingSpeak stores data. Each channel has up to 8 data fields, location fields, and a status field. You can send data every 15 seconds to ThingSpeak, but most applications work well every minute.
1. Sign up for new User Account– https://thingspeak.com/users/sign_up
2. Create a new Channel by selecting Channels, My Channels, and then New Channel 3. Note the Write API Key and Channel ID
Full REST Interface API information for ThingSpeak is available in the documentation. Install ThingSpeak
Communication Library for Arduino In theArduino IDE, choose Sketch/Include Library/Manage Libraries. Click the ThingSpeak Library from the list, and click the Install button
Setup Arduino Sketch
We have provided a few Arduino sketch examples with the ThingSpeak library. They are designed to work right away with no changes. To make the examples work with your ThingSpeak channel, you will need to configure.
The myChannelNumber and myWriteAPIKey variables. [cce]unsigned long myChannelNumber = 31461;
const char * myWriteAPIKey = “LD79EOAAWRVYF04Y”;[/cce]
Send an Analog Voltage to ThingSpeak
The WriteVoltage.ino Arduino sketch reads an analog voltage from pin 0, and writes it to a channel on ThingSpeak every 20 seconds. Load the example in the Arduino IDE. Make sure to select the correct Arduino board and COM port. Then, upload the code to your Arduino.
Sending Multiple Values to ThingSpeak
Since ThingSpeak supports up to 8 data fields, you might want to send more than one value to ThingSpeak.
IV. RESULTS AND DISCUSSION
For viewing my data first I have to login to my cloud www.thingspeak,com, the following screen will appear for login. After login in to my account the temperature and humidity graphs with the help of MATLAB is visualized on the screen.
Figure 11 humidity and Temperature data of 16 September 2017
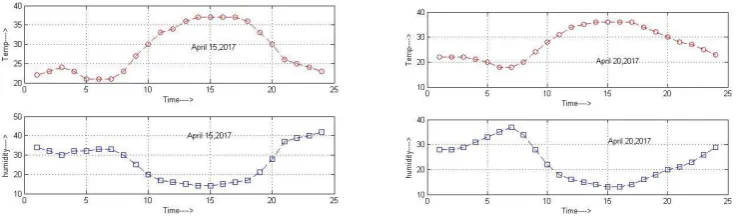
We can also able to download the data in comma separated value file (.csv) and separately plot the data in hourly basis using MATLAB software, which is shown in figure 12 and 13.
Figure 12 humidity and Temperature data of 26and 29 March 2017 using MATLAB
From above figures we can interpret that as temperature rises humidity is also decreased. Both graph shows considerable humidity and temperature relationship.
Figure 13 humidity and Temperature data of 15 and 20 April 2017 using MATLAB
V. CONCLUSION
REFERENCES
[1] Girish Birajdar, “Implementation of Embedded Web Server Based on ARM11 and Linux using Raspberry PI” International Journal of Recent Technology and Engineering (IJRTE) ISSN: 2277-3878, Volume-3 Issue-3, July 2014. PP: 64-66.
[2] UNNATI P PATEL, PROF. SUGNESH D. HIRPARA "SURVEY ON RASPBERRY PI FOR INDUSTRIAL SENSOR” INTERNATIONAL JOURNAL OF PURE AND APPLIED RESEARCH IN ENGINEERING AND TECHNOLOGY. (IJPRET) ISSN: 2319-507X 2015; Volume 3 (7) PP: 98-104.
[3] BHARGAV GORADIYA, H.N.PANDYA “Real time Monitoring & Data logging Systemusing ARM architecture of Raspberry pi & Ardiuno UNO” International Journal of VLSI and Embedded Systems-IJVES. ISSN: 2249 – 6556. Vol 04, July 2013. PP: 513-517.
[4] Mayur Randhir, R. R. Karhe, “Monitoring Of Environmental Parameters by Using Cloud Computing” International Journal of Computer Science Trends and Technology (IJCST) – Volume 3 Issue 3, May-June 2015. PP: 151-155.
[5] Nelson Gonzalez, Charles Miers, Fernando Red´ıgolo, Marcos Simpl´ıcio, Tereza Carvalho, Mats N¨aslund and Makan Pourzandi, “A quantitative analysis of current security concerns and solutions for cloud computing” Journal of Cloud Computing: Advances, Systems and Applications 2012, 1:11.
[6] Mahesh D. S, Savitha S, Dinesh K. Anvekar “A Cloud Computing Architecture with Wireless Sensor Networks for Agricultural Applications” International Journal of Computer Networks and Communications Security VOL.2, NO.1, JANUARY 2014, 34–38 Available online at: www.ijcncs.org ISSN 2308-9830.
[7] Prof C. H. Chavan, Mr.P. V.Karande, “Wireless Monitoring of Soil Moisture, Temperature & Humidity Using Zigbee in Agriculture” International Journal of Engineering Trends and Technology (IJETT) – Volume 11 Number 10 - May 2014.
[8] D.D.Chaudhary, S.P.Nayse, L.M.Waghmare, “APPLICATION OF WIRELESS SENSOR NETWORKS FOR GREENHOUSE PARAMETER CONTROL IN PRECISION AGRICULTURE” International Journal of Wireless & Mobile Networks (IJWMN) Vol. 3, No. 1, February 2011.PP: 140-149.
[9] S.Thenmozhi, M.M.Dhivya, R.Sudharsan, K.Nirmalakumari, “Greenhouse Management Using Embedded System and Zigbee Technology" International Journal of Advanced Research in Electrical, Electronics and Instrumentation Engineering”. ISSN (Print): 2320 – 3765, Vol. 3, Issue 2, February 2014. PP-7382-7389.
[10] Y.R.Dhumal, J.S.Chitode, “Green House Automation using Zigbee and Smart Phone” International Journal of Advanced Research in Computer Science and Software Engineering, ISSN: 2277 128X, Volume 3, Issue 5, May 2013. PP: 495-501.
[11] Ibrahim Al-Adwan, Munaf S. N. Al-D, “The Use of ZigBee Wireless Network for Monitoring and Controlling Greenhouse Climate” International Journal of Engineering and Advanced Technology (IJEAT) ISSN: 2249 – 8958, Volume-2, Issue-1, October 2012.PP: 35-39.
[12] Anindita Kundu, “AN EFFICIENT FUZZY LOAD BALANCING ALGORITHM FOR PUBLIC CLOUDS” INTERNATIONAL JOURNAL OF ENGINEERING SCIENCES & RESEARCH TECHNOLOGY. ISSN: 2277-9655, June, 2015. PP-30-34.
[13] Prof. Pranit P. Kathale*, Prof. P. W. Pawade, Dhanashri Gawande, Pradnya Ingle, “PRACTICAL RESULTS ON HARDWARE IMPLEMENTATION OF MONITORING AND CONTROLLING SYSTEM FOR THE OPERATION OF GREENHOUSE ENVIRONMENT” INTERNATIONAL JOURNAL OF ENGINEERING SCIENCES & RESEARCH TECHNOLOGY. ISSN: 2277-9655, May, 2015. PP-502-509. [14] Marco Schwartz, “Internet of Things with the Arduino Yún” Packt Publishing 2014.
[15] DHT Humidity Sensing on Raspberry Pi or Beaglebone Black with GDocs Logging, Adafruit Learning System. [16] DHT11 Humidity & Temperature Sensor, D-Robotics UK. (www.droboticsonline.com).
[17] "Raspbian."[Online].Available:http://www.raspbian.org/down loads. Accessed on 2nd July 2015. [18] https://www.youtube.com/watch?v=Opx8wzEuvhU. Accessed on 3rd July 2015
[19] https://en.wikipedia.org/wiki/HDMI. Accessed on 23rd July 2017.