ABSTRACT
TALLEY, LANDON KENT. Design and Implementation of a Testing Facility for Jacketed Piles in Soils with Variable Stiffness. (Under the direction of Dr. Mervyn Kowalsky).
Reinforced concrete filled steel tubes (RCFSTs) are structural elements that are commonly used as pile foundation members, especially in bridge applications. They have multiple structural advantages over other traditional systems and are an attractive choice in regions of high seismic activity due to the increased levels of ductility and high energy dissipation. Full scale testing has been completed to explore various parameters of the cyclic behavior of RCFSTs such as diameter-to-thickness ratio impacts on buckling of the steel pipe, strain limits to pipe rupture, evaluations of equivalent viscous damping, and others.
This research explores the impact of soil on the nature of the below ground region of maximum moment that occurs during a seismic event. Pile behavior can be characterized according to soil stiffness, so a key part of the research is creating the capability to alter soil stiffness. Presented here is the design and implementation of a testing facility capable of creating an environment in which testing of RCFST pipe piles under lateral loads can be accomplished, while subjecting them to various magnitudes of soil stiffness. The aim is to correlate plastic hinge characteristics and performance limit states of the pile to the stiffness of surrounding soil.
A soil-sandwich concept is proposed and validated as a means of altering soil
Design and Implementation of a Testing Facility for Jacketed Piles in Soils with Variable Stiffness
by
Landon Kent Talley
A thesis submitted to the Graduate Faculty of North Carolina State University
in partial fulfillment of the requirements for the degree of
Master of Science
Civil Engineering
Raleigh, North Carolina May, 2014
APPROVED BY:
_______________________________ ______________________________ Mervyn Kowalsky, Ph.D. James M. Nau, Ph.D.
DEDICATION
BIOGRAPHY
ACKNOWLEDGMENTS
I would like to thank my advisor, Dr. Mervyn Kowalsky, for his guidance and direction throughout the course of this research project. He has been a valuable source of knowledge to me. Professors Jim Nau and Mo Gabr also provided a wealth of intelligence and information that contributed to my learning as a part of this project. Additionally, Dr. Greg Lucier was instrumental in the development of the testing facility and all parts of the physical setup and calibrations. Thanks to the four of you for playing such an influential role in both this particular research project as well as the development of my individual education and understanding as a whole.
Thanks go out to all of the CFL staff including Jerry Atkinson and Johnathan McEntire as well as the CFL students who were always willing to bounce various ideas around and helped to make the experience such an enjoyable one. David Overby also deserves a special acknowledgement for his help in constructing the test setup as well as Tracy Kong and Diego Aguirre for their contributions to the research project. Additional students I would like to thank include John Glover, Yulian Kebede, Chad Goodnight, Jordan O’Brien, and Matthew Nifong for their help in various parts of the project.
Thank you to the Alaska Department of Transportation as well as the Alaska
University Transportation Center and especially Elmer Marx for their financial support and interest in this area of research.
TABLE OF CONTENTS
LIST OF TABLES ... vii
LIST OF FIGURES ... viii
I. INTRODUCTION ... 1
BACKGROUND ... 1
RESEARCHOBJECTIVE ... 3
SCOPE&DOCUMENTLAYOUT ... 5
II. LITERATURE REVIEW ... 6
PRESTRESSEDANDPRELOADEDSOILS ... 6
SOILSTRUCTUREINTERACTIONANDLATERALRESPONSEOFPILES ... 13
III. SOIL-SANDWICH CONCEPT ... 30
SOILPITOVERVIEW ... 30
DESIGNANDCONSTRUCTIONOFREACTIONPLATES ... 37
POST-TENSIONINGSYSTEM ... 57
IV. LOAD FRAME AND INSTRUMENTATION ... 65
GEO-LABSTRONG-FLOORANCHORTESTING ... 65
DESIGNANDFABRICATIONOFLATERALLOADFRAME ... 69
V. IMPLEMENTATION OF PRESTRESSING ... 103
PRESTRESSINGTESTSTOMEASUREVERTICALPRESSURES ... 103
PRESTRESSINGTESTSTOMEASURELATERALPRESSURES ... 132
DYNAMICCONEPENETRATIONTESTING ... 138
CORRELATIONSTOSUBGRADEREACTIONMODULUS ... 140
VI. FINAL REMARKS ... 151
SUMMARY ... 151
FUTUREWORK ... 152
VII. REFERENCES ... 153
VIII. APPENDICES ... 157
LIST OF TABLES
Table 1: STAAD FEA Output in Table Format... 40
Table 2: MMFX Steel Material Input ... 43
Table 3: Portion of Moment-Curvature Output for Concrete Plate Design ... 45
Table 4: Additional Portions of Moment-Curvature Output for Concrete Plates ... 46
Table 5: Rebar Quantities and Cut Sheet ... 56
Table 6: Burke Lift Anchor Specifications ... 57
Table 7: Concrete Compressive Strength Testing ... 64
Table 8: Summary of Existing Pressure Cell Calibration Data ... 99
Table 9: Summary of New Pressure Cell Calibration Data ... 99
Table 10: Loading History of Prestressing Tests ... 109
Table 11: Vertical Test 1 Data ... 158
Table 12: Vertical Test 2 Data ... 159
Table 13: Vertical Test 3 Data ... 160
Table 14: Vertical Test 4 Data ... 161
Table 15: Vertical Test 5 Data ... 162
Table 16: Vertical Test 6 Data ... 163
Table 17: Vertical Test 7 Data ... 164
Table 18: Horizontal Test 1 Data ... 165
Table 19: Horizontal Test 2 Data ... 166
Table 20: Horizontal Test 3 Data ... 167
LIST OF FIGURES
Figure 1: RCFSTs shown in a Bridge Application, Courtesy of Elmer Marx ... 2
Figure 2: Plastic Hinge Locations from Lateral Loading, Brown (2013) ... 3
Figure 3: Prototype Bridge Pier Investigation of PLPS Geogrid-Reinforced Soil, Shinoda et al. (2003) ... 8
Figure 4: Lab Test Samples of PLPS Geogrid-Reinforced Soil, Shinoda et al. (2003) ... 9
Figure 5: Maidashi Bridge PLPS Testing, Uchimura et al. (2005) ... 12
Figure 6: Pile Following Post-Shaking Excavation of Soil, Chang & Hutchinson (2013).... 15
Figure 7: Material Models, Hutchinson et al. (2005) ... 18
Figure 8: Hysteretic Response of Full-Scale Test Piles: (a) 2D above ground in dense sand, (b) 2D above ground in loose sand, (c) 6D above ground in dense sand, (d) 6D above ground in loose sand; Hutchinson et al. (2005) ... 19
Figure 9: Progression of Deflected Shape and Bending Moment Distribution of Laterally Loaded Fixed-Head Piles, Song et al. (2005) ... 21
Figure 10: Experimental Test Setup, Tuladhar et al. (2008)... 22
Figure 11: Horizontal Surface Displacement Contours, Tuladhar et al. (2008) ... 23
Figure 12: FEM Model, Chen et al. (2011) ... 24
Figure 13: Drilled Shaft Bents, Suarez & Kowalsky (2007) ... 26
Figure 14: Hysteretic Damping Trends, Suarez & Kowalsky (2007) ... 27
Figure 15: Flow Chard of DDBD for Drilled Shaft Bents, Suarez & Kowalsky (2007) ... 28
Figure 16: Elevation View of Soil Sandwich Concept ... 31
Figure 17: Geotechnical Lab Floor Plan ... 32
Figure 18: Looking Down into the Access Shaft ... 33
Figure 19: Water Valve, Shutoff Valve, and Ladder at Top of Access Shaft... 34
Figure 20: Grain Size Distribution of Sand in Test Pit ... 35
Figure 21: Guardrails around the Soil Pit and Access Shaft ... 36
Figure 22: Plywood Template at the Top of Pit ... 38
Figure 23: Plywood Template Lowered into the Pit ... 38
Figure 24: STAAD FEA Output of Flexural Moments in Steel Plate ... 39
Figure 25: Punching Shear Calculations ... 42
Figure 26: MMFX Stress-Strain Curve (MPa) ... 43
Figure 27: MMFX Stress-Strain Curve (ksi) ... 44
Figure 28: Sketches of Concrete Formwork Required ... 48
Figure 29: Bottom Reaction Plate Reinforcement and Formwork ... 49
Figure 30: Both Reaction Plates Pre-Concrete ... 49
Figure 31: Application of Form-Release ... 50
Figure 32: Casting Concrete Reaction Plates (1) ... 50
Figure 33: Casting Concrete Reaction Plates (2) ... 51
Figure 34: Plates Shortly After Casting ... 51
Figure 37: Finished Bottom Reaction Plate ... 53
Figure 38: Finished Top Reaction Plate... 53
Figure 39: DYWIDAG Post-Tensioning Bar Specs ... 59
Figure 40: DYWIDAG Hex Nut Specs ... 60
Figure 41: DYWIDAG Bearing Plate ... 61
Figure 42: Bottom Plate Transitioning to the Pit ... 63
Figure 43: Floor Anchor Test Set-Up ... 67
Figure 44: Pull-Out Testing of Floor Anchors ... 67
Figure 45: Removal of Damaged Concrete ... 68
Figure 46: Schematic of Test Setup ... 70
Figure 47: Schematic of Lateral Load Frame - Front Side ... 71
Figure 48: Schematic of Lateral Load Frame - Rear Side ... 71
Figure 49: Beam Stiffener Checks ... 73
Figure 50: Column Stiffener Checks ... 74
Figure 51: Beam Member Shop Drawing, Dimensions in Inches ... 75
Figure 52: Typical Column Members, Dimensions in Inches ... 76
Figure 53: Typical Brace Members, Dimensions in Inches ... 77
Figure 54: Shop Drawing of Typical Plates, Dimensions in Inches ... 78
Figure 55: Lateral Load Frame – Back View ... 79
Figure 56: Lateral Load Frame - Front View... 80
Figure 57: Earth Pressure Cell, (Pressure Cells. Geokon, Inc.) ... 81
Figure 58: Pressure Cell in Machine Press Using 3" Thick Loading Pads ... 83
Figure 59: Calibration of Pressure Cell #739 Using MTS Press ... 84
Figure 60: Calibration of Pressure Cell #739 using 5-1/2" Diameter Loading Pads in the MTS Press ... 86
Figure 61: Pressure Chamber ... 87
Figure 62: Removable Cap Plate of Pressure Chamber for Insertion of Pressure Cell ... 87
Figure 63: Pressure Chamber during a Test ... 89
Figure 64: Pressure Chamber showing Lifting Lug, Pressure Gauge, Safety Valve, and Air Input ... 90
Figure 65: Thick Neoprene Gasket Provides Air-Tight Seal Around Pressure Cell Cable ... 91
Figure 66: Calibration for Cell # 723 ... 92
Figure 67: Calibration for Cell # 739 ... 92
Figure 68: Calibration of Cell # 740 ... 93
Figure 69: Calibration of Cell # 741 ... 93
Figure 70: Calibration of Cell # 742 ... 94
Figure 71: Calibration of Cell 078F13001 ... 95
Figure 72: Calibration of Cell 078F13002 ... 95
Figure 73: Calibration of Cell 078F13003 ... 96
Figure 74: Calibration of Cell 078F13004 ... 96
Figure 75: Calibration of Cell 078F13005 ... 97
Figure 76: Calibration of Cell 078F13006 ... 97
Figure 78: Calibration of Cell 078F13008 ... 98
Figure 79: Rendering of Pressure Cell Frames, Courtesy of Diego Aguirre ... 101
Figure 80: Pressure Cells Attached to PVC Frame ... 102
Figure 81: Pressure Cell Mounted to Bottom Concrete Plate ... 104
Figure 82: Cells Mounted to Pit Wall ... 105
Figure 83: Horizontally Placed Pressure Cells 1 & 2 ... 106
Figure 84: Horizontally Placed Pressure Cells 3 & 4 ... 107
Figure 85: Pressure Cell Locations to Measure Vertical Pressures ... 107
Figure 86: Loading History of Prestressing Tests... 110
Figure 87: Load Cell Used to Record Force Applied to Bar ... 110
Figure 88: Vertical Prestressing to Measure Vertical Soil Pressures ... 111
Figure 89: Vertical Prestressing with Middle Steel Plate to Measure Vertical Soil Pressures ... 111
Figure 90: Typical Legend for Prestressing Test Charts ... 113
Figure 91: Soil Pressures from Prestressing with Middle Steel Plate, Location "A" during Loading Phase (100 psf to 1200 psf) ... 114
Figure 92: Soil Pressures from Prestressing with Middle Steel Plate, Location "A" during Unloading Phase (1200 psf to zero) ... 114
Figure 93: Soil Pressures from Prestressing with Middle Steel Plate, Location "B" during Loading Phase (100 psf to 1200 psf) ... 115
Figure 94: Soil Pressures from Prestressing with Middle Steel Plate, Location "B" during Unloading Phase (1200 psf to zero) ... 115
Figure 95: Soil Pressures from Prestressing with Middle Steel Plate, Lateral Boundary Confining Pressure from Wall Mounted Cells during Loading Phase (100 psf to 1200 psf) ... 116
Figure 96: Soil Pressures from Prestressing with Middle Steel Plate, Lateral Boundary Confining Pressure from Wall Mounted Cells during Unloading Phase (1200 psf to zero) ... 116
Figure 97: Increase in Vertical Soil Pressures from Prestressing without Middle Steel Plate, Location "A," Loading Phase (100 psf to 1200 psf) ... 118
Figure 98: Increase in Vertical Soil Pressures from Prestressing without Middle Steel Plate, Location "A," Unloading Phase (1200 psf to zero) ... 118
Figure 99: Increase in Vertical Soil Pressures from Prestressing without Middle Steel Plate, Location "B," Loading Phase (100 psf to 1200 psf) ... 119
Figure 100: Increase in Vertical Soil Pressures from Prestressing without Middle Steel Plate, Location "B," Unloading Phase (1200 psf to zero) ... 119
Figure 101: Increase in Soil Pressures from Prestressing without Middle Steel Plate, Boundary Confining Pressure from Wall Mounted Cells during Loading Phase (100 psf to 1200 psf) ... 120
Figure 103: Total Vertical Soil Pressures with Middle Steel Plate, Location "A", Loading
Phase (zero to 1200 psf) ... 122
Figure 104: Total Vertical Soil Pressures with Middle Steel Plate, Location "A", Unloading Phase (1200 psf to zero) ... 123
Figure 105: Total Vertical Soil Pressures with Middle Steel Plate, Location "B", Loading Phase (zero to 1200 psf) ... 123
Figure 106: Total Vertical Soil Pressures with Middle Steel Plate, Location "B", Unloading Phase (1200 psf to zero) ... 124
Figure 107: Total Vertical Soil Pressures without Middle Steel Plate, Location "A”, Loading Phase (zero to 1200 psf) ... 124
Figure 108: Total Vertical Soil Pressures without Middle Steel Plate, Location "A", Unloading Phase (1200 psf to zero) ... 125
Figure 109: Total Vertical Soil Pressures without Middle Steel Plate, Location "B", Loading Phase (zero to 1200 psf) ... 125
Figure 110: Total Vertical Soil Pressures without Middle Steel Plate, Location "B", Unloading Phase (1200 psf to zero) ... 126
Figure 111: Total Horizontal Soil Pressures, Location "A", Loading Phase (zero to 1200 psf) ... 127
Figure 112: Total Horizontal Soil Pressures, Location "A", Unloading Phase (1200 psf to zero) ... 127
Figure 113: Total Horizontal Soil Pressures, Location "B", Loading Phase (zero to 1200 psf) ... 128
Figure 114: Total Horizontal Soil Pressures, Location "B", Unloading Phase (1200 psf to zero) ... 128
Figure 115: Sand Elevation at North Side of Pit Before Prestressing ... 130
Figure 116: Sand Elevation at North Side of Pit After Prestressing ... 131
Figure 117: PVC Frame with Pressure Cells Mounted ... 133
Figure 118: Use of Water-Jetting Probe to Assist with Insertion of PVC Frames ... 134
Figure 119: Increase in Horizontal Soil Pressures from Prestressing, South Frame, Loading Phase (100 psf to 1200 psf) ... 135
Figure 120: Increase in Horizontal Soil Pressures from Prestressing, South Frame, Unloading Phase (1200 psf to zero) ... 136
Figure 121: Increase in Horizontal Soil Pressures from Prestressing, North Frame, Loading Phase (100 psf to 1200 psf) ... 136
Figure 122: Increase in Horizontal Soil Pressures from Prestressing, North Frame, Unloading Phase (1200 psf to zero) ... 137
Figure 123: Increase in Horizontal Soil Pressures from Prestressing, Boundary Confining Pressure from Wall Mounted Cells, Loading Phase (100 psf to 1200 psf) ... 137
Figure 124: Increase in Horizontal Soil Pressures from Prestressing, Boundary Confining Pressure from Wall Mounted Cells, Unloading Phase (1200 psf to zero) ... 138
Figure 125: DCP Testing Pre-Hammer Drop ... 139
Figure 126: DCP Testing Post-Hammer Drop ... 140
Figure 128: Shear Moduli of Sands at Various Relative Densities (Seed 1970) ... 143 Figure 129: Subgrade Reaction Calculation Numerical Example ... 144 Figure 130: Subgrade Modulus Constant vs. Mean Total Soil Stress, Loading Phase ... 145 Figure 131: Subgrade Modulus Constant vs. Mean Total Soil Stress, Unloading Phase .... 145 Figure 132: Subgrade Modulus Constant vs. Mean Effective Soil Stress, Loading Phase . 146 Figure 133: Subgrade Modulus Constant vs. Mean Effective Soil Stress, Unloading Phase
... 146 Figure 134: Constant of Horizontal Subgrade Reaction versus Depth as it Varies with
Prestress, Dry Sand Condition ... 148 Figure 135: Constant of Horizontal Subgrade Reaction versus Depth as it Varies with
Prestress, Saturated Sand Condition ... 149 Figure 136: Coefficient of Horizontal Subgrade Reaction versus Depth as it Varies with
Prestress, Dry Sand Condition ... 150 Figure 137: Coefficient of Horizontal Subgrade Reaction versus Depth as it Varies with
I.
INTRODUCTION
BACKGROUND
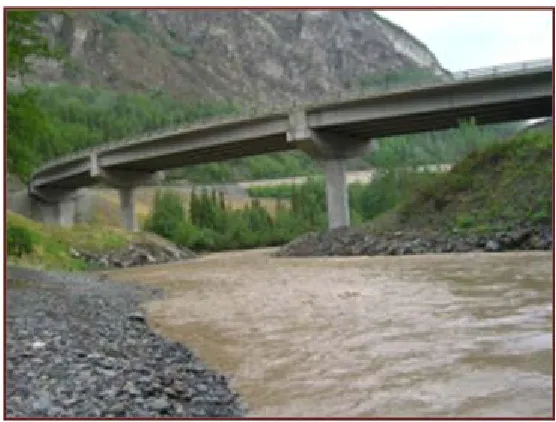
Reinforced concrete filled steel tubes (RCFSTs) have become an increasingly popular choice for foundation applications. As a relatively cost-effective means of transferring superstructure loads to the ground, RCFST pile foundations utilize the construction materials very efficiently and can provide structural advantages that far exceed the capabilities of the steel and concrete components on their own. This composite system of reinforced concrete and steel is able to accommodate sizeable moments and displacements. Not only does the outside steel casing provide considerable levels of tensile strength and ductility, but it helps to confine the concrete within, and allows the concrete core to dissipate enormous amounts of energy by increasing the strain capacity of the material which is naturally very strong in compression.
seismic applications. Figure 1 is a photo of a bridge in Alaska that utilizes this type of system.
Figure 1: RCFSTs shown in a Bridge Application, Courtesy of Elmer Marx
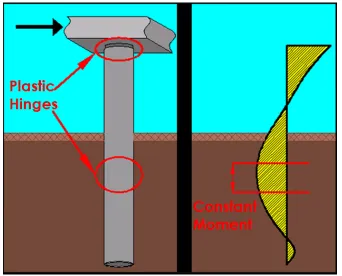
Figure 2: Plastic Hinge Locations from Lateral Loading, Brown (2013)
RESEARCH OBJECTIVE
numerous aspects of the underground maximum moment region through experiments on large-scale RCFSTs in air (Brown 2013). The current research picked up where the work of Brown left off, into how soil pressures contribute to below-ground plastic hinge formation. Several phases of the project are planned including a mixture of both experimental and analytical topics that will enable better prediction and understanding of the below ground plastic hinge that can form during seismic actions and how this region is impacted by the soil around it. It is the mission of the current project to apply the results from Brown to the more realistic application of a pile in soil. By analyzing these foundation elements in soil, we can better understand how the soil affects their structural behavior.
states, to compare with experimental results, and to provide design recommendations for future seismic applications. Portions of these analytical models are also used to predict displacements and forces required for design of the testing facility and setup.
SCOPE & DOCUMENT LAYOUT
The scope of this thesis is to prepare a soil structure interaction facility for testing of moderate-scale RCFSTs under lateral loading, while maintaining the ability to vary soil stiffness for each test. This document explains the detailed steps implemented to allow for this specific type of testing to occur. It also focuses on the aspect of creating a soil media in which the stiffness can be modified. It begins with a summary of past research that has been done in the area of soil confinement, soil prestressing, and soil preloading; while also
touching on previous pipe pile testing that has taken place. Chapter three explains the intricacies of the soil confinement mechanism as well as highlights of the construction process. Chapter four goes into a greater detail of the lateral load frame and load application as well as additional specifications of the facility. Results from prestressing trials are
II.
LITERATURE REVIEW
A literature review was completed as a part of this research project to understand what knowledge exists on this subject matter and how this research project specifically could add to the overall body of knowledge. There has been little research done on the strict
application of round reinforced concrete steel tube pipe piles and the effect of the soil structure interaction during seismic events. There has been, however, extensive research on similar structural systems which will be briefly introduced. The main topics of this review include prestressing and preloading of geogrid-reinforced soil, various effects of soil structure interaction, and past research on pile foundations under lateral loads.
PRESTRESSED AND PRELOADED SOILS
A major component behind the idea of prestressing soils is to increase the stiffness and make the soil bed stronger. Shinoda et al (2003) performed a study at the University of Tokyo entitled “Increasing the Stiffness of Mechanically Reinforced Backfill by Preloading and Prestressing.” This article focused predominately on geogrid-reinforced soil in
conjunction with retaining walls, bridge piers, and bridge abutments. They point out that these geogrid-reinforced soil retaining walls have been able to accommodate large lateral forces due to their relatively large ductility and dynamic flexibility capabilities. More
of preloading the soil structure (bridge pier or abutment in this case,) accompanied by a more permanent prestress to be applied throughout the useful life of the structure. It was expected that under the preload prestress procedure, the reinforced soil would deform elastically and that residual deformations would be minimal. The goal was to increase the stiffness and strength of the backfill by maintaining vertical prestress throughout.
Figure 4: Lab Test Samples of PLPS Geogrid-Reinforced Soil, Shinoda et al. (2003)
These were small scale laboratory tests; the reinforced soil piers were 35 cm square by 55 cm tall. The reaction blocks were 45 cm square steel plates that were 5 cm thick and
They explored two options for applying the compressive forces to the reinforced soil structures: through air cylinders and through steel tie rods (as shown above).
Notable outcomes from the study by Shinoda et al include the following. From the prototype bridge pier, it was noticed that deformations of the sand reached approximately .001% strain indicating purely elastic deformation. The authors attribute this elastic response to the high stiffness that was maintained through prestressing. This prestress was introduced to the system one year before the structure was opened to the public and remained in place for three and one-half years. Additional observations were made during the small scale lab tests. First of all, the tension in the tie rods decreased gradually over time as a result of two significant reasons: cyclic compressive loads in the vertical direction caused small residual deformations in the reinforced soil profile, and the backfill exhibited creep deformations that magnified the tension loss. However, despite the fact that residual deformations still existed, they were significantly minimized as a result of the preloading effect which introduced large permanent strains from the onset. While preloading was effective in minimizing these residual deformations, it did not seem to have a large effect on increasing soil stiffness; stiffness increase can largely be contributed to the prestressing aspect of the experiment. The authors also provide recommendations such that the amount of prestress should be
Additional studies on the preloading and prestressing procedure were conducted by Uchimura et al (2005) in their research paper titled “Vertical and Horizontal Loading Tests on Full-Scale Preloaded and Prestressed Geogrid-Reinforced Soil Structures.” Their specific testing revolved around reinforced soil piers for railway applications. Testing of these full-scale reinforced soil piers included both vertical and horizontal loads. Deformation
Figure 5: Maidashi Bridge PLPS Testing, Uchimura et al. (2005)
The reinforced soil that made up the bridge pier was surrounded by a concrete facing. The authors accounted for the lateral confinement provided by this concrete facing through a vertical joint line filled with a soft material to accommodate small displacements. They also used gravel bags around the backfill to help the pier hold shape, and these bags could easily have been softer than the reinforced soil itself as proposed by the authors.
continual prestress and/or the fact that the concrete facing was set in place after the
preloading period, indicating that confinement (if any) would become an issue after the initial preload deformation had already taken effect. It was observed that their pier backfill
stiffness was significantly greater than the abutment backfill stiffness due to the fact that the pier was preloaded and prestressed.
SOIL STRUCTURE INTERACTION AND LATERAL RESPONSE OF PILES
Brandenberg et al. (2005) completed a study complementing these ideas through experiments on both single piles and pile groups.
Figure 6: Pile Following Post-Shaking Excavation of Soil, Chang & Hutchinson (2013)
to lateral loads, the bending moment in the pile is distributed along its length. He explains that “the overall lateral response is characterized by increased flexibility due to the
compliance of the soil, posing a challenge to design as increased displacement may result in unacceptable level of residual displacement in the pile-shaft” (Chai 10). Chai bases the lateral strength of the pile, and corresponding curvature ductility demand, upon an assumed soil pressure distribution. This curvature ductility demand is dependent upon many factors including pile height above ground, stiffness of the pile and soil, depth to below-ground plastic hinge, and the plastic hinge length; all characteristics of interest in the current research project at hand.
Another research project relevant to the present discussion is titled “Inelastic Seismic Response of Bridge Drilled-Shaft RC Pile/Columns” by Budek et al. (2000). They examined both free- and fixed-head pile/columns in sandy soil and attempted to quantify effects on variations of soil stiffness and variations of superstructure height. Budek et al. implement the assumption of a linear relationship between soil stiffness and pile diameter. They also
acknowledge the equation developed by Priestley et al. (1996) to define plastic hinge length: (lp = .08*L + .022*fy*dbl), and explain why this equation is invalid for plastic hinges in pile shaft foundations. Thus, they set out to identify the parameters effecting plastic hinge length, depth to maximum moment, and depth to fixity with regards to displacement.
response of the reinforced concrete piles. There were four experimentally tested piles that each had a diameter of 16 inches. The piles were tested with above ground heights of 2D and 6D (where D = pile diameter,) and they were tested in both loose and dense sand. The
authors used cone penetration testing (CPT) to characterize the soil and determined that the dense sand had friction angles between 42° and 44° and the loose sand had friction angles between 37° and 38°. They also imposed an axial force of (0.1*fc’*Ag) onto the piles.
The finite element model was composed of a beam-on-nonlinear-Winkler foundation (BNWF) that represented the pile using nonlinear fiber beam-column elements and modeled the soil using nonlinear p-y elements. Stress-strain displacement curves as well as force-displacement responses are provided in Figure 7. The authors used the Mander model for confined concrete as well as the Giuffre-Menegotto-Pinto model for the longitudinal
Figure 7: Material Models, Hutchinson et al. (2005)
“the soil gap affects the amount of hysteretic energy dissipated by the structure, which in turn affects the lateral displacement of the structure under dynamic loading.” Thus, it was
important to include this gapping effect in the finite element model to improve model prediction of the overall lateral displacement. Additionally, the authors found that P-Delta moments in the test piles with above ground heights of 6D had a large influence on lateral loading responses.
The authors conclude their results by stating that fiber-based beam-column elements paired with the nonlinear p-y curves for soil were able to predict lateral cyclic response of the reinforced concrete piles fairly well. Analysis results were adequate when compared to the experimental results on the basis of initial load-displacement stiffness, strength degradation after the peak response, and unloading and reloading response. A few other notable
conclusions are that the taller piles (larger above ground height) were less sensitive to the different nonlinear soil spring models. Also, variations in the reinforced concrete properties, such as the compressive strength, longitudinal yield strength, ect., had a stronger effect on peak lateral load resistance of the pile than variations in the density of the surrounding sand.
Figure 9: Progression of Deflected Shape and Bending Moment Distribution of Laterally Loaded Fixed-Head Piles, Song et al. (2005)
The equations derived for cohesive soils assume constant soil stiffness with depth, and hence a constant modulus of horizontal subgrade reaction for the soil; while the equations derived for cohesionless soils utilize a Winkler foundation with a modulus of horizontal subgrade reaction that increases linearly with depth. Thus, the lateral stiffness of piles in soils is directly dependant on the horizontal modulus of subgrade reaction.
In another study on cyclic behavior of laterally loaded concrete piles, Tuladhar et al. (2008) created a 3D finite element analysis to compare results from two full-scale tests of concrete piles embedded in cohesive soils. The test piles had a diameter of 300 mm and were 26 m long. The piles were composed of hollow precast prestressed concrete and had a
testing included reaction frames that were mounted onto reaction piles. The reaction piles were driven 10 m into the ground.
The first test pile, SP1, was subjected to monotonic loading while the second test pile, SP2, was subjected to reverse cyclic loading. The second pile, the one that was subjected to reverse cyclic loading, proved to have a much smaller lateral load capacity than the first pile. This lateral load capacity degradation is a result of decline in soil stiffness from cyclic
loading, explain the authors. They found that the loss of soil stiffness could also be attributed to a gap that occurred between the cohesive soil and pile on the active soil side. They
explain this phenomena and plot contours of horizontal soil displacements at the soil surface to display the magnitude of the gaps that formed in the two finite element models.
Figure 11: Horizontal Surface Displacement Contours, Tuladhar et al. (2008)
pile was embedded into the rock to be a critical region as stress concentrations were large due to the reduction of pile diameter at this location and the disappearing of the steel tube.
Coupled with finite element analyses, as shown below, they were able to make
recommendations for bearing capacity and socketed length for these types of foundation systems.
Figure 14: Hysteretic Damping Trends, Suarez & Kowalsky (2007)
Figure 15: Flow Chard of DDBD for Drilled Shaft Bents, Suarez & Kowalsky (2007)
III.
SOIL-SANDWICH CONCEPT
SOIL PIT OVERVIEW
The idea of prestressing soils is a concept that originated to ensure both yielding and adequate plastic deformation of the pile below the soil line. The idea progressed and led to a number of research possibilities that enabled us to not only make evaluations about how the soil impacts pile response, but howthe pile response will vary depending upon the
magnitude of soil stiffness surrounding it. Thus, it became imperative to be able to subject the soil structure system to several soil confinement levels. The term “soil sandwich”
Figure 16: Elevation View of Soil Sandwich Concept
Figure 17: Geotechnical Lab Floor Plan
Figure 18: Looking Down into the Access Shaft
Figure 19: Water Valve, Shutoff Valve, and Ladder at Top of Access Shaft
Figure 20: Grain Size Distribution of Sand in Test Pit
An open pit in the lab posed a serious safety concern that had to be addressed. The deep access shaft had a fixed railing, as noted before, but there existed no guardrail around the soil pit. In all previous geotechnical testing the soil pit has remained full so this unique scenario of an open pit introduced new challenges to the project. A temporary guardrail structure was constructed to create a barrier around the perimeter of the open pit. Composed primarily of 2x4’s the three-sided guardrail was anchored to the floor at the floor tie-down locations by drilling through the toe-stud and using 3/4” couplers. On the fourth side the guardrail tied into the existing access shaft handrail which provided both stability and enclosure to the temporary guardrail.
DESIGN AND CONSTRUCTION OF REACTION PLATES
With all soil removed from the testing pit, it was an opportune time to check the
dimensions of the large void that now existed in the geotechnical lab. It was easy to measure the diameter at the top of the pit even with it full of sand, but with an excavated pit we could complete a thorough check and inspection of the facility. An optimal reaction plate would be as large as possible, so that the effective surcharge load could be applied over the maximum amount of surface area. It would be detrimental to the test if the bottom reaction plate, made of steel or concrete, couldn’t be lowered to the correct depth at the bottom of the pit because of small irregularities in the diameter of the round pit at certain depths. A plate template made of wood was used to check regularity of the pit with depth to ensure the round wall remained plumb all the way down. A good template would closely resemble an actual reaction plate, however wood easily became the material of choice considering the cost, practicality, and ease of construction for a simple template. Sheets of plywood were cut into two 9’-10” diameter circles, which in theory would leave a 1” gap around the entire template if the pit truly measured 10’ in diameter all the way down. 2x10 pieces of lumber were stacked horizontally between the two plywood circles with the 10” dimension in the vertical direction. This added thickness to the template and provided a closer approximation to the actual plate, as well as making the plywood more rigid for the insertion and removal process. A careful run-through of lowering down the template showed that the pit is in fact
Figure 22: Plywood Template at the Top of Pit
Once final plan dimensions of the reaction plate had been determined from the results of the template test, design of the plate was underway. The two primary materials under consideration were steel and concrete, and designs using both materials were completed and evaluated. A finite element model was created to examine flexural stresses in a round steel plate. The plate was then sized for thickness based on flexure. Results from a STAAD finite element analysis are provided below and summarized in the following table. My is the bending moment in the plate, considering a 1” wide strip. S is the section modulus of the 1” wide strip of the plate and σy represents the flexural stresses in the plate.
Table 1: STAAD FEA Output in Table Format Model: "Steel 3"
12" diameter hole in center plate
Plate Thickness (in) MY (lb-in/in) S (in3) σy (psi) Δ (in)
1 8606 0.1666667 51636 -1.25 8607 0.2604167 33050.88 0.983
1.5 8607 0.375 22952 0.569
A variety of different models were composed to evaluate the parameters of a steel plate. As a preliminary design, the circular finite element model was created with elements that were 3” wide in the radial direction and .111 radians (6.37 degrees) in the angular direction. This produced elements along the outside diameter that had maximum dimensions of
approximately 3 inches by 6 inches and elements got smaller the closer they were to the center. This distribution of finite elements worked well considering the maximum bending stresses occur at mid-span, at the center of the plate. It is also for this reason that it became apparent that the best location for a drainage hole was in the middle of the plate. The bottom reaction plate drastically impeded the drainage of water because of the reduction of
The preliminary design included four prestressing locations, indicated by supports in the finite element model. A uniform pressure distribution of 1778 psf was applied to the plate for analysis. The target load was 1000 psf and in combination with both a strength reduction factor of 0.90 and a live load factor of 1.60 a design load of 1778 was calculated. As
indicated in the table above, a plate thickness of 1.25 inches was the minimum required thickness to prevent yielding stresses due to bending of A36 steel (36 ksi yield strength) under the given conditions and drainage hole. In making decisions about final thickness, deflections were considered as well as drainage holes of various sizes. In order to limit deflections of the plate, the finalized steel design specified a 2” thick plate.
Table 2: MMFX Steel Material Input
STRAIN STRESS (MPa) STRESS (ksi)
0 0 0
0.0024 480 70
0.0033 660 96
0.005 760 110
0.007 850 123
0.0085 900 131
0.012 1000 145 0.014 1040 151 0.016 1085 157
0.02 1125 163
0.025 1160 168
0.03 1180 171
0.04 1200 174
0.05 1210 175
0.06 1220 177
Figure 27: MMFX Stress-Strain Curve (ksi)
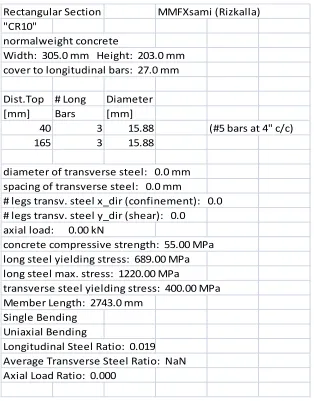
A study completed at North Carolina State University’s Constructed Facilities Laboratory in November 2003 concerning the flexural adequacy of MMFX reinforcement in rectangular concrete beams supplied information about the elastic and inelastic portions of the stress-strain relationship for this specific steel. The material properties shown above and used in this design are gathered from the study that concluded in 2003.
Table 3: Portion of Moment-Curvature Output for Concrete Plate Design
Rectangular Section MMFXsami (Rizkalla) "CR10"
normalweight concrete
Width: 305.0 mm Height: 203.0 mm cover to longitudinal bars: 27.0 mm
Dist.Top # Long Diameter [mm] Bars [mm]
40 3 15.88 (#5 bars at 4" c/c) 165 3 15.88
diameter of transverse steel: 0.0 mm spacing of transverse steel: 0.0 mm
# legs transv. steel x_dir (confinement): 0.0 # legs transv. steel y_dir (shear): 0.0
axial load: 0.00 kN
concrete compressive strength: 55.00 MPa long steel yielding stress: 689.00 MPa long steel max. stress: 1220.00 MPa
transverse steel yielding stress: 400.00 MPa Member Length: 2743.0 mm
Single Bending Uniaxial Bending
Table 4: Additional Portions of Moment-Curvature Output for Concrete Plates
Cover Core N.A Steel Moment Curvature Strain Strain [mm] Strain [kN-m] [1/m]
0 0 0 0 0 0
0.0001 0.00004 47.02 -0.00025 4.18 0.00213 0.0002 0.00009 47.02 -0.00049 8.36 0.00425 0.0003 0.00013 47.02 -0.00074 12.54 0.00638 0.0004 0.00017 47.02 -0.00099 16.71 0.00851 0.0005 0.00021 47.02 -0.00123 20.88 0.01063 0.0006 0.00026 47.02 -0.00148 25.04 0.01276 0.0007 0.0003 47.56 -0.0017 29.77 0.01472 0.0008 0.00035 47.56 -0.00194 33.97 0.01682 0.0009 0.00039 47.56 -0.00218 38.12 0.01893 0.001 0.00043 47.56 -0.00243 42.22 0.02103 0.0011 0.00048 47.56 -0.00267 46.24 0.02313 0.0012 0.00052 47.56 -0.00291 50.16 0.02523 0.0013 0.00056 47.56 -0.00316 53.96 0.02734 0.0014 0.00061 47.56 -0.0034 57.94 0.02944 0.0015 0.00063 46.38 -0.00377 59.9 0.03234 0.0016 0.00065 45.46 -0.00414 61.83 0.0352 0.0018 0.0007 44.23 -0.00483 65.7 0.0407 0.002 0.00075 43.24 -0.00554 68.66 0.04625 0.0025 0.0009 42.17 -0.00716 74.67 0.05928 0.003 0.00108 42.17 -0.0086 77.58 0.07114 0.0035 0.00131 43.19 -0.00971 79.58 0.08105 0.004 0.00156 44.33 -0.01071 80.46 0.09022 0.0045 0.00184 45.74 -0.01154 81.33 0.09838 0.005 0.00213 47.08 -0.01231 81.47 0.10621 0.006 0.00273 49.62 -0.01371 81.33 0.12093
Bilinear Approximation:
Curvature Moment Displ. Force [1/m] [kN-m] [m] [kN]
0 0 0 0
0.04121 80.46 0.12196 29.33 0.12093 81.33 0.22873 29.65
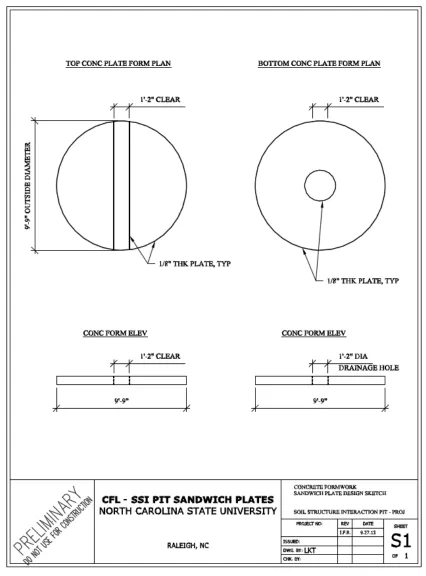
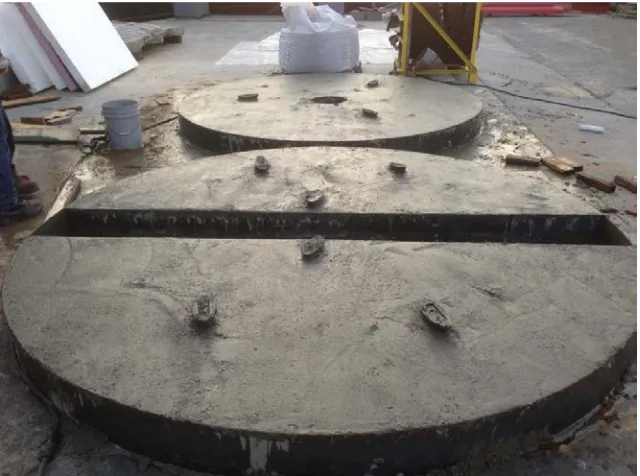
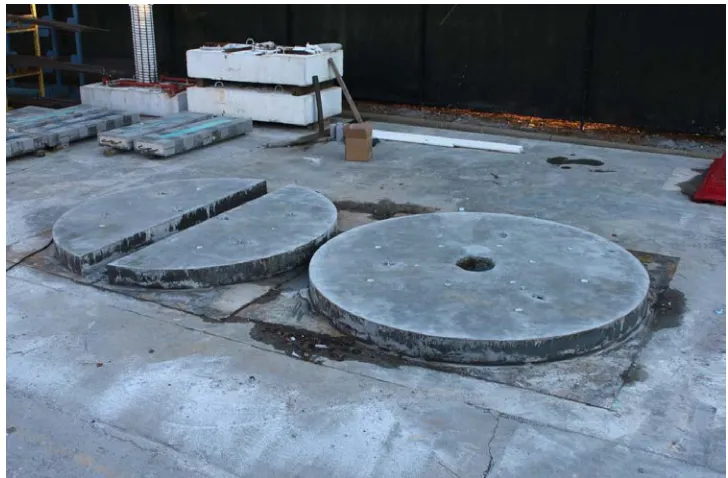
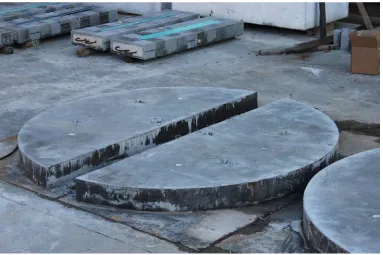
shown on the following pages. This sketch accurately depicts the top reaction plate, shown with a 14” gap along the entire length in the plan view. The 14 inch gap in the middle allows room for insertion and lateral movement of the pile at the soil surface. Lateral displacement at the soil surface is therefore not limited by the reaction plate (as would be the case if a slotted hole were used) but instead by the boundary of the pit itself. The bottom reaction plate is also shown as having a 14” diameter drainage hole in the center to allow for drainage after liquefaction. This drainage hole is almost identical to that shown in the finite element analysis of the original steel concept. Additionally, the top reaction plate was in reality two distinct plates, each having the shape of a half-moon, that when set at the top of the pit would form a long 14 inch wide gap in which the pipe pile would be situated. This gap would allow the pile to deform freely in the plane of lateral loading, while still allowing the use of
Figure 29: Bottom Reaction Plate Reinforcement and Formwork
Figure 31: Application of Form-Release
Figure 33: Casting Concrete Reaction Plates (2)
Figure 35: Casting of Concrete Cylinders for Quality Control Testing
Steel was purchased from a local supplier in the Raleigh area. In total there were (three) 48” by 96” sheets and (four) 60” by 120” sheets of steel. All steel was 1/8 inch thick. The 48x96 sheets were cut into strips that were 8 inches wide by 96 inches long. These strips were welded end to end to make two circular forms of approximately 9’-9” diameter and would serve as the 8 inch tall vertical portion of the form to create the plate thickness. Once rolled and welded to form a circle these pieces were welded on the bottom to the 60x120 sheets that served as the bottom of the form onto which the concrete was poured.
One advantage of creating forms out of rolled steel is that the MMFX reinforcement could be welded directly to the formwork which would assure a higher degree of accuracy regarding the reinforcing bar locations during casting. Instead of having the bars supported on chairs, the bars were fixed in place by simply tack welding the ends to the steel formwork. This process took slightly more time in the preparation stage as each bar had to be cut to precisely the correct length and welded into place at the correct elevation. The table shown below lists the cut dimensions and quantities for the MMFX reinforcing bars required for construction of the concrete reaction plate.
formers easily snapped off after the concrete had set and left a nice smooth divot with plenty of room to connect a lifting clutch or rapid lift system to the anchor for easy lifting and rigging. 7” anchors were ordered to be used with the 8” thick concrete reaction plates. This size anchor is rated for just over 9,000 pounds per anchor, which greatly exceeds the
Table 5: Rebar Quantities and Cut Sheet
TOP REACTION PLATE
BOTTOM REACTION PLATE
quantity bar length quantity bar length quantity bar length 29 14" 4 4' 3 1/8" 8 9' 6 1/4"
1 9' 8 3/4" 4 4' 2 11/16" 8 9' 5 3/8" 2 9' 8 1/2" 4 4' 2" 8 9' 3 3/8" 2 9' 7 11/16" 4 4' 1" 8 9' 0 3/4" 2 9' 6 1/4" 4 3' 11 3/4" 8 8' 9 7/16" 2 9' 4 5/16" 4 3' 10 1/8" 8 8' 5 7/16" 2 9' 1 11/16" 4 3' 8 1/8" 8 8' 0 5/8" 2 8' 10 7/16" 4 3' 5 11/16" 8 7' 6 13/16" 2 8' 6 7/16" 4 3' 2 13/16" 8 6' 11 13/16" 2 8' 1 11/16" 4 2' 11 3/8" 8 6' 3 3/8" 2 7' 7 15/16" 4 2' 7 1/4" 8 5' 4 7/8" 2 7' 1 1/16" 4 2' 2 1/8" 8 4' 3 1/8" 2 6' 4 3/4" 4 1' 7 7/16" 8 2' 5 11/16" 2 5' 6 7/16" 4 9 3/8"
Table 6: Burke Lift Anchor Specifications
Panel Thickness
Anchor Height
Burke Lift Face Lift Allowable Tension
Load 4:1 Safety Factor (lbs)
Rapid Lift Face Lift Allowable Tension
Load 4:1 Safety Factor (lbs)
Overall Width
Material Thickness
5" 4" 4,600 2,670 - 5,500 3.89" 0.75" 6" 5" 6,000 3,590 - 8,000 4.45" 0.75" 7" 6" 8,000 6,350 5.01" 0.75" 8" 7" 9,250 10,000 5.57" 0.75" 9" 8" 11,250 N/A 6.13" 0.75" 10" 9" 13,200 N/A 6.69" 0.75" 11" 10" 14,500 N/A 7.25" 0.75" 12" 11" 16,000 12,000 7.81" 0.75"
POST-TENSIONING SYSTEM
Figure 41: DYWIDAG Bearing Plate
sand on top was graded, leveled, and smoothened out to create a flat surface for the bottom reaction plate to rest upon.
Figure 42: Bottom Plate Transitioning to the Pit
One concern about the soil sandwich concept was how it would affect water drainage of the pit. With the presence of a large concrete reaction plate near the bottom of the pit, the concern is that it would restrict water flow and create a bottleneck effect when drained as the large amount of water would be forced to pass through the center drainage hole or through the small gap around the perimeter of the round plate. Drainage tests were conducted to measure the amount of time it took for water to flow through the plate. It took approximately fifteen minutes for the water level to rise to a height of ten feet and it took approximately five hours for the water level to drop below the plate. Of course, it took much longer than five hours for all of the water to completely drain from the pit as the flow rate decreased
drainage test is that water flow did not seem to be restricted by flow through and around the concrete plate, but by water backup in the access shaft. The limitation of the system as a whole actually occurred at the sewer pipe from the access shaft to the outside. The water flow exiting the pit had to be limited so that water in the access shaft did not rise above a prescribed level.
Concrete cylinders were cast at the time of casting the reaction plates to be able to test the concrete strength after the curing process had taken place. Concrete was poured on
November 25, 2013 and the first cylinder was tested on December 19, 2013. The other cylinders were kept with the large plates until the actual prestressing tests would take place and were tested on March 25, 2014. Concrete cylinder testing to calculate actual
compressive strength parameters yielded the following results.
Table 7: Concrete Compressive Strength Testing
Date Load (kips) Strength (ksi)
11.25.13
12.19.13 84.71 6.74
3.25.14 104.78 8.34
3.25.14 108.38 8.62
3.25.14 103.71 8.25
3.25.14 108.26 8.62
3.25.14 108.09 8.60
concrete is cast
IV.
LOAD FRAME AND INSTRUMENTATION
GEO-LAB STRONG-FLOOR ANCHOR TESTING
Design and construction of a lateral load frame was the next major phase of this project. Unlike the structural portion of the Constructed Facilities Laboratory, the geotechnical portion of the lab does not contain a vertical wall upon which a horizontally positioned actuator can be attached to transmit and resist horizontal loads. Therefore, a lateral load frame design was implemented to enable the application of lateral loads to the foundation system under consideration.
The geotechnical side of the lab contains floor anchors spaced three feet apart in each direction across almost the entire floor. Each anchor location consists of four 3/4 inch
threaded rods embedded into a recessed portion of the concrete floor. The entire 1’-3” square recess is covered by a 1/2 inch thick steel plate to create an even walking surface when the floor anchors are not in use. The square steel plates can easily be removed and stored in a different location for access to each floor anchor location. The floor plan of the geotechnical portion of the Constructed Facilities Laboratory, presented in chapter three, shows the positions of tie-down/anchor locations in relation to the soil pit and access shaft.
A visual inspection of the floor anchors raised doubts about their structural capacity. Due to past episodes of flooding, water had been trapped in many of the floor recesses that
was performed to determine the adequacy of the anchors and to examine both the quality of the steel threaded rod and the soundness of the surrounding concrete into which the rods had been set. The pull-out tests were conducted one anchor at a time, and were carried out by applying a direct tensile force to the threaded rod. If the anchor could withstand the applied force, it was determined adequate. If any observations such as cracking or chipping of the surrounding concrete were noticed then additional investigation into the anchor itself was deemed appropriate. A single center-hole jack was connected to a manual hydraulic pump which was used to physically apply the force. A large steel plate was placed directly over the threaded anchor to be tested. A larger threaded rod was connected to the anchor by a 3/4 inch coupler. The hydraulic jack applied the vertical force to this “testing rod,” which transferred the force to the floor anchor through the coupler. The hydraulic jack was
Figure 43: Floor Anchor Test Set-Up
Figure 45: Removal of Damaged Concrete
original prescribed tensile load without any additional cracking. An explanation for this phenomenon is that the anchor experienced an initial slip because the bond between the steel anchor and the concrete had experienced some corrosion. Cracking along the top surface of the concrete showed that this is where the slip had taken place. The anchor was firmly grouted deeper into the concrete and this was proven in subsequent testing after the weaker surface concrete had been chipped away. In conclusion, it was found that the sets of anchor rods at the locations of the proposed load frame were able to resist forces equivalent to those expected from the load frame reactions during the RCFST tests.
DESIGN AND FABRICATION OF LATERAL LOAD FRAME
to fail before the steel frame experienced any structural damage; however, the system should perform elastically under the expected service loads of the actuator during testing.
Logistically, the only feasible location for the lateral load frame was opposite the access shaft from the pit, near the entrance to the geotechnical lab. A schematic of the test setup is shown along with renderings of the load frame on the following pages. This type of setup requires unique actuator demands as the actuator now has to span over the access shaft to connect to the pipe pile in the pit. This presented yet another interesting challenge for the project. A custom actuator must be built with a capacity of 150 kips and 70 inches of stroke. In order to span the access shaft, the actuator will be approximately 150 inches long at mid-stroke and be able to accommodate +/- 35 inches of deflection in both directions.
One of the primary design criterions was that the frame members remain elastic under design level loads. Localized effects were also considered to prevent buckling or yielding of member flanges and webs. After modeling the lateral load frame using AutoCAD Structural Detailing software, shop drawings were created for fabrication of each individual member. Three generic pieces were called out in the drawings: a beam member, column members, and bracing members; along with corresponding plates to be welded in the matching locations. The design called for 1” bolts and oversized holes in the plates and frame
Figure 56: Lateral Load Frame - Front View
PRESSURE CELLS AND CALIBRATION CHAMBER
data acquisition system and tested to see if they would respond to an applied load. The cells had not been used in some time so in order to be utilized in our testing they would need to be thoroughly examined, which included calibration.
Figure 57: Earth Pressure Cell, (Pressure Cells. Geokon, Inc.)
Figure 59: Calibration of Pressure Cell #739 Using MTS Press
of a press that applies a given load is that the load applied is not distributed evenly across the entire surface of the pressure cell. This is a major source of error as the instrument is not subjected to an actual “pressure,” but instead a “load” over certain portions of the surface. Another problem with the press used at the CFL is that the small magnitudes of load were less than one percent of the capacity of the machine. The tolerance on the accuracy of applied loads was very small when operating in the lowest portion of the capabilities of the MTS press.
Figure 60: Calibration of Pressure Cell #739 using 5-1/2" Diameter Loading Pads in the MTS Press
Figure 65: Thick Neoprene Gasket Provides Air-Tight Seal Around Pressure Cell Cable
Figure 66: Calibration for Cell # 723
Figure 68: Calibration of Cell # 740
Figure 70: Calibration of Cell # 742
In addition to the existing pressure cells that will be used again, eight new pressure cells were purchased specifically for use on this project. These new pressure cells contained a current based transducer instead of a voltage based transducer used in the existing cells. The current based cells have their own advantages in particular applications; however, they became yet another challenge in this project because the data acquisition systems at the CFL can only be used with voltage based cells. In order to correct this, 350 ohm precision
Figure 71: Calibration of Cell 078F13001
Figure 73: Calibration of Cell 078F13003
Figure 75: Calibration of Cell 078F13005
Figure 77: Calibration of Cell 078F13007
Tables are provided below that summarize the results of the calibration tests of the pressure cells. As evidenced by the curves above, the calibrations proved to be successful and the cells are deemed reliable for providing accurate pressure readings.
Table 8: Summary of Existing Pressure Cell Calibration Data
Cell ID Calibration Factor (psi/V) Range (psi)
723 6.723 0-30
739 6.345 0-30
740 6.414 0-30
741 6.538 0-30
742 6.606 0-30
Table 9: Summary of New Pressure Cell Calibration Data
Cell ID Calibration Factor (psi/V) Range (psi)
078F13001 9.0463 0-50
078F13002 9.0525 0-50
078F13003 18.034 0-100
078F13004 17.92 0-100
078F13005 18.013 0-100
078F13006 18.046 0-50
078F13007 9.05 0-50
078F13008 9.035 0-50
accurately place the cells into location and ensure that the cells did not move during testing. The concept of using a pressure cell frame that the pressure cells would be attached to quickly became a feasible solution. The main complication revolving around a pressure cell frame is that it needed to be stable enough to hold the pressure cells in place but flexible enough so that it would not reinforce the soil. Ideally, the frame would keep the pressure cells in place, during testing and liquefaction cycles, without affecting the stiffness of the soil.
the drilled holes in the frame to hold the cells in place. They were tightened with nuts and washers on the rear side. The application of this process is shown in the figures on the following pages and further explained in chapter four.
V.
IMPLEMENTATION OF PRESTRESSING
PRESTRESSING TESTS TO MEASURE VERTICAL PRESSURES
The concluding phase of the sand sandwich concept was to carry out the prestressing experiments and to determine the effect of prestressing as a means of altering soil pressures. Following the immense amount of groundwork required to design the setup, calibrate the instruments, and prepare the facility, the pit was restored to its original, filled condition, with a few adjustments. The bottom reaction plate was lowered into the pit on top of a 12 inch layer of gravel and a 6 inch layer of sand. This bottom layer of gravel and coarse sand formed the filter system and serves to prevent sand from escaping during drainage, as
Figure 84: Horizontally Placed Pressure Cells 3 & 4
Shown above are the locations of the pressure cells as they were situated in the pit to measure vertical pressure. Beginning at a depth of 7 feet from the top of the pit and working up, two cells were placed at each increment of 18 inches. Cables from the pressure cells were run directly to the side of the pit and together were run up the pit wall between the gaps in the top plates.
Table 10: Loading History of Prestressing Tests
Loading Increment Load per Bar (kips) Representative Pressure (psf)
1 1.24 100
2 2.48 200
3 3.72 300
4 4.96 400
5 6.2 500
6 7.44 600
7 8.68 700
8 9.92 800
9 11.16 900
10 12.4 1000
11 13.64 1100
12 15 1200
13 13.64 1100
14 12.4 1000
15 11.16 900
16 9.92 800
17 8.68 700
18 7.44 600
19 6.2 500
20 4.96 400
21 3.72 300
22 2.48 200
23 1.24 100
Figure 86: Loading History of Prestressing Tests
Pressure distributions are displayed for both the locations of pressure cells. Location “A” refers to the cells stacked closer to the access shaft, as shown in the plan view of the figure on the preceding pages. Location “B” represents the cells opposite location “A” with respect to the center of the pit. As is evidenced in the pressure results, locations “A” and “B” showed different pressure gradients. One of the main reasons for this is that the sand was initially more compact on the north end of the pit since it was dumped here and pulled back to the south end during the filling of the pit. As a result, the top plates settled slightly
Figure 91: Soil Pressures from Prestressing with Middle Steel Plate, Location "A" during Loading Phase (100 psf to 1200 psf)
Figure 93: Soil Pressures from Prestressing with Middle Steel Plate, Location "B" during Loading Phase (100 psf to 1200 psf)
Figure 95: Soil Pressures from Prestressing with Middle Steel Plate, Lateral Boundary Confining Pressure from Wall Mounted Cells during Loading Phase (100 psf to 1200 psf)
As evidenced from the plots above, there is a distinct kink in the curves at a depth of approximately four to five feet (approximately 4 feet below top of soil). This local maximum represents the elevation at which the contact stresses become negligible and the full
surcharge load is dispersed evenly to the soil. There are a couple possible reasons for the difference in stress increases from location “A” to location “B.” The primary explanation between the differences is due to rotation of the plate as the load was applied. The south end of the top plates experienced more settlement than the north end. Since sand was dumped into the pit from the north end, this side was originally more compact than the opposite end where sand was raked back to create a level loading surface. Therefore, this south side was not as dense at the beginning of testing and allowed for more settlement than the north, resulting in slightly different stress increase profiles.
Figure 97: Increase in Vertical Soil Pressures from Prestressing without Middle Steel Plate, Location "A," Loading Phase (100 psf to 1200 psf)
Figure 99: Increase in Vertical Soil Pressures from Prestressing without Middle Steel Plate, Location "B," Loading Phase (100 psf to 1200 psf)
Figure 101: Increase in Soil Pressures from Prestressing without Middle Steel Plate, Boundary Confining Pressure from Wall Mounted Cells during Loading Phase (100 psf to
Figure 102: Increase in Soil Pressures from Prestressing without Middle Steel Plate, Boundary Confining Pressure from Wall Mounted Cells during Unloading Phase (1200 psf to
zero)
wall that was in contact with the soil, significant frictional resistance was developed along this boundary.
The above discussion presents the effectiveness of using the sandwich concept to prestress soil and increase pressures throughout the profile. Total soil stresses are calculated by adding the increase in pressure due to prestressing to the original undisturbed stresses due to unit weight of the sand. Static stresses based on sand weight of 100 pcf in addition to the increase in stress due to prestressing are provided in the graphs below. Therefore, total stresses are calculated by simply adding the unit weight times the depth to the measured increase in stress. The first set of graphs show total vertical soil stresses for prestressing tests including the middle steel plate while the second set of graphs show total vertical soil
stresses for prestressing tests without the middle steel plate.
Figure 104: Total Vertical Soil Pressures with Middle Steel Plate, Location "A", Unloading Phase (1200 psf to zero)
Figure 106: Total Vertical Soil Pressures with Middle Steel Plate, Location "B", Unloading Phase (1200 psf to zero)
Figure 108: Total Vertical Soil Pressures without Middle Steel Plate, Location "A", Unloading Phase (1200 psf to zero)
Figure 110: Total Vertical Soil Pressures without Middle Steel Plate, Location "B", Unloading Phase (1200 psf to zero)
Figure 111: Total Horizontal Soil Pressures, Location "A", Loading Phase (zero to 1200 psf)
Figure 113: Total Horizontal Soil Pressures, Location "B", Loading Phase (zero to 1200 psf)