in the population sciences published by the Max Planck Institute for Demographic Research Konrad-Zuse Str. 1, D-18057 Rostock · GERMANY www.demographic-research.org
DEMOGRAPHIC RESEARCH
VOLUME 17, ARTICLE 26, PAGES 775-802
PUBLISHED 20 DECEMBER 2007
http://www.demographic-research.org/Volumes/Vol17/26/ DOI: 10.4054/DemRes.2007.17.26
Research Article
Fertility differences by housing type: The effect
of housing conditions or of selective moves?
Hill Kulu
Andres Vikat
Special Collection 6: Interdependencies in the Life Course, edited by Hill Kulu and Nadja Milewski.
© 2007 Kulu & Vikat
This open-access work is published under the terms of the Creative Commons Attribution NonCommercial License 2.0 Germany, which permits use, reproduction & distribution in any medium for non-commercial purposes, provided the original author(s) and source are given credit.
1 Introduction 776
2 Data and variables 779
3 Methods 781
4 Results 782
5 Conclusion and discussion 790
6 Acknowledgements 792
References 793
Appendix 1 796
Appendix 2 798
Fertility differences by housing type:
The effect of housing conditions or of selective moves?
Hill Kulu1
Andres Vikat2
Abstract
This study examines fertility variation across housing types and childbearing patterns following housing changes. While the effect of family changes on housing choices has been studied in detail, little is known about childbearing patterns within various housing types, and this despite the fact that many studies suggest housing to be an important determinant of fertility. We use longitudinal register data from Finland and apply hazard regression. First, we observe a significant variation in fertility levels across housing types – fertility is highest among couples living in single-family houses and lowest among those residing in apartments, with the variation remaining significant even after controlling for the demographic and socio-economic characteristics of women. Second, our results show elevated fertility levels after couples have changed dwellings, suggesting that much of the fertility variation across housing types is attributed to selective moves. Third, the study reveals a relatively high risk of third birth for couples in single-family houses several years after the move. This suggests that living in spacious housing and in a family-friendly environment for a relatively long time leads to higher fertility.
1 Max Planck Institute for Demographic Research, Konrad-Zuse-Straße 1, 18057 Rostock, Germany.
E-mail: [email protected]
1. Introduction
There is a long research tradition that looks at the effects of family changes on spatial mobility and housing choices in Europe and North America. Previous studies showed that an increase in family size leads to a reduction in the desire and chances to make long-distance moves, particularly to urban destinations (Sandefur and Scott 1981, Courgeau 1989, White et al. 1995, Kulu 2005, 2007). The birth of a child significantly increases the propensity of couples to move short distances because they wish to adjust their dwelling size to their family size (Clark et al. 1984, Courgeau 1985, Deurloo et al. 1994, Davies Withers 1998, Clark and Huang 2003, cf. Murphy 1984). Recent studies on the timing of moves relative to childbearing revealed that many couples move when waiting for their child to be born (Mulder and Wagner 1998, Michielin and Mulder 2005, Kulu 2007). Some researchers argued that couples increasingly move in anticipation of childbearing, particularly those that move to home-ownership and to single-family houses (Feijten and Mulder 2002).
While it is not surprising that family events are important triggers of housing transition, it is less clear to what extent a change of housing or of housing conditions shapes the childbearing patterns of couples. Naturally, the question is not new, and it challenged researchers as early as in the 1930s when below-replacement fertility emerged in several European countries (Chesnais 1992). For example, Goodsell (1937) examined the causes of low fertility in Sweden and argued that home overcrowding was partly responsible for low fertility in the urban areas of Sweden. Swedish architects and builders, in their zeal to re-house urban workers in modern flats, produced a standardised tenement of one room and kitchen, and this might have forced couples to consider limiting their family size, particularly as more spacious, convenient, and inexpensive housing remained unattainable for many couples (Goodsell 1937: 855).
Thompson (1938) suggested that similar conditions might have existed in the U.S. The author argued that the availability of adequate housing at a desired standard was an important factor in determining the number of children reared in many families: ‘There can be little doubt that housing which costs so much that a family cannot afford the space it considers proper for its position, if it has several children, will tend to discourage the rearing of more than one or two children, or, indeed, any children at all. Under present conditions, where many families must live in one or two or three rooms in order to keep their housing expenditures within bounds, it is not surprising that they feel they can afford at most only one or two children’ (Thompson 1938: 363).
lower-middle-class and upper-working-lower-middle-class couples who were faced with the tight housing market of the city. They attributed the fertility reduction largely to psychological factors, arguing that apartments create a feeling of subjective crowding for reasons which go beyond the degree of objective density: the lack of yards, the sharing of noise and odours, and the knowledge that room expansion is impossible (Felson and Solauns 1975: 1425).
A few years later, Curry and Scriven (1978) carried out a similar study among a sample of the mid-West urban population in the United States. Contrary to the study by Felson and Solauns, the authors found that apartment living did not decrease fertility. They argued that apartment living does not lead to lower fertility when the housing market is open, i.e., when couples can increase their living space through residential mobility. However, their study also revealed higher fertility for couples living in dwellings that have more rooms (Curry and Scriven 1978: 483). Paydarfar (1995) re-examined the effect of housing type on fertility among a sample of residents of four Iranian cities. The study supported the view that, in the context of a tight housing market, married couples living in single-family housing had a significantly higher desired and actual fertility than couples living in multi-family housing units, regardless of their major socio-economic and demographic variables. Furthermore, the analysis revealed that the housing type had a greater effect on fertility than the education level of the wife and husband.
More recent research has paid attention to the effects of housing tenure on childbearing, producing mixed findings. Murphy and Sullivan (1985) examined fertility in post-war Britain and found that home-owners had their first child later and that the overall family size remained smaller than that of renters. They attributed the differences to the fact that couples who wished to become home-owners often delayed family formation until they had saved up sufficient funds for a deposit and until their income was large enough to pay for a mortgage. The postponement of childbearing might itself lead to lower fertility; significant housing costs foreseen for a longer period possibly also lead couples to consider having fewer children. Interestingly, the study revealed that the type of housing had an effect on childbearing independent of housing tenure: couples who lived in single-family dwellings had a higher fertility than those who lived in apartments (Murphy and Sullivan 1985: 231).
subsequent study on parity-progression ratios by housing tenure showed that, compared to renters, home-owners had higher parity progression ratios, particularly from parity two to three.
Several recent studies have examined the timing of family formation relative to housing-related moves, particularly moves to home-ownership. In their comparative research on West Germany and the Netherlands, Mulder and Wagner (2001) examined the interconnections between first childbirth and first-time home-ownership. The analysis showed an elevated risk of first birth a year after moving to owner-occupied housing. They argued that elevated fertility levels after becoming a home-owner indicate that couples bought their homes because they aspire to have children (Mulder and Wagner 1998: 158). The subsequent study by Michielin and Mulder (2005) supported increasing fertility levels for Dutch couples after short-distance moves, which the authors attributed to housing changes in anticipation of childbearing.
In her two recent essays on the interconnections between housing and population, Mulder (2006a, 2006b) seems to take a more ‘structuralist’ view. She argued that an elevated fertility for couples after they have moved to owner-occupied housing is not so strongly related to moves to have children. Rather, childbearing is postponed until home-ownership becomes possible. This is because couples prefer to secure housing of a certain quality before they have children. She also establishes a link between childbearing and the housing market, suggesting that the best opportunities to have children are provided in countries where housing quality is high or diverse and access to housing is easy. The least opportunities may be found in situations where high quality of housing stock is combined with access difficulties of young people (2006b: 408– 409).
‘subjective crowding’ even when the size is not smaller than the size of single-family houses (Felson and Solauns 1975).
Second, fertility among couples who have changed dwellings, particularly among movers to single-family houses, is expected to be higher because of selective residential moves. Previous research has shown that many couples change their housing situation when waiting for their child to be born (Mulder and Wagner 1998, Michielin and Mulder 2005, Kulu 2007). Furthermore, some couples may move with the intention of having a child – they decide to change dwellings in order to provide better conditions for that child (Michielin and Mulder 2005). We may expect such couples to be over-represented among movers to single-family houses, particularly if couples plan to have their second or third child. We may observe higher fertility in single-family houses also because some couples postpone first childbearing or having a further child until an opportunity to move to single-family houses opens up (Mulder 2006a, 2006b). The major question of this study is to examine the extent to which fertility variation across housing types results from selective residential moves, and to find out the extent to which housing conditions play a role.
2. Data and variables
The data stem from the Finnish Longitudinal Fertility Register. It is a database developed by Statistics Finland and contains linked individual-level information from different administrative registers (for details, see Vikat 2004). The extract we used in the analysis includes the full birth and educational histories of women. Partnership, residential and housing histories, and annually measured characteristics about women’s activity and income were taken for the 1987–2000 period. The extract used is a ten-percent random sample stratified by single-year birth cohort, drawn from records of all women who had ever received a personal identification number in Finland and who were aged 16 to 49 for at least some of the time between 1988 and 2000 (cohorts born between 1938 and 1983). We focus on the childbearing of women in union and include in the analysis all co-residential unions that were formed between 1988 and 20003. Foreign-born women (3 percent) were excluded from the analysis.
We studied the impact of housing type on first, second, and third birth, distinguishing between the housing categories as follows: single-family house, terraced
house, and apartment. A dwelling for one or two families is defined as single-family
3 Childbearing outside union is uncommon in the Nordic countries. If it occurs, it is mostly related to
house (or ‘detached house’). Terraced house (or ‘rowhouse’) is a dwelling with three or more houses in a row of houses and sharing a wall with its adjacent neighbour. Apartments (‘flats’) are housing units in a dwelling that have three or more residential units, with at least one unit being on top of another. Residential episodes of couples in all other housing units (and abroad) are excluded as they form a negligible share (about 5 percent) of all couple-years.
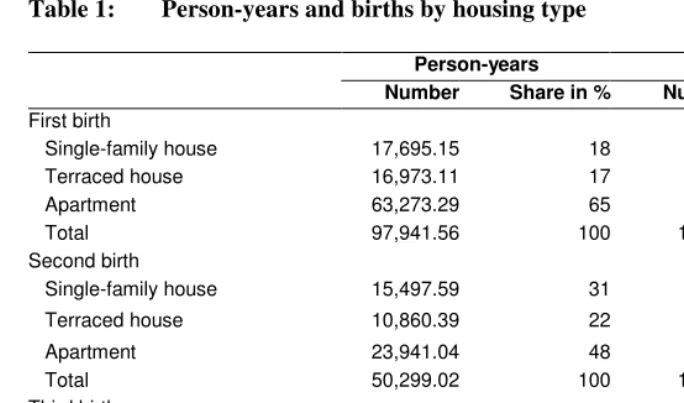
Table 1 presents the distribution of person-years (exposures) and events (occurrences) across various housing types. We see that the largest housing category for the first two births was the apartment, followed by the single-family house and the terraced house. The share of person-years spent in apartments decreased when looking at the data on third birth, showing the effect of selective migration and obviously also of different fertility levels by housing type. There were 14,258 first births for 35,391 women, 12,097 second births for 23,154 women and 4120 third births for 17,246 women in the data. The data-set for second and third birth includes women who had their first or second conception (leading to birth) in 1988 or later, but did so before union formation as well as women who had their first or second conception (leading to birth) before 1988 but formed another union in 1988 or later.
We controlled for a set of demographic and socio-economic variables when examining the effect of housing on childbearing. First, we included in the analysis union duration and a variable showing whether the union was a marital union or not. Second, we controlled for the woman’s age and the age of the youngest child (if any). We included in the analysis calendar time, language (Finnish- or Swedish-speaker), and settlement of residence (large urban, medium urban, small urban or rural)4. Finally, we controlled for educational enrolment (not enrolled or enrolled) and educational level (lower secondary, upper secondary, vocational, lower tertiary, or upper tertiary) of the woman and her annual earnings (none, low, medium, high, or very high).
4 We distinguished the types of settlement according to the size of the municipality of residence: 1) large
Table 1: Person-years and births by housing type
Person-years Births
Number Share in % Number Share in %
First birth
Single-family house 17,695.15 18 3328 23
Terraced house 16,973.11 17 2956 21
Apartment 63,273.29 65 7974 56
Total 97,941.56 100 14,258 100
Second birth
Single-family house 15,497.59 31 4149 34
Terraced house 10,860.39 22 2866 24
Apartment 23,941.04 48 5082 42
Total 50,299.02 100 12,097 100
Third birth
Single-family house 23,106.45 46 2064 50
Terraced house 10,308.85 20 812 20
Apartment 17,270.40 34 1244 30
Total 50,685.70 100 4120 100
Source: Calculations based on Finnish Longitudinal Fertility Register, 1988–2000.
3. Methods
We used a multivariate event-history analysis (Hoem 1987, 1993, Blossfeld and Rohwer 1995), fitting a series of regression models for the hazard of first, second, and third birth. We modelled the time to conception (leading to birth) in order to measure the effect of housing conditions on childbearing decisions as precisely as possible. The basic model can be expressed as:
∑
+ +∑
+∑
+
= k k ik j j ij l il
i(t) y(t) z(u t) x w (t)
lnµ α βl , (1)
where µi(t) denotes the hazard of the first, second, or third conception (leading to birth)
for individual i and where y(t) denotes a piecewise linear spline that captures the impact of the baseline duration on the hazard5 (union duration or age of the youngest child).
5 We used a piecewise linear spline specification (instead of the widely used piecewise constant approach) to
The parameter zk(uik + t) denotes the spline representation of the effect of a time-varying
variable that is a continuous function of t with origin uik (e.g., the woman’s age or
calendar time). Parameter xij represents the values of a time-constant variable (e.g.,
language) and wil(t) is a time-varying variable whose values can change only at discrete
times (e.g., housing type or educational level).
4. Results
Table 2: Relative risks of conception leading to first birth
Model 1 Model 2 Model 3
Current housing
Single-family house 1.53*** Terraced house 1.36***
Apartment 1
Non-movers in single-family house 1.57*** 1.25*** Movers in single-family house 1.83*** 1.46*** Non-movers in terraced house 1.36*** 1.20*** Movers in terraced house 1.66*** 1.34***
Non-movers in apartment 1 1
Movers in apartment 1.29*** 1.17***
Type of last move
Residential move 1 1
Migration 0.97 0.91*
Number of moves
One move 1 1
Two or more moves 1.09** 1.05
Source: Calculations based on Finnish Longitudinal Fertility Register, 1988–2000.
Significance: '*'=5%; '**'=1%; '***'=0.1%.
Models 1 and 2: controlled for union duration and women’s age.
Model 3: additionally controlled for marital status, calendar time, language, settlement of residence, educational level and enrolment, and earnings.
In the third model, we controlled for the marital status, the socio-economic characteristics of women, and their settlement of residence. The differences between the various groups decreased considerably, but remained significant. A closer inspection showed that much of the decrease can be attributed to the marital status: married couples were over-represented among movers and among couples in single-family houses (also in terraced houses). Further, couples who live in the region of the capital city had a lower risk of first conception than couples residing in other settlements. The fertility variation by housing and moving categories, however, was rather similar in the different settlements.
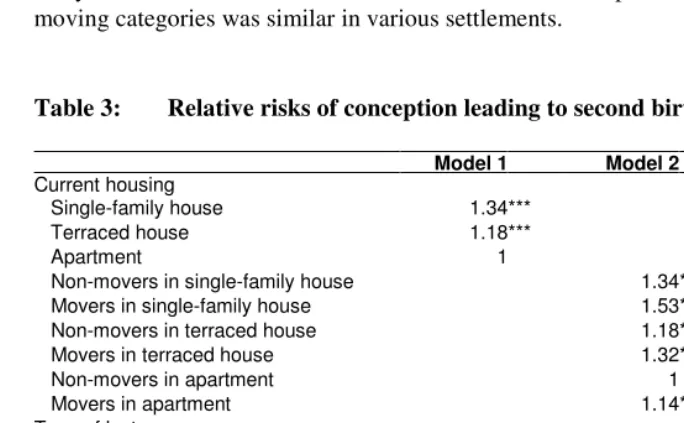
second and subsequent episodes, and included in the analysis other moving-related variables, such as whether or not a couple moved after the first birth. We see that, first, couples living in single-family houses had the highest risk of second conception while couples residing in apartments had the lowest risk, as could be expected. Second, couples who moved (before or after first birth) had a significantly higher risk in all three housing types. Third, couples who moved after the first birth did not show a higher risk of second conception compared to those who moved before first birth.
In the third model, we controlled for the marital status and for the socio-economic characteristics of the women and their settlement of residence. We see that the fertility differences between couples in various housing categories only slightly decreased, and that they were then similar to what was observed for first birth. Again, our further analysis revealed that the variation in the second conception levels by housing and moving categories was similar in various settlements.
Table 3: Relative risks of conception leading to second birth
Model 1 Model 2 Model 3 Current housing
Single-family house 1.34***
Terraced house 1.18***
Apartment 1
Non-movers in single-family house 1.34*** 1.24*** Movers in single-family house 1.53*** 1.43*** Non-movers in terraced house 1.18*** 1.11** Movers in terraced house 1.32*** 1.24***
Non-movers in apartment 1 1
Movers in apartment 1.14*** 1.12**
Type of last move
Residential move 1 1
Migration 1.07 1.03
Number of moves
One move 1 1
Two or more moves 1.02 1.01
Moves after first birth
No moves 1 1
One or more moves 1.02 1.03
Source: Calculations based on Finnish Longitudinal Fertility Register, 1988–2000.
Significance: '*'=5%; '**'=1%; '***'=0.1%.
Models 1 and 2: controlled for union duration, women’s age, and the age of the first child.
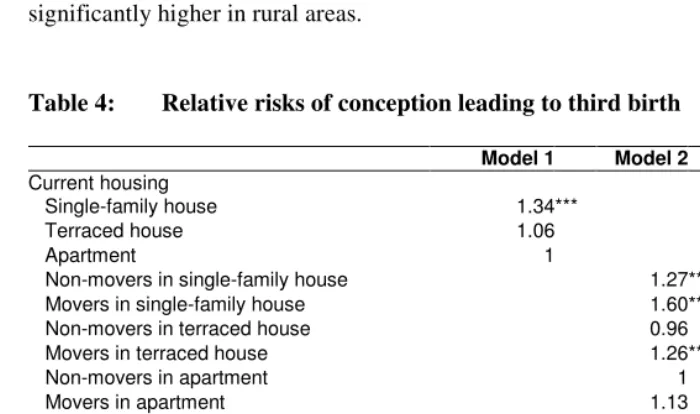
Finally, Table 4 presents the models on third birth. Couples residing in single-family houses had a 34% higher risk of third conception than couples living in apartments, while the risk of couples in terraced houses did not differ from that of couples in apartments. Couples who had moved together (before or after second birth) had a significantly higher risk of third birth in all three housing types, particularly when the move was over a long distance. Couples who had moved after second birth, however, did not show a higher risk of third conception compared to those who had moved to their current dwelling before the birth of their second child. Again, the fertility differences between couples in various housing types and between movers and non-movers only slightly decreased after we controlled for the marital status, for the socio-economic characteristics of women, and for their settlement of residence. Our further analysis showed that the variation in the risk of third conception by housing and moving categories was similar in various settlements, but that the risk levels were significantly higher in rural areas.
Table 4: Relative risks of conception leading to third birth
Model 1 Model 2 Model 3
Current housing
Single-family house 1.34***
Terraced house 1.06
Apartment 1
Non-movers in single-family house 1.27*** 1.14* Movers in single-family house 1.60*** 1.48***
Non-movers in terraced house 0.96 0.91
Movers in terraced house 1.26** 1.20*
Non-movers in apartment 1 1
Movers in apartment 1.13 1.13
Type of last move
Residential move 1 1
Migration 1.21*** 1.14*
Number of moves
One move 1 1
Two or more moves 1.05 1.05
Moves after second birth
No moves 1 1
One or more moves 1.05 1.06
Source: Calculations based on Finnish Longitudinal Fertility Register, 1988–2000.
Significance: '*'=5%; '**'=1%; '***'=0.1%.
Models 1 and 2: controlled for union duration, women’s age, and the age of the second child.
The analysis thus shows that the risk of conception (leading to birth) significantly varied across housing types, even after we controlled for the demographic and socio-economic characteristics of the women. It revealed that the risk was high when couples had changed their housing compared to when they lived in their first shared housing. Can we conclude from the analysis that moving to new housing, particularly to a single-family house, increased fertility levels? The answer is: probably not or probably not yet – we should address the issue of selective residential moves by looking at the timing of childbearing after the change of dwelling.
There are several possible shapes for the conception risk after the move, suggesting different directions of causality in the housing-fertility relationship. We may observe elevated conception levels right after the move and decreasing risk levels thereafter. This pattern would suggest that many moves were made by couples with an intention of having a child – the couples who moved are mainly those who planned to have a child soon. We may also observe gradually increasing fertility levels over time rather than an elevated fertility right after the move. This pattern would suggest that new (and better) dwelling led to increasing fertility – there was thus a real effect of the housing conditions. Finally, we may observe simultaneously an elevated fertility immediately after the move and gradually increasing fertility levels later, suggesting a mixture of the two effects.
Figure 1: Relative risks of conception leading to first birth (Model 4)
0.75 1.00 1.25 1.50 1.75
0 0.5 1 1.5 2 2.5 3 3.5 4
Years since move
R
e
la
ti
v
e
r
is
k
Movers in single-family house Non-movers in single-family house Movers in terraced house Non-movers in terraced house Movers in apartment Non-movers in apartment
Source: Calculations based on Finnish Longitudinal Fertility Register, 1988–2000.
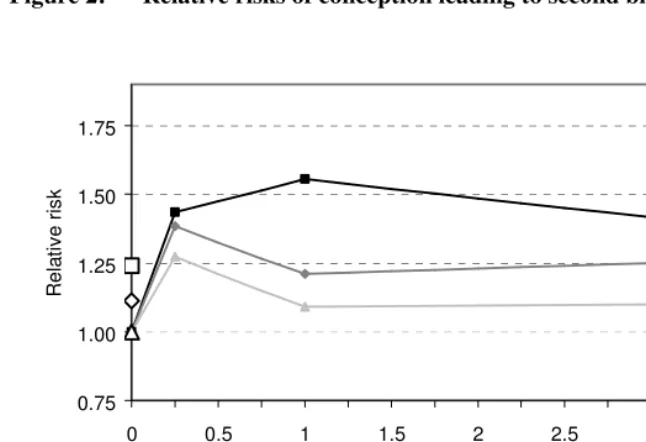
The patterns of second conception were not very different. Again, the risk of conception significantly increased during the first months after moving to new housing, although it is only couples in single-family houses that also showed a relatively high fertility during the second part of the first year (see Figure 2). Couples who moved after the birth of their first child with an intention of having another child were responsible for elevated fertility levels after moving to a new dwelling. The couples thus moved with the aim to adjust their dwelling size to their family size, partly in anticipation of a further increase in the size of their family.
Elevated fertility levels were related to the couples who moved after the birth of their second child with an intention of having another child; couples who intended to have a third child were obviously more likely to move to single-family houses.
Figure 2: Relative risks of conception leading to second birth (Model 4)
0.75 1.00 1.25 1.50 1.75
0 0.5 1 1.5 2 2.5 3 3.5 4
Years since move
R
e
la
ti
v
e
r
is
k
Movers in single-family house Non-movers in single-family house Movers in terraced house Non-movers in terraced house Movers in apartment Non-movers in apartment
Source: Calculations based on Finnish Longitudinal Fertility Register, 1988–2000.
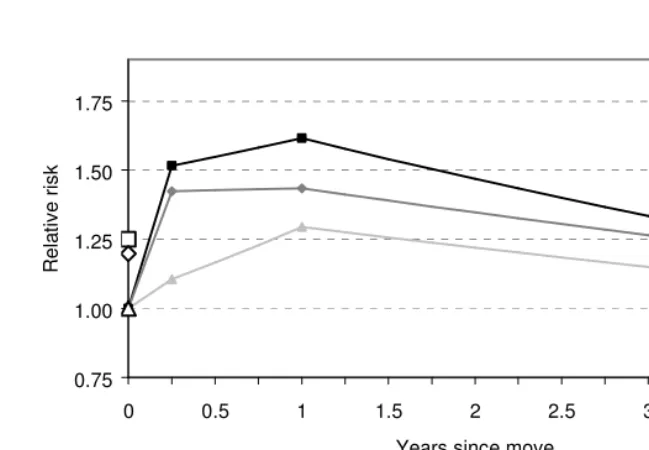
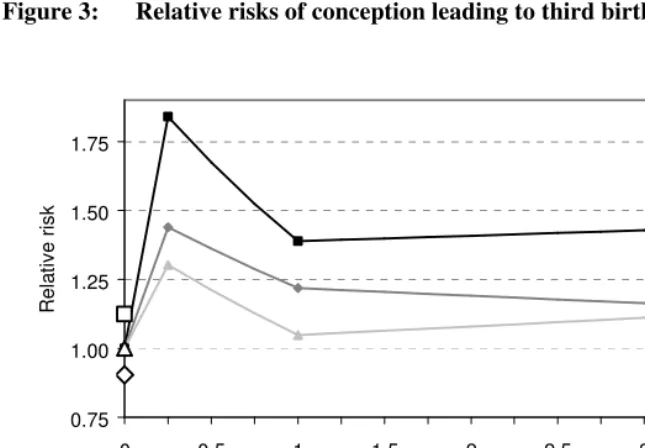
However, we see that couples in single-family houses still had a relatively high risk of third conception two, three, and four years after the move to a new dwelling. Couples who had moved to the current dwelling before their second or first child had been born were over-represented here because they could not contribute to very short durations in our hazard model6; while many (or at least a significant part of those) who had moved after second birth, in turn, had the third conception right after the move;
6 For example, the couples who had moved to the current dwelling three months prior to second conception
they thus left the risk population. There were thus two subpopulations acting differently in terms of childbearing. A high risk of third conception for couples in single-family houses seems to suggest that some couples who had a desire to live in single-family housing (many couples had this) and who could fulfil this desire then decided to have another (or third) child after having lived for some time in the new spacious dwelling, with a family-friendly environment, i.e., with many families in the neighbourhood.
Figure 3: Relative risks of conception leading to third birth (Model 4)
0.75 1.00 1.25 1.50 1.75
0 0.5 1 1.5 2 2.5 3 3.5 4
Years since move
R
e
la
ti
v
e
r
is
k
Movers in single-family house Non-movers in single-family house Movers in terraced house Non-movers in terraced house Movers in apartment Non-movers in apartment
5. Conclusion and discussion
In this study, we examined fertility variation across housing types and childbearing patterns after housing changes. Contrary to previous studies, we used longitudinal data, allowing for a detailed examination of the direction of causality in the housing fertility relationships. We observed a significant variation in the fertility levels across housing types – fertility was the highest among couples in single-family houses and the lowest among those in apartments. The fertility variation decreased but remained significant after we controlled for the demographic and socio-economic characteristics of women. Further, our analysis showed elevated fertility levels after couples had changed their housing, suggesting that much of the fertility variation we observed across housing types is attributed to selective moves. Finally, there are relatively high risks of third birth for couples who live in single-family houses several years after the move to a new dwelling, suggesting that living in spacious housing and in a family-friendly environment for a longer time leads some couples to consider having a third child.
Our study thus shows that much of the initial fertility variation across housing types is attributed to selective moves, although housing conditions also might have played a role, particularly for the transition from second to third child. Several issues still remain and they need further discussion. First, the study shows that fertility levels varied by housing type even for couples who had not changed their housing, although the variation here was smaller than for couples who had moved. At first, we may interpret this as evidence in support of the view that housing conditions indeed shaped childbearing patterns. However, it is likely that the higher fertility levels for the first births for non-movers in single-family and terraced houses is also attributed to selective moves: women whose union was formed as a clear step to family formation were more likely to start their co-residence in single-family or terraced houses, whereas women who did not have any childbearing plans were more likely to move into apartments with their partner.
third birth for couples living in single-family houses. For example, couples who were likely to have three children might have simply moved to single-family houses at some stage in their life because of their desires, indicating an unobserved selection of family-oriented couples into single family houses.
Further research should explicitly examine the extent to which the characteristics of the partner can explain fertility variation across housing types. It should also test whether family-oriented couples were over-represented in single-family houses by simultaneously modelling fertility and housing choices of couples. If it turns out that the characteristics of couples does not explain the relatively high levels of third birth in single-family houses, then we should proceed to examine the essence of the housing effect in more detail – whether high third birth risks in single-family houses is attributed to the socio-spatial environment (e.g., the suburban context for the cities and towns) or whether the housing characteristics do indeed play a decisive role.
Comparative studies, no doubt, would provide further insights into the interplay between housing and fertility. This study was carried out in a Northern European country that has housing options for young couples and where access to single-family houses is relatively easy because of the wide availability of mortgages (Mulder 2006a). The context explains our interpretation that elevated fertility levels after couples had changed their housing are largely related to the moves made by couples with an intention of having a child. Obviously, similar elevated fertility patterns exist in other European countries (cf. Michielin and Mulder 2005, Kulu 2007). The mechanism behind the patterns, however, may be different if housing options are very limited – couples may delay their childbearing (or wait before having another child) until proper housing becomes attainable rather than simply move to proper housing when they decide to have a child. Whether there is more ‘choice’ or rather more ‘structure’ in the agency-structure interplay may thus depend on the prevailing housing regime in a country.
6. Acknowledgements
References
Blossfeld, H.-P., and G. Rohwer. 1995. Techniques of Event History Modeling: New Approaches to Causal Analysis. Mahwah: Lawrence Erlbaum Associates.
Chesnais, J.-C. 1992. The Demographic Transition: Stages, Patterns, and Economic Implications. Oxford: Clarendon Press.
Clark, W. A. V., M. C. Deurloo, and F. M. Dieleman. 1984. Housing consumption and residential mobility, Annals of the Association of American Geographer 74(1): 29–43.
Clark, W. A. V., and Y. Huang. 2003. The life course and residential mobility in British housing markets, Environmental and Planning A 35: 323–339.
Courgeau, D. 1985. Interaction between spatial mobility, family and career life-cycle: a French survey, European Sociological Review 1(2): 139–162.
Courgeau, D. 1989. Family formation and urbanization, Population: An English Selection 44(1): 123–146.
Curry, J. P., and G. D. Scriven. 1978. The relationship between apartment living and fertility for Blacks, Mexican-Americans, and other Americans in Racine, Wisconsin, Demography 15(4): 477–485.
Davies Withers, S. 1998. Linking household transitions and housing transitions: a longitudinal analysis of renters, Environment and Planning A 30: 615–630.
Deurloo, M. C., W. A. V. Clark, and F. M. Dieleman. 1994. The move to housing ownership in temporal and regional contexts, Environment and Planning A 26: 1659–1670.
Feijten, P., and C. H. Mulder. 2002. The timing of household events and housing events in the Netherlands: a longitudinal perspective, Housing Studies 17(5): 773–792.
Felson, M., and M. Solauns. 1975. The fertility-inhibiting effect of crowed apartment living in a tight housing market, The American Journal of Sociology 80(6): 1410–1427.
Goodsell, W. 1937. Housing and birth rate in Sweden, American Sociological Review 2(6): 850–859.
Hoem, J. M. 1993. Classical demographic models of analysis and modern event-history techniques, IUSSP: 22nd International Population Conference, Montreal, Canada, Volume 3, pp. 281–291.
Krishnan,V. 1988. Homeownership: its impact on fertility. Research Discussion Paper 51. Edmonton: The University of Alberta, Department of Sociology.
Krishnan, V. 1995. Effect of housing tenure on fertility, Sociological Spectrum 15(2): 117–129.
Kulu, H. 2005. Migration and fertility: competing hypotheses re-examined, European Journal of Population 21(1): 51–87.
Kulu, H. 2007. Fertility and spatial mobility in the life-course: evidence from Austria, Environment and Planning A (advance online publication).
Michielin, F., and C. Mulder. 2005. Fertility Choices of Couples and Relocations in the Life Course. Paper presented for the IUSSP 25th International Population Conference in Tours, France, July 18–23, 2005.
Mulder, C. H. 2006a. Home-ownership and family formation, Journal of Housing and
the Built Environment 21(3): 281–298.
Mulder, C. H. 2006b. Population and housing: a two-sided relationship, Demographic Research 15(13): 401–412. www.demographic-research.org/Volumes/Vol15/13/ default.htm.
Mulder, C. H., and M. Wagner. 1998. First-time home-ownership in the family life course: a West German-Dutch comparison, Urban Studies 35(4): 687–713.
Mulder, C. H., and M. Wagner. 2001. The connections between family formation and first-time home ownership in the context of West Germany and the Netherlands, European Journal of Population 17: 137–164.
Murphy, M. J. 1984. The influence of fertility, early housing-career, and socio- economic factors on tenure determination in contemporary Britain, Environment and Planning A 16: 1303–1318.
Murphy, M. J., and O. Sullivan. 1985. Housing tenure and family formation in contemporary Britain, European Journal of Population 1(3): 230–243.
Paydarfar, A. A. 1995. Effects of multi-family housing on marital fertility in Iran: population policy implications, Social Biology 42(3–4): 214–225.
Sandefur, G. D., and W. J. Scott. 1981. A dynamic analysis of migration: an assessment of the effects of age, family and career variables, Demography 18(3): 355–367.
Thompson, W. S. 1938. The effect of housing upon population growth, The Milbank Memorial Fund Quarterly 16(4): 359–368.
Vikat, A. 2004. Women’s labor force attachment and childbearing in Finland,
Demographic Research Special Collection 3(8): 175–211.
www.demographic-research.org/special/3/8/default.htm.
Appendix 1: Log-risks of conception leading to first birth
Variable Model 1 Model 2 Model 3 Model 4
Housing and moves
Current housing
Single-family house 0.424*** Terraced house 0.306***
Apartment 0
Non-movers in single-family house 0.448*** 0.225*** 0.223*** Movers in single-family house 0.602*** 0.376***
0–0.25 years (slope)a 1.665***
0.25–1 years (slope) 0.085
1+ years (slope) –0.096***
Non-movers in terraced house 0.310*** 0.183*** 0.181*** Movers in terraced house 0.508*** 0.290***
0–0.25 years (slope) 1.412***
0.25–1 years (slope) 0.010
1+ years (slope) –0.063*
Non-movers in apartment 0 0 0
Movers in apartment 0.255*** 0.155***
0–0.25 years (slope) 0.404
0.25–1 years (slope) 0.209*
1+ years (slope) –0.059*
Type of last move
Residential move 0 0 0
Migration –0.030 –0.099* –0.092*
Number of moves
One move 0 0 0
Two or more moves 0.089** 0.052 0.037
Demographic variables
Union duration (baseline)
Constant –2.467*** –2.480*** –0.933*** –0.911*** 0–1 years (slope)a –0.171*** –0.230*** –0.275*** –0.280*** 1–3 years (slope) 0.060*** 0.020 0.036*** 0.027 3–5 years (slope) –0.017 –0.037 0 0.014 5+ years (slope) –0.142*** –0.153*** –0.092*** –0.075*** Marriage
Enter marriage (constant) 1.604*** 1.604***
0–3 years (slope) –0.281*** –0.281***
3+ years (slope) –0.137*** –0.132***
Age
Appendix 1: (Continued)
Variable Model 1 Model 2 Model 3 Model 4
Socio-economic variables
Year
1988–2000 (slope) –0.012 *** –0.012***
Language
Finnish 0 0
Swedish 0.127 ** 0.127**
Settlement
Large urban –0.101 *** –0.102***
Medium urban 0 0
Small urban 0.019 0.020
Rural –0.006 –0.003
Educational enrolment
Not enrolled 0 0
Enrolled –0.533 *** –0.533***
Educational level
Lower secondary 0.113 *** 0.113***
Upper secondary 0 0
Vocational 0.033 0.033
Lower tertiary 0.163 *** 0.163***
Upper tertiary 0.030 0.030
Earnings
None –0.419 *** –0.419***
Low –0.039 –0.038
Medium 0 0
High 0.033 0.032
Very high 0.056 0.057
Log-likelihood –91,067.4 –90,994.0 –87,920.2 –87,901.8
Source: Calculations based on Finnish Longitudinal Fertility Register, 1988–2000.
Significance: '*'=5%; '**'=1%; '***'=0.1%.
a – For linear splines we present slope estimates which show how the hazard increases or decreases over a certain time period. For
Appendix 2: Log-risks of conception leading to second birth
Variable Model 1 Model 2 Model 3 Model 4
Housing and moves
Current housing
Single-family house 0.296*** Terraced house 0.164***
Apartment 0
Non-movers in single-family house 0.291*** 0.216*** 0.215*** Movers in single-family house 0.427*** 0.356***
0–0.25 years (slope) 1.445***
0.25–1 years (slope) 0.108
1+ years (slope) –0.047*
Non-movers in terraced house 0.163*** 0.108** 0.107** Movers in terraced house 0.279*** 0.218***
0–0.25 years (slope) 1.302***
0.25–1 years (slope) –0.179
1+ years (slope) 0.016
Non-movers in apartment 0 0 0
Movers in apartment 0.131*** 0.110**
0–0.25 years (slope) 0.966***
0.25–1 years (slope) –0.205*
1+ years (slope) 0.004
Type of last move
Residential move 0 0 0
Migration 0.071 0.031 0.031
Number of moves
One move 0 0 0
Two or more moves 0.015 0.012 0.008
Moves after first birth
No move 0 0 0
One or more moves 0.019 0.034 0.019
Demographic variables
Time since first birth (baseline)
Constant –3.169*** –3.186*** –2.493*** –2.499*** 0–1 years (slope) 2.491*** 2.483*** 2.551*** 2.565*** 1–3 years (slope) –0.158*** –0.156*** –0.077*** –0.075*** 3–5 years (slope) –0.288*** –0.287*** –0.257*** –0.257*** 5+ years (slope) –0.091*** –0.091*** –0.082*** –0.082*** Union duration
Appendix 2: (Continued)
Variable Model 1 Model 2 Model 3 Model 4
Marriage
Enter marriage (constant) 0.519*** 0.521***
0–3 years (slope) –0.027 –0.028
3+ years (slope) –0.070*** –0.068***
Age
≤24 years (slope) 0.025 0.027* –0.018 –0.018 25–29 years (slope) –0.002 0.001 –0.025*** –0.025*** 30–34 years (slope) –0.041 *** –0.040*** –0.042*** –0.042*** 35+ years (slope) –0.191 *** –0.189*** –0.191*** –0.191***
Socio-economic variables
Year
1988–2000 (slope) –0.006 –0.006
Language
Finnish 0 0
Swedish –0.012 –0.012
Settlement
Large urban 0.008 0.007
Medium urban 0 0
Small urban 0.002 0.003
Rural 0.057 0.059
Educational enrolment
Not enrolled 0 0
Enrolled –0.380*** –0.381***
Educational level
Lower secondary –0.167*** –0.167***
Upper secondary 0 0
Vocational 0.106*** 0.105***
Lower tertiary 0.181*** 0.179***
Upper tertiary 0.151*** 0.150***
Earnings
None –0.304*** –0.305***
Low 0.057* 0.056*
Medium 0 0
High 0.017 0.016
Very high 0.125 0.127
Log-likelihood –68,903.6 –68,873.2 –68,445.6 –68,433.2
Source: Calculations based on Finnish Longitudinal Fertility Register, 1988–2000.
Appendix 3: Log-risks of conception leading to third birth
Variable Model 1 Model 2 Model 3 Model 4
Housing and moves
Current housing
Single-family house 0.294*** Terraced house 0.058
Apartment 0
Non-movers in single-family house 0.237*** 0.131* 0.117* Movers in single-family house 0.467*** 0.393***
0–0.25 years (slope) 2.438***
0.25–1 years (slope) –0.375**
1+ years (slope) 0.014
Non-movers in terraced house –0.046 –0.092 –0.102 Movers in terraced house 0.233** 0.185*
0–0.25 years (slope) 1.454*
0.25–1 years (slope) –0.221
1+ years (slope) –0.023
Non-movers in apartment 0 0 0
Movers in apartment 0.124 0.121
0–0.25 years (slope) 1.057*
0.25–1 years (slope) –0.289
1+ years (slope) 0.029
Type of last move
Residential move 0 0 0
Migration 0.188*** 0.134* 0.132*
Number of moves
One move 0 0 0
Two or more moves 0.051 0.050 0.050
Moves after second birth
No move 0 0 0
One or more moves 0.052 0.060 0.033
Demographic variables
Time since second birth (baseline)
Constant –2.485*** –2.467*** –2.714*** –2.727*** 0–1 years (slope) 1.932*** 1.913*** 1.960*** 1.980*** 1–3 years (slope) –0.084** –0.083** –0.045 –0.042 3–5 years (slope) 0.017 0.024 0.020 0.019 5+ years (slope) –0.068*** –0.069*** –0.059*** –0.059*** Union duration
Appendix 3: (Continued)
Variable Model 1 Model 2 Model 3 Model 4
Marriage
Enter marriage (constant) 0.320*** 0.320***
0–3 years (slope) –0.022 –0.021
3+ years (slope) 0.021 0.020
Age
≤24 years (slope) –0.066 –0.067 –0.068 –0.068 25–29 years (slope) –0.064*** –0.056*** –0.065*** –0.065*** 30–34 years (slope) –0.023* –0.019 –0.019 –0.019 35+ years (slope) –0.221*** –0.218*** –0.221*** –0.221***
Socio-economic variables
Year
1988–2000 (slope) 0.001 0.001
Language
Finnish 0 0
Swedish –0.090 –0.088
Settlement
Large urban –0.035 –0.038
Medium urban 0 0
Small urban 0.028 0.029
Rural 0.142** 0.144**
Educational enrolment
Not enrolled 0 0
Enrolled –0.295*** –0.294***
Educational level
Lower secondary –0.081 –0.081
Upper secondary 0 0
Vocational 0.016 0.017
Lower tertiary 0.250** 0.250**
Upper tertiary 0.066 0.065
Earnings
None –0.146* –0.147*
Low 0.152*** 0.151***
Medium 0 0
High –0.024 –0.023
Very high 0.228 0.232
Log-likelihood –28,067.8 –28,031.1 –27,959.4 –27,955.1
Source: Calculations based on Finnish Longitudinal Fertility Register, 1988–2000.