754
CAUSAL RELATION BETWEEN MACRO ECONOMY AND
INDUSTRIAL INDEX BASED ON REGRESSION ANALYSIS
HUA LI,ZHU WEN,
School of Business Administration, University of Science & Technology Liaoning, Anshan 114000,
Liaoning, China
ABSTRACT
With the expansion of stock market, investors and capital are increasing step by step, which makes the stock market an increasing impact on the macro-economy. In order to reveal the effect of macro factors on the specified industry’s stock price, a new nonlinear regression model is established with Eviews6.0 software in the paper. We take macro variables as samples which are based on interest rate adjusting (China has adjusted interest for 24 times from 1997 to June 8th, 2012), conducting an in-depth study of the industrial index on the Stock Exchange. The empirical result indicates that the industrial index has a negative correlation with interest rate, PPI, and a positive relation with CPI, industrial value added (IVA) growth rate and international crude oil price.
Keywords: Industrial Index, Macro Economic Variables, Regression Analysis
1. INTRODUCTION
Nowadays, the extent of economy
financialization continues to deepen as the global economy integration and financial deregulation. At the same time, along with the development of
information communication technology and
financial derivatives technology, financial market and innovation have entered into a high-speed developing period, and the financial transaction-costs reduced dramatically. Being an important part of the financial market, stock market is not only undertaking the capital-media function of financing and resource allocation, but also performing a function of economic forecasts and value discovery as a “barometer” in economic developing. Moreover, studying on the stock market fluctuation regularity and analyzing the stock price volatility are vital to the analysis of investors’ risk and income, regulators’ effective supervision, and achievements of shareholders’ maximum profit.
2. LITERATUREREVIEW
Modern economics had done a lot research on the shares and obtained that macro economic variable is one of the important factors of stock price volatility. Domestic and overseas scholars have made a lot of researches on the macro variables that work on stock price, which were from two aspects: theory and empirical.
A. It was generally believed that stock price was mainly influenced by macro-economic factors in the long time. Modigliani and Cohn pointed out that the stock price would fall when inflation was up in 1979[1]. In 1990, Schwert studied the relationship between stock yield and actual economic activities which from 1889 to 1988 in the U.S. stock market, and discovered that as the enlarging of sample, the yield rate had a very strong ability to predict economic operation in the future[2]. In 2004, Adams, Mc Queen & Wood analyzed the high-frequency data and proposed that the news of CPI and PPI had a significant influence on stock returns[3]. A quantitative research in 2005 was conducted by Bermanke and Kuttner with the method of mathematical and metrology on the reaction of U.S. stock market to interest rate variation. The study showed that the major stock price index rose 1% under the hypothesis of unforeseen decline in the federal funds rate by 0.25 basis points[4]. Guo Jinlong, Li Wenjun gained a negative correlation between stock equilibrium price and interest rate in 2004, from the research on influence of changes in interest on the stock market by using the arbitrage pricing model[5]. In 2007, Li Mingyang and Tang jianwei conducted an empirical study on the situation in China which indicated that stock price was affected by interest rate variation in our country, but the concrete effect of influence was uncertain since the problems in the transmission mechanism[6].
ISSN: 1992-8645 www.jatit.org E-ISSN: 1817-3195
755 Kavussanos observed the effects which a group of international risk variables worked on the returns of 38 industries in the world. The conclusion indicated that according to specific industrial characteristics, the factors apiece might produce distinct effects to different international industry returns[7]. It was discovered in the report of Stefano and Michael Aked, who investigated 36 industry base indexes of 21 developed countries listed on FTIS&P in 2000, which the importance of factors of industry might constantly improved while the disappear of trade factors[8]. In 1999, Wang Yaodong studied the relationship among sectors on stock market with the classification index, and then drew the conclusion: there existed an interaction among all the sector indexes except industrial [9]. Lao Lanfang, Shao Yumin employed the index on the Stock Exchange in 2005, and then the Kendall’s coefficient of concordance was utilized to test whether the cross-sectional volatility ranking of different industrial indexes remains stable over time. The conclusion revealed a consistent ranking in the volatility of the general industry and the specific volatility of each trade, namely, the volatility of the trades was stable [10].
Domestic Literatures are mostly involved in various factors on price volatility, and fail to reflect the relations between variables and industry classification indexes. However, effects of macro factors that worked on different industries will not be able perfectly reflected by the composite stock price. At the same time, as different industries have special features, it has different sensitivities to the factors, and then the sector indexes are different. So, this paper has discussed the effects that rate-adjusting brings to stock market in the view of industry level, and comprehensive analyzed those factors which cause the undulatory motion of the market in the combination of the macro economy meanwhile. From the point of rate-adjusting acts on stock price volatility, utilizing the empirical method with sample data of industrial index, the present paper is a general literature review which attempts to establish a multi-factors economic model to study the volatility of stock price, and to show the quantities factors that contribute to the fluctuation of the price.
3. EMPIRICALRESEARCHMETHOD
DESIGNING
3.1 Variable Selection And Theoretic-Al Hypothesis
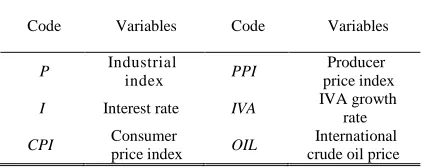
The industry classification index on Stock Exchange is taken as explained variable, while the
[image:2.612.313.524.162.246.2]interest rate, international crude oil price, industrial value added growth rate and other macro economic variables are considered as explanatory variables (all the variables listed on Table1).
TABLE I : Variables Recapitulation Statement
Code Variables Code Variables
P Industrial
index PPI
Producer price index
I Interest rate IVA IVA growth
rate
CPI Consumer
price index OIL
International crude oil price
A. Explanatory variables
a. Interest rate. Interest rate represents a country’s fiscal policy. Moreover, for the reason that interest rate is the basic factor in all financial factors which can affect stock price, and the influence of interest variation on stock market is directly and rapidly, so the movements of stock price are impacted by interest rate variation. Since the one-year deposit rate as the core in the policy on interest rate, so the empirical research in this paper would like to choose it as an indicator to measure the changes in interest rate.
Assumption (a): It is generally believed that the shares tend to drop as interest rate going higher while the decline in interest will encourages a rise in stock. So, the opposite relation between stock price and interest rate is assumed in the paper.
b. Inflation rate. In the operation of macro-economy, economic growth and currency stability are regarded as the main goals of Central Bank’s monetary policy of the countries in the world. Generally, a change in consumer price index (CPI) is employed to judge the extent of inflation by Central Bank. Then, as two inflation-indicators, the combined influences of CPI and PPI will be taken into account for the volatility stock price in the paper.
Assumption (b): Theoretical speaking, the rise of CPI indicates the increase in corporate profits and social purchasing power contains the stock purchasing. Namely, CPI and shares change in the same direction. While the rise in PPI shows that the enhance of the enterprise production costs, which means the profit space of enterprise and individual producers can obtain is compressed, and a decline in investors’ anticipate of the future corporate revenue, and then a fall in shares. That is PPI and stocks go into the opposite relationship.
756 considered as the index to reflect the operation of real economy. Therefore, the paper has selected the monthly growth rate of industrial value added as an indicator to the real economy.
Assumption (c): Theoretically, fluctuations of the shares and economic growth are generally in sync. The higher of IVA, the better running of real economy, and the more social wealth is produced.
d. International crude oil price. The oil has a multiply interaction with economy, for it not only can be regard as input factor, but also can be used as consumer goods. Huge demand and high fluctuation for petroleum have stimulated the world, and also have aroused an increasing wide attention and analysis. Due to the petroleum represents the overwhelming influence on industrial enterprises, the crude oil price has been regarded as an independent variable and the monthly averages of the WTI crude oil price in NYMEX for sample, to study the relations between oil price and stock market that represented by industrial index.
Assumption (d): The stock price is the discounted present value of the future net profit on the base of dividend discount model, first of all, petroleum is known as a vital production factor whose price fluctuation is able to cause the changes of enterprise costs and future flows, then leads to the profit variation; Second, the realization of changes in oil price is conducted by a conduction mechanism: “oil price-PPI-CPI-interest rate adjusting ”, which may give rise to the changes in discount rate of future income. In this way, the internal value of the shares will change and perform as an acute fluctuation in stock price.
B. Explained variables
The stock price performs as the same for insufficient number of listed company when a stock market in its infancy. As an adding to the quantity of company, the number of investors will increase at the same time, and then the differences among various industries are more obvious. So, the classification index appeared for the sake of accurate observation of the market. And the index is officially issued by SSE in May 3rd, 1993, and is divided into five categories according to the features: industrial, commercial, real estate, utilities and comprehensive industry, which have given a picture of the prosperity and shares volatility in different types of trades. With the rapid development of the market economy, our industrial enterprises have enough grown and occupied a pivotal role in the whole national economic system. And our country is “the world’s factory” for its continually progressed industry, so the industrial
index is chosen to research the volatility on stock price.
3.2 Sample Data Selecting And Process- Ing The interest is experienced several times rate-adjusting during the past 20 years’ development of stock market, and the previous rate adjustments will not be considered in the paper for it is happening in the developing stock market. The rate-adjusting which from 1997 to 2012 (24 times) are selected as interest rate index, and the industrial index, IVA growth rate, CPI, PPI, WTI of each month as other explaining variables for samples.
Since there’s no fixed cycle in the 24 times adjustments of interest rate, but several times of the rate-adjusting happen in a year usually, so the averages of industrial index daily closing prices that from 7days before to 8days after the rate-adjusting (including the rate-adjusting intraday) are chosen as stock price index for discussing.
3.3 Empirical Research Method A. Model establishment and testing
Before the model is established, the stationarity of a sequence should be tested since the nonstationary time series may fail to express the regression model correctly. So, this paper conducts the ADF unit root test for industrial index (P), interest rate (I), CPI, PPI, IVA growth rate, International crude oil price, and the inspection result see Table 2 and Table 3.
Table 2: Inspection Result Of Adf Unit Root Test
Original sequence ADF Results
P -0.516 nonstationary
I -3.853 stationary
CPI -0.029 nonstationary
PPI -0.151 nonstationary
IVA -0.818 nonstationary
OIL -0.100 nonstationary
Table 3: Inspection Result Of Adf Unit Root Test
Difference sequence ADF Results
LNP -3.217 stationary
CPI -4.741 stationary
PPI -4.076 stationary
IVA -4.878 stationary
OIL -4.126 stationary
ISSN: 1992-8645 www.jatit.org E-ISSN: 1817-3195
757 get the modified nonlinear regression model as equation (1):
LNP = -1.61924978365 - 0.12311898426*I + 0.191160709518*CPI - 0.109049767543*PPI + 0.0378666005481*IVA + 0.00889929096509*OIL
(1)
DW
=1.48,F
=33.23,T
=24Figure 1: The Estimation Results Of Industrial Regression Model
Moreover, from the result of ADF test for U is shown as figure 2, there’s a cointegration relationship among the variables since the residual (U) in the model is stationary, so the model is correct and reasonable.
Figure 2: The Result Of ADF Test For Residual
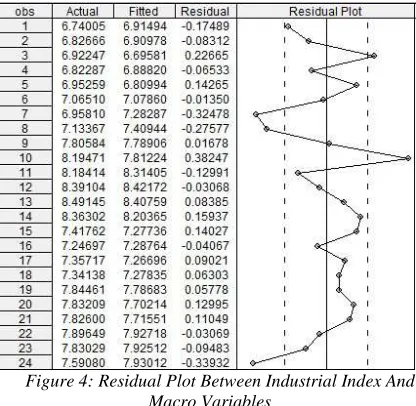
In addition, the chart of autocorrelation-partial correlation and the residual plot are gained from Econometrics software, respectively as shown Figure 3 and Figure 4. And the high goodness of fit can be obtained from Figure 4, in which the fitted values are coincided with the actual values.
[image:4.612.313.521.301.504.2]Figure 3: Autocorrelation-Partial Autocorrelation Among Variables
Figure 4: Residual Plot Between Industrial Index And Macro Variables
The model is tested from the two aspects: a. Testing on economic sense
The result in Figure 1 shows: industrial index (P) and interest rate (I), PPI move in an opposite direction, and CPI, IVA growth rate, international crude oil price go into the same direction, which agree with the real economy and the assumptions in this paper.
b. Testing on statistical sense (under a
significance level,
α
=5%)Significance test for the nonlinear of the model
(
F
-test)Under the 5% significance level, the result that a
significant nonlinear relationship with the
758
hypothesis
H
0 is refused in the model with theresult thatF−statistic=33.23>F0.05(5,18)=2.77.
Significance test for the parameters (
t
-test)Under the 5% significance level, the regression parameters in Figure 1 are significance for all the explaining variables have passed the inspection of
t-Statistic and their Prob<0.05 , namely, the
combined influence of interest, CPI, PPI, IVA growth rate and international crude oil price is prominent.
Test for heteroscedasticity
Figure 5: White Test For Heteroscedasticity
The fruit is acquired in Figure 5 that there is no heteroscedasticity in the residual with the output
that 2 2
0.05
18.22 (20) 31.41
TR = <χ = through White
test.
Test for autocorrelation
Figure 6: LM Test For Autocorrelation
In the model, T = 24, five explaining variables,
and dL =0.93, dU =1.9, DW =1.48 under a
significance level of
α
= 0.05, whether anautocorrelation exists in the errors U is uncertain. t
While, there is no autocorrelation in the model with
the LM tests in which 2 2
0.05
0.82 (1) 3.841
TR = <χ =
from Figure 6.
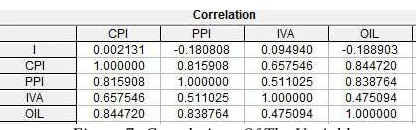
[image:5.612.91.300.558.623.2]Test for multicollinearity
Figure 7: Correlations Of The Variables
According to the discriminance of Klein, all the variables’ correlation coefficients in Figure7 are
smaller than determination coefficientR =0.9023, 2
so there’s no multicollinearity in the model. Test for goodness of fit
The determination coefficientR =0.9023 and the 2
adjusted determination coefficient R2 =0.8751,
indicating a higher goodness of fit exists in the model.
B. Model evaluations
There are some advantages in the above model shown in equations: first of all, the model in this paper is established to investigate stock price volatility on a comprehensive consideration of various macro economic factors. And since its higher-fit goodness, the impact of macro variables on stock price can be reflected to a certain extent; secondly, macro economic indicators, including IVA and international crude oil price, are introduced in the model that established on the effects of interest rate-adjusting on stock price. With the conclusion of this paper, policy makers can get a comprehensive view of the relations between shares and various factors; lastly, industrial model is built from the point of trade, so the investors not only can understand the risk exposure of industrial market, but also make effective prediction and reasonable investment decisions on the comprehensive ideas of the reactions of the industry to the changes in economic indicators.
In addition, the drawbacks are existing in the model: on one hand, a comprehensive idea of the relations among the all factors and stock prices is developed, but fails to discuss the influence of single factor on stock price; On the other hand, different results would be received by different methods of data processing, which may cause errors between the model and actual situation.
4. EMPIRICALRESEARCHANALYSIS
ANDCOUNTERMEASURES
4.1 Empirical Results Analysis
The regression result of the industrial model shows that under the significance-level of 5%, the industrial index is affected by macro economic variables and the relations among them are in line with the theoretical hypothesis. However, besides the negative correlation is not perfect reflected by the coefficients of shares indexes and interest rate, there is a weak relationship between the industry shares index and IVA, all those demonstrate Chinese security market is immature.
4.2 Countermeasures
perfect-ISSN: 1992-8645 www.jatit.org E-ISSN: 1817-3195
759 developing, higher efficiency and the benign
interaction with macro economy, following
suggestions are proposed on the basis of the model in the paper:
A. From the empirical results above, it can be seen that interest rate is not enough perfected to represent its negative relation with stock price. Therefore, in the view of policy, three methods can be adopted: first, regulating and enhancing the supply for stock market, so as to improve the
reaction-sensitivity to interest rate; second,
introducing the market-oriented reform to interest rate gradually and improving the interests’ variation-elasticity; third, building the favorable
external environment and guiding public’s
reasonable investment.
B. The phenomenon that CPI goes up, especially the PPI keeps on rising will go against the confidence-gathering and popular-upgrading on stock market. Therefore, for a country’s monetary policy makers, analysts and investors on financial market, discerning penetrate the relationship between stock price and inflation will undoubtedly conducive for them to make sensible economic decisions promptly when CPI and PPI rising.
C. Stock market can not operating orderly without the strict supervision and management of the relevant departments, meanwhile the market’s healthy development is under the protection of the scientific and close supervision. Consequently, for the achievement of the coordinated and sustainable development, there’s following three aspects: firstly, establishing and improving a regulation system of stock market; secondly, strengthening the law enforcement and punishment; finally, building a complete system which combines the centralized
and unified supervision and self-discipline
organization distributed supervision.
5. CONCLUSION
Drawn on the domestic and foreign researches, with the sample of 24 times interest rate-adjusting during the period of 1997-2012, the paper has analyzed the effects of industrial sector stock price that suffered from macro economic factors and established the high-credibility regression model. From the model, comes to the conclusion: stock market is basically consistent with macro economy, and the share index may reflect the trend and level of our economic development in a certain extent.
However, as an emerging market, many
insufficiencies are still existed in the stock market, which may restrict the sensitivity of stock index to the economy. With the explanation of industry
index and the analysis of various indicators that affect the trade-developing, this paper can service for organizations to forecast and guide the future trends of industry, to judge the value of trade-investment, and then to reveal the trade risk.
ACKNOWLEDGEMENTS
This work was supported by Program for Liaoning Excellent Talents in University (Grant No. LJQ2011010)
REFERENCES:
[1] Modigliani F, Cohn. R. A, “Inflation, Rational Valuation and the Market”, Financial Analysis
Journal, Vol.35, No.2, 1979, pp. 24-44.
[2] Sehwert. G. W, Paul. J. S, “Heteroskedasticity in stock returns”, Journal of Finance, Vol.45, No.4, 1990, pp. 1129-1155.
[3] Adams. G, Mc. Queen, R. Wood, “The Effects of Inflation News on High Frequency Stock Returns”, Journal of Business, Vol.77, No.3, 2004, pp. 545-574.
[4] Ben. S. Berrnanke, K. N. Kuttner, “What Explains the Stock Market’s Reaction to Federal Reserve Policy”, The Journal of
Finance, Vol.60, No.3, 2005, pp. 1221-1257.
[5] Guo Jinlong, Li Wenjun, “Empirical Research on Interaction of China’s Stock Market
Development and Monetary Policy”,
Quantitative & Technical Economics, Vol.6,
No.3, 2004, pp. 18-27.
[6] Li Mingyang, Tang Jianwei, “An Empirical Analysis of the Effects of Interest Rate Variation on Stock Prices in China”,
Economic Survey, Vol.4, No.6, 2007, pp.
136-139.
[7] Kavussanos, M. G, S. N. Marcoulis, “The stock market perception of industry risk and
macroeconomic factors”, International
Journal of Maritime Economics, Vol.2, No.3,
2000, pp. 78-82.
[8] Stefano Cavaglia, Michael Aked, “The increasing importance of industry factors”,
Financial Analysis Journal, Vol.56, No.5,
2000, pp. 41-54.
[9] Wang Yaodong, “The VAR research on Shanghai classification index”, Quantitative &
Technical Economics, Vol.3, No.4, 1999, pp.
32-35.
[10] Lao Lanzeng, Shao Yumin, “An Empirical Research on Volatility Characteristics of Industrial Stock Price Indices”, Nankai
760 [11] Bahram Adrangi, Arjun Chatrath, Antonio
Z.Sanvicente, “Inflation, Output, and Stock price: Evidence from Brazil”, Working paper, Vol.13, No.4, 2000, pp. 27-51.