861
ANALYSIS ON MECHANICAL PARAMETERS OF LUNAR
ROVER WHEEL
1,,,,2
DAWEI JIN, 1JIANQIAO LI , 3JIANXIN ZHU, 3CHUNHUA ZHANG
1Key laboratary of Bionic Engineering(Ministry of Education), Jilin University, Changchu 130022, Jilin,
China
2
Aircraft Dynamics Department, Aviation University of Airforce, Changshu 130022, Jilin, China
3Foundation Department, Aviation University of Airforce, Changshu 130022, Jilin, China
ABSTRACT
In order to study passing ability of lunar rover in lunar soil, the mechanical parameters between lunar wheel and lunar soil should be analyzed. The mechanical parameters can reflect the mechanical relationship between lunar rover wheel and regolith. These parameters include sinkage, drawbar pull, driving torque, motion resistance and slip. In this paper, these parameters are measured by soil bin test. The results show that, the four parameters increase with slip and loading, except motion resistance of the test wheel which is under 70N at the speed of 25mm/s. The variations of the four parameters are slightly influenced by velocity.
Keywords: Lunar Rover, Test Wheel, Mechanical Parameter, Lunar Soil Simulant
1. INTRODUCTION
With the rapid development of space science technology, it makes leap progress that human explore space [1-2]. As the primary objective to explore space, lunar exploration not only does not stop, but also make a great progress. The effect of lunar rover is very important when human explore lunar. Lunar rover is a kind of spacecraft that adapts the environment of lunar and carries science instruments. In order to finish the tasks, lunar rover must have better passing ability when running on lunar regolith[3-4]. The surface of lunar is covered with lunar regolith. Lunar regolith is weathering subtances that cover on the bedrocks of lunar rover. Beacause the particles of most of lunar regolith are very small, the wheels of lunar rover easily sink, slip and even can not pass the soft lunar regolith[5-6]. Thus, It is difficult that exploration is performed. The wheels of lunar rover bear the weight of whole lunar rover and have direct contact with lunar regolith when lunar rover runs on lunar. Drawbar pull is occurred by the contact area between the wheels and lunar regolith and effect of soil excavating. Here, travel performances and steering flexibility of lunar rover are controlled by mobility of lunar rover. Therefore, the analysis of mechanical function between driving wheels of lunar regolith has great meanings to investigation of motion performance of lunar rover.
In the past few years, the mechanical parameters involving performance of lunar rover are investigated by many scholars. Kojiro lizuka et al
did experimental study on lunar rover mobility, but they only analyzed sinkage on different conditions [7]. H.Shibly et al analyzed drawbar pull and driving torque by experiments, other parameters did not be measured [8].
The sinkage, driving torque, drawbar pull and motion resistance of driving wheel are analyzed when the loadings exerted on wheels and the velocities are varied by the indoor bin test in this paper. The analysis can provide theoretical basis and reference for analyzing motion performance of lunar rover and designing driving wheel.
2. SIMULANT LUNAR SOIL BIN TEST
2.1 Simulant Lunar Soil For The Test
JLU-2 Simulant lunar soil is used in the test. The parameters of JLU-2 Simulant lunar soil in soft condition are shown in table 1.
2.2 Simulant Lunar Soil Bin-Driving Wheel Test System
862 Table 1 : Mechanical Parameters Of JLU-2 Lunar Soil
Stimulant In Soft Condition
Mechanical parameter Value
Deformation index n 0.96
Cohesive modulus kc
[N/cmn+1] 1.99
Frictional modulus
kφ[N/cmn+2] 0.45
Bulk density γ[g/cm3] 1.26
Cohesion c [kPa] 0.32
Shear modelus Kj
[cm] 1.59
Particle density
[g/cm3] 2.73
The internal friction
angle φ[ °] 30.19
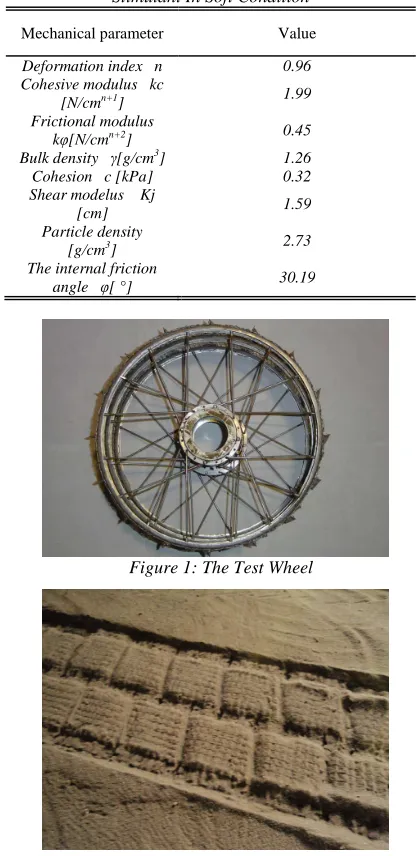
Figure 1: The Test Wheel
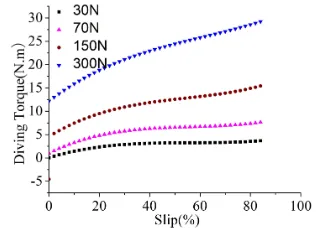
Figure 2: The Rutting In Lunar Soil Simulant
system of the system can make the test wheel rotate, exert vertical loading on the test wheel and ensure the direction of the test wheel during the test. The test system includes the test wheel platform, horizontal force measured device, torque measured device, driving force mechanism, horizantal force
system, vertical loading platform, horizontal displacement measured device etc. The devices can measure drawbar pull, sinkage, velocity, rotational speed, driving torque etc. Slip λ could be calculated by the following equation:
λ=(ωr−v) /ωr (1)
Where ω is the rotating velocity, v is the traveling velocity, r is the diameter of the wheel. Motion resistance F could be calculated by the following equation:
F=T r/ −DP (2) Where T is driving torque, DP is drawbar pull.
2.2 Test Wheel
Because the environment of lunar surface is very special and the structure of the lunar rover is limited by condition, the wheels of lunar rover are supported by metal wheels, not aeration wheels. The test wheel is shown in Figure1. The diameter of the wheel is 300mm, the width of the wheel is 150mm.
2.3 Test Wheel
The rutting of test wheel in lunar soil stimulant is shown as Figure 2. Sinkage is measured by vertical displacement sensor. Drawbar pull is measured by pressure sensor. Driving force is measured by torque sensor. Motion resistance is calculated by Esq. 1. Figure 3 shows the variation of sinkage, drawbar pull, driving torque and motion resistance. In this case, vertical loading exerted on the wheel is 30N, Slip is 20%, and traveling velocity is 25mm /s. It is very obvious that the four parameters regularly fluctuate with the displacement increases. The reason is for the moving wheel. The forces acting on the lunar soil stimulant regularly change when the moving wheel enters into the lunar soil stimulant in turn. Meanwhile, the reactions exerted on the wheel surface by the lunar soil stimulant regularly change. Thus, Sinkage, drawbar pull, driving torque and motion resistance regularly change too
863 (b)
(c)
[image:3.612.87.312.70.550.2](d)
Figure 3: Variation Of The Data Measured With The Wheel’displacement
.
3. RESULTS AND ANALYSIS
3.1 Variation Of Sinkage With Slip
Figure 4 show that sinkage increases with slip increases. Figure 4(a) shows the relationship between sinkage and slip under the loading of 30N. When slip is more than 11%, sinkage increases with velocity increases. The sinkage of the test wheel at the speed of 10mm/s is always smallest during the test. The maximum sinkage of the test wheel at the speed of 25mm/s increases by 65.1% than that at the speed of 10mm/s. The maximum sinkage of the test wheel at the speed of 35mm/s increases by 9% than that at the speed of 25mm/s.
Figure 4(b) shows the relationship between sinkage and slip when the velocity of the test wheel is 25mm/s. Singkage increases with loading. The maximum sinkage of the test wheel under the loading of 70N increases by 49.2% than that under the loading of 30N. The maximum sinkage of the test wheel under the loading of 150N increases by 66.8% N than that under the loading of 70N. The maximum sinkage of the test wheel under the loading of 300N increases by 39.8% N than that under the loading of 150N. The result indicates that the sinkage of the wheel subjected larger loading easily sink and even fails when the change of lunar rover pose causes the change the loading exerted on the wheels.
(a) Influence Of The Velocity For Sinkage
[image:3.612.336.501.278.565.2](b) Influence Of The Loading For Sinkage
Figure 4: Variation Of Sinkage With Slip
3.2 Variation Of Drawbar Pull With Slip
864 Figure 5(b) shows the effect of loading on drawbar pull under the velocity of 25mm/s. Drawbar pull increases with loading. The maximum drawbar pull of the test wheel under the loading of 70N increases by 108% than that under the loading of 30N. The maximum drawbar pull of the test wheel under the loading of 150N increases by 102% than that under the loading of 70N. The maximum drawbar pull of the test wheel under the loading of 300N increases by 94% than that under the loading of 150N. Obviously, It is helpful to clime and avoid sinking that increasing the loading acting on the wheels by changing the pose of lunar rover increases drawbar pull.
(a) Influence Of The Velocity For Drawbar Pull
[image:4.612.340.500.186.304.2](b) Influence Of The Loading For Drawbar Pull
Figure 5: Variation Of Drawbar Pull With Slip
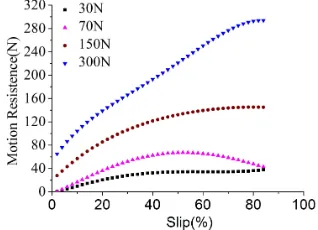
3.3 Variation of driving torque with slip
Figure 6 show that driving torque increases with slip. Figure 6(a) shows the influence of velocity on driving torque when the loading is 30N. Driving torque increases with the velocity decreases when slip changes between 13%-47%. The change of velocity has slightly effect on drawbar pull in the range of 10mm/s-35mm/s. The maximum driving torque of the test wheel at the speed of 35mm/s increases by 2.5% than that at the speed of 10mm/s. Figure 6(b) shows driving torque increases with loading when the velocity is 25mm/s. The maximum driving torque of the test wheel under the
loading of 70N increases by 141% than that under the loading of 30N. The maximum driving torque of the test wheel under the loading of 150N increases by 101% than that under the loading of 70N. The maximum driving torque of the test wheel under the loading of 300N increases by 95% than that under the loading of 150N.
(a) Influence Of The Velocity For Driving Torque
[image:4.612.112.268.266.381.2](b) Influence Of The Loading For Driving Torque
Figure 6: Variation Of Driving Torque With Slip
3.4 Variation of motion resistance with slip
[image:4.612.339.497.340.456.2]865 (a) Influence Of The Velocity For Motion Resistance
(b) Influence Of The Loading For Motion Resistance Figure 7: Variation Of Driving Torque With Slip
Figure 6(b) shows the effect of loading on motion resistance at the speed of 25mm/s. When slip is in range of 0-54%, motion resistance increases with loading. Motion resistance of the test wheel under the loading 70N firstly increases with slip, then decreases with slip. When slip is 54%, motion resistance is maximum which is 66.4N. The maximum increases by 94.6% than motion resistance of the test wheel under the loading of 30N. The maximum motion resistance of the test wheel under the loading of 150N increases by 135% than that under the loading of 70N. The maximum motion resistance of the test wheel under the loading of 300N increases by 95% than that under the loading of 150N.
4. CONCLUSION
Sinkage, drawbar pull, driving torque and motion resistance of the lunar rover wheel increase with slip, except motion resistance of the test wheel which is under 70N at the speed of 25mm/s.
The variations of the four parameters are slightly influenced by velocity for the velocities vary in the small range during the test. When slip is more than 11%, sinkage increases with velocity increases. When slip is below 8%, drawbar pull increases with
velocity. Driving torque increases with the velocity decreases when slip changes between 13%-47%. When slip changes in the range of 10%- 28%, motion resistances increase with the velocity reduce.
When slip is below 54%, Sinkage, drawbar pull, driving torque and motion resistance increase with loading. When slip is above 54%, the four parameters increase with slip, except motion resistance of the test wheel which is under 70N at the speed of 25mm/s. The variations of the four parameters are significantly influenced by loading.
ACKNOWLEDGEMENTS
This work was supported by National Natural Science Foundation of China (Grant No.50875107), and the National High Technology Research and Development Program of China (No. 2010AA101401-3).
REFERENCES:
[1] IAGNEMMA K, KANG S, SHIBLY H, et al, “Online terrain parameter estimation for wheeled mobile robots with application to planetary rovers”, IEEE Transaction on robotics , Vol. 20, 2004, pp. 921-927.
[2] H. Nakashima, H. Fujii, A. Oida, M. Momozu, “Parametric analysis of lugged wheel performance for a lunar micro rover by means of DEM”, Journal of Terramechanics, Vol. 44, 2004, pp. 153-162.
[3] Zou M, Li J Q, Zang J H, et al, “Traction ability of lunar rover's driving wheel on different soils”,
Journal of Jilin University (Engineering and Technology Edition), Vol. 40, 2010, pp. 25- 29.
[4] Ding L, Gao H B, Deng Z Q, et al, “An approach of identifying mechanical parameters for lunar soil based on integrated wheel–soil interaction terramechanics model of rovers”, Acta Aeronoutica et Astronautica Sinica, Vol. 32,
2011, pp. 1112-1123.
[5] YOSHIDA K, HIROSHI H, “Motion dynamics of a rover with slip-based traction model”,
Proceeding of IEEE International Conference on Robotics and Automation, IEEE Robotics
and Automation Society, May 25-29, 2002, pp. 3155-3160.
[6] SOHL G, JAIN A, “Wheel-terrain contact modeling in the ROAMS planetary rover simulation”, Proceedings of IDET’05 ASME
[image:5.612.109.268.259.374.2]866
Conference, American Society of Mechanical
Engineers, September 24-28, 2005, pp. 1-9. [7] Kojiro lizuka, Hiroshi Karamori, Takashi
Kobota, “Experimental study on rover mobility on lunar simulant terrain”, Proceedings of the
15th International Conference the ISTVS,
Institute for Agricultural Machinery, September 25-29, 2005, pp. 421-433.