[Paparao, 5(6): June, 2018]
ISSN 2349-0292
Impact Factor 3.802
GLOBAL JOURNAL OF ADVANCED ENGINEERING TECHNOLOGIES AND
SCIENCES
STUDY OF MACRO AND MICRO SURFACE TEXTURES OF AISI P20 TOOL DIE
STEEL PRODUCED BY ELECTRICAL DISCHARGE MACHINING(EDM)
D.Paparao
Department of Production Engineering, National Institute of Technology Tiruchirapalli, Tamilnadu,
India
DOI: 10.5281/zenodo.1302246
ABSTRACT
Electrical discharge machining (EDM), is well known process for making complex geometry in plastic injection moulding dies such as AISI P20. The machining parameters like current, voltage, pulse on time, pulse off time, gas supply pressure etc., are influencing the output responses like Material Removal Rate(MRR), Tool Wear Ratio(TWR) and surface quality. Among them pulse on time and current are the major parameter which alters the performance characteristics. The surface textures by different process like knurling, laser texturing and water-jet texturing etc are commonly available and practiced. Sometimes, it is difficult to control surface texture produced on the component. In EDM process, it is possible easily to control the surface texture produced on the component precisely by varying the different process parameters. In the present investigation it is planned to produce the variety of surface textures using EDM technique by varying separately current and pulse on time alone. Copper electrode of diameter 10mm and the work piece AISI P20 tool die steel is selected for machining. Dielectric media used for machining the process is EDM oil. The process is done in two stages. In first stage is done by varying the pulse on time and keeping rest of the parameters constant. The second stage is done by varying current and keeping rest of the parameters constant. The effect of variation in pulse on time and current are completely analysed on the performance characteristics viz. Material Removal Rate (MRR), and surface finish. The microstructural study using optical microscope and SEM with EDS are studied.
KEYWORDS: Electrical discharge machining (EDM); Material removal rate(MRR); Tool wear rate(TWR); surface roughness(SR); Scanning electron microscope(SEM).
INTRODUCTION
Electro Discharge Machining (EDM) is an electro-thermal non-traditional machining Process, where electrical energy is used to generate electrical spark and material removal mainly occurs due to thermal energy of the spark. EDM is mainly used to machine difficult-to-machine materials and high strength temperature resistant alloys. EDM can be used to machine difficult geometries in small batches or even on job-shop basis. Work material to be machined by EDM has to be electrically conductive.
EDM has been replacing drilling, milling, grinding and other traditional machining operations and is now a well-established machining option in many manufacturing industries throughout the world. And is capable of machining geometrically complex or hard material components, that are precise and difficult-to-machine such as heat treated tool steels, composites, super alloys, ceramics, carbides, heat resistant steels etc. being widely used in die and mould making industries, aerospace, aeronautics and nuclear industries. Electric Discharge Machining has also made its presence felt in the new fields such as sports, medical and surgical, instruments, optical, including automotive R&D areas.
Alternative surface texturing methods includes Laser surface texturing, Knurling, Abrasive jet machining, Ion beam texturing. All the above methods are most commonly used for generating surface texture on the specimen. In the above mentioned methods, we can’t control the surface texture produced on the component accurately. In order to control the surface texture produced on the component accurately then we should go for Electrical Discharge machining (EDM). In EDM, precisely we can control the surface texture produced on the component by properly controlling the process parameters like pulse-on time, pulse-off time and current. My current study will focus on effect of pulse-on time and current on the surface texture of the component.
EXPERIMENTAL PROCEDURE
[Paparao, 5(6): June, 2018]
ISSN 2349-0292
Impact Factor 3.802
a) Chemical compositionThe chemical composition of P20 tool steels is outlined in the following table.
Element Content (%)
C 0.28-0.40
Mn 0.60-1.00
Si 0.20-0.80
Cr 1.40-2.00
Mo 0.30-0.55
Cu 0.25
P 0.03
S 0.03
b) Mechanical properties
The mechanical properties of P20 tool steels are displayed in the following table.
Properties Metric Imperial
Hardness, Brinell (typical) 300 33
Hardness, Rockwell C (typical) 30 30
Tensile strength, ultimate 965-1030 MPa 140000-150000 psi Tensile strength, yield 827-862 MPa 120000-125000 psi Elongation at break (in 50 mm (2")) 20.0% 20.0% Compressive strength 862 MPa 125000 psi Charpy impact (V-Notch) 27.1-33.9 J 20.0-25.0 ft-lb
Poisson's ratio 0.27-0.30 0.27-0.30
Elastic modulus 190-210 GPa 27557-30457 ksi
The tool material used in the experiment is Copper. Copper is stable material under sparking conditions and having excellentelectrical and thermal conductivity. It is useful in the EDM machining of many hard materials and the applications requiring a fine finish. In Dry EDM setup, only hollow tool can be used. Copper tool used in the experiment is hollow having 8mm outside diameter. Copper tool used in the experiment is hollow having 6mm outer diameter and 4mm inner diameter. The copper electrode properties are given below in table 1
Table1 Properties of copper electrode
Parameter Value
Density 8.9 g/cc
Thermal conductivity 268-389 W/mK
Electrical resistivity 1.72x10⁻⁸ Ωm
Melting point 1083 ℃
Coefficient of thermal expansion 6.6x10⁻⁶℃-1
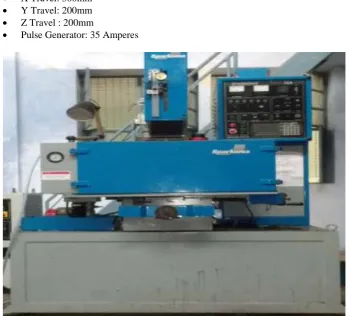
The experiments were carried out on an EDM machine Spark Erosion Machine-S Series Model S-35 manufactured by Sparkonix Pvt. Ltd.
The EDM machine tool specification are:
[Paparao, 5(6): June, 2018]
ISSN 2349-0292
Impact Factor 3.802
Work Tank: 800 x 500 x 325 mm X Travel: 300mm Y Travel: 200mm Z Travel : 200mm
Pulse Generator: 35 Amperes
Fig.1. EDM machine Spark Erosion Machine-S Series
Table 2 Process parameters
Parameter Unit
Current Ampere
Pulse on Time, Pulse off Time Micro seconds
Pressure KPa
Table 3 Parameter levels
Parameter Ranges,
Pulse on Time, (µs) 50 100 175 300 550 1000
Parameter Ranges,
Current, (Amp) 11 13 15 17 19 21
We have to study the effect of process parameters on the MRR, TWR and SR. we need to measure tool wear before and after machining to calculate the tool wear rate. To measure the surface roughness, surface roughness tester is available in Metrology lab. We need to analyse the surface roughness of every machined surface for different process parameters.
TWR indicates the degree of surface roughness produced on the work-piece. TWR (mg/min) was measured by using the weight of electrode before and after the machining is done and by measuring the machining time with the help of stop watch (20mins). The exact weight was measured using Digital Weighing Machine.
[Paparao, 5(6): June, 2018]
ISSN 2349-0292
Impact Factor 3.802
TWR=𝑊𝑡𝑏−𝑊𝑡𝑓𝑡
Where Wtb = Weight of tool before machining. Wtf = Weight of tool after machining.
t = Machining time (20 mins)
In this work the surface roughness is measured by Mitutoyo surf test SJ-410. The cut-off length was 0.25 mm. The instrument is a shop–floor type surface-roughness measuring instrument, which traces the surface of various machine parts and calculates the surface roughness based on roughness standards, and displays the results in μm. The surface resolution varying from 0.01 μm to 0.4 μm depending on the measurement range.
RESULTS AND DISCUSSIONS
For obtaining performance characteristics for this experiment the MRR,TWR and SR were obtained. Experimental observation:
Table 4 Experimental result for MRR, TWR and SR vs. Pulse-ON Time EXP NO. PULSE ON
TIME (µs) MRR (mg/min) TWR (mg/min) SR (µm)
1 50 1.37 0.08.08 2.56
2 100 1.83 0.135 3.06
3 150-200 2.24 0.175 3.16
4 200-400 2.61 0.255 4.91
5 500-600 3.44 0.4 5.32
6 1000 4.22 0.7 5.5
Table 5 Experimental result for MRR, TWR and SR Vs.Current EXP NO. Current
(A) MRR (mg/min) TWR (mg/min) Surface roughness (µm)
1 11 1.1212 0.09.09 1.61.6
2 13 1.23 0.11 1.7
3 15 1.32 0.13 1.9
4 17 1.35 0.14 2.0
[Paparao, 5(6): June, 2018]
ISSN 2349-0292
Impact Factor 3.802
6 21 1.515 0.185 2.36
3.1) Analysis of MRR&TWR Vs.Pulse-on time:
Fig. 2. shows the variation of material removal rate and tool wear rate with pulse on time. It is observed that Material removal rate is directly proportional to the amount of energy applied during the pulse on-time. The longer the pulse-on-time is sustained the more work-piece material will be melted away. The resulting crater will be broader and deeper than a crater produced by a shorter on-time. Tool wear rate also directly proportional to the pulse-on time. As the pulse-on time increases, number of sparks are going to increases. So, tool wear rate and material removal rate are increases with respect to pulse-on time. Here work-piece is connected to positive terminal so more amount of material removal takes place on work-piece as compared to tool.
Fig. 2.Tool Wear Rate and Metal removal rate Vs. Pulse on Time
3.2) Analysis ofMRR&TWR Vs. Current:
Fig .3. shows the influence of the pulse duration on the tool wear rate.It is noticed that the tool wear rate is always nearly zero, independent of the pulse duration. It is considered that the molten work-piece material is attached to the tool electrode surface and protects the surface from wear independent of the pulse duration.
0 0.5 1 1.5 2 2.5 3 3.5 4 4.5
50 100 175 300 550 1000
MRR
TWR
Material
Removal Rate(mg/min)
Pulse-On Time(µs) Tool Wear
[Paparao, 5(6): June, 2018]
ISSN 2349-0292
Impact Factor 3.802
Fig. 3. MRR and TWR Vs. Current
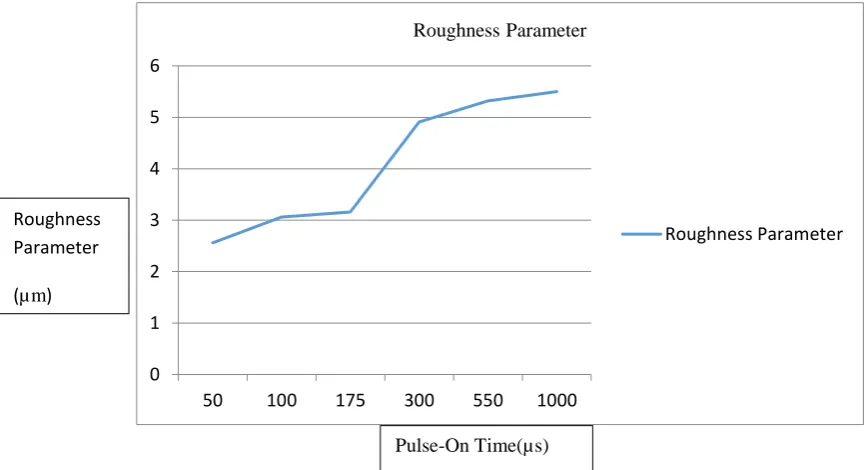
3.3) Analysis of surface roughness:
By the increase in pulse on-time, the discharge energy of the plasma channel and the period of transferring of this energy into the electrodes increase. This phenomenon leads to a formation of a bigger molten material crater on the work-piece which results in a higher surface roughness.
Fig .4. Surface Roughness Vs. Pulse on Time 0
1 2 3 4 5 6
50 100 175 300 550 1000
Roughness Parameter
Roughness Parameter 0
0.2 0.4 0.6 0.8 1 1.2 1.4 1.6
11 13 15 17 19 21
MRR
TWR
Current(A)
Material
Removal
Rate(mg/min)
Tool Wear
Rate(mg/min)
Pulse-On Time(µs) Roughness
Parameter
[Paparao, 5(6): June, 2018]
ISSN 2349-0292
Impact Factor 3.802
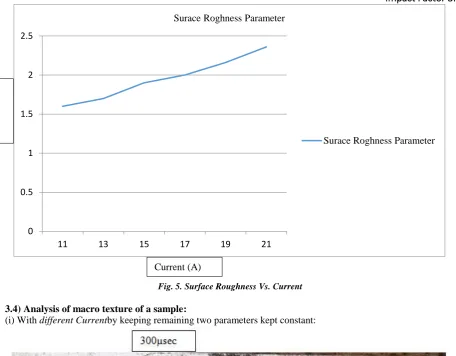
Fig. 5. Surface Roughness Vs. Current
3.4) Analysis of macro texture of a sample:
(i) With different Currentby keeping remaining two parameters kept constant:
3.5)Analysis of micro-texture of a sample:
The microstructural study of selected machined surface with different magnification 200X is obtained using optical microscope as shown in Fig. The work-piece is etched before observing under microscope to get well defined features. The etchant used is Nital which is 98% ethanol and 2% nitric acid. It clearly depicts micro-cracks at higher magnification at the grains rather than grain boundary. The grains are affected due to the process variables. In some of the portions, grain boundary is slightly damaged since , the work-piece and tool of different coefficient of thermal expansion of rapid heating and cooling (which causes expansion and contraction) during the machining process. Also, it is confirmed from the below image, the cracks are clearly visible
(i) With different Currentby keeping remaining two parameters kept constant: 0
0.5 1 1.5 2 2.5
11 13 15 17 19 21
Surace Roghness Parameter
Surace Roghness Parameter Roughness
Parameter
(µm)
[Paparao, 5(6): June, 2018]
ISSN 2349-0292
Impact Factor 3.802
21A 19A
11A
17A 15A
[Paparao, 5(6): June, 2018]
ISSN 2349-0292
Impact Factor 3.802
(ii) With different Pulse-on timeby keeping remaining two parameters kept constant:
3.6)Analysis of SEM images:
Fora sample of Current 15A, Pulse-on time 100µsec and Pulse-off time 40µsec:
550µsec 1000µsec
50µsec
175µsec 300µsec
[Paparao, 5(6): June, 2018]
ISSN 2349-0292
Impact Factor 3.802
CONCLUSIONS
In the present work, AISI P20 tool die steel was machined by dry electrical discharge machining process with variation of pulse-on time and current. The analysis of the experimental observations highlights that the metal removal rate, electrode wear rate and surface roughness in electrical discharge machining are greatly influenced by the parameter pulse-on time and current considered in the present study.The material removal rate, surface roughness are increasing with increase in pulse-on time.The material removal rate, surface roughness are increasing with increase in current.The electrode wear rate is negligible in dry EDM and it is almost zero irrespective of the pulse on time and current lower pulse-on duration should be used for a good surface texture but reduces the material removal rate. It has been found that crack formation is caused by the stress induced by the EDM process.
The migration of copper from the tool electrode into the work piece is found in dry EDM
REFERENCES
[1] Mohammadreza Shabgard, Mirsadegh Seyedzavvar and Samad Nadimi Bavil Oliaei (2011) [2] Y.H. Guu (2004)
[3] G. Skrabalak, J. Kozak, M. Zybura(2013) [4] S. Chakraborty, V. Dey, S.K. Ghosh(2014)
[5] Yusuf Keskin, H. Selc¸uk Halkacı and Mevlut Kizil (2005) [6] Ahmet Hascalık, Ulas¸Caydas(2007)
[7] Sourabh K.Saha S.K.Choudhury(2008) [8] P. M. Lonardo , A. A. Bruzzone (1999)
[9] Peter Fonda, Zhigang Wang, Kazuo Yamazaki, Yuji Akutsu(2007) [10] H. Ramasawmya and L. Blunt (2004)