Abstract— Business processes link resources, organisational units, activities and process instances such as customer orders within a company. To evaluate the performance of a company thus requires an in-depth understanding of the business processes. Three prominent methodologies to assess the performance of the processes exist thus far. Each uses a different angle, where in this paper we present a novel methodology that combines these three approaches at the process level: Data Envelopment Analysis (DEA), Process Mining and Business Process Simulation (BPS). The core unit of analysis is the process instance. First, DEA is used to measure the technical efficiency at the process level by comparing input use for given output levels. If inefficiencies are detected, the roots of inefficiency in activities have to be located in the process model that is discovered by process mining. To overcome these identified inefficiencies BPS is applied to analyse potential changes in the process to improve efficiency. Finally, the results of the simulation will again be analysed with the DEA and compared to the initial values. Hence, the combination of DEA, Process Mining and BPS seems a promising approach for analysing and improving process efficiency. We demonstrate the capabilities of our approach at the example of livestock breeding.
Index Terms— Data Envelopment Analysis (DEA), Business Process Simulation (BPS), Process Mining (PM), Efficiency, livestock breeding
I. INTRODUCTION
ERFORMANCEmanagement of operations is a major topic for organisations to stay competitive [1]. Processes have to be improved systematically to ensure continuous efficiency improvements in a dynamic environment [2]. This requires information about the performance of operations at the processes level, and to exploite options to improve the performance [3].
Several approaches exist that aim at analysing the performance of processes by process mining (PM), Data Envelopment Analysis (DEA) and business process simulation (BPS). PM allows one to build a model of an event log containing instances of a process [4], DEA focusses on detecting the efficiency of the instances in a process [5] and BPS facilitates the simulation how the model can be improved to generate instances with a higher efficiency [6]. However, so far no combination of these three methods on a process level is available, although prior work connects DEA and BPS [7] as well as PM and BPS [e.g. 8]. We argue that
M. L. is Professor at University of Rostock, Ulmenstrasse 69, 18051 Rostock, Germany (e-mail: [email protected]).
the combination offers major benefits in terms of efficiency. Here we a new methodology and show how these three methods can be combined to improve business performance. The remainder of the paper is organised as follows: First a short introduction to the methods PM, DEA and BPS is given (Section 2). Afterwards, existing literature dealing with a combination of these methods will be reviewed (Section 3). The newly proposed methodology combining PM, DEA and BPS is then presented in the following (Section 4). The methodology is then demonstrated in Section 5 using an example from livestock production, here fish fattening. Finally, a short summary and an outlook on further steps are provided (Section 6).
II. THEORETICAL FOUNDATION
The dimensions to measure performance of processes can be described by productivity, efficiency and effectiveness. The distinction between these three dimensions is as follows [9-11]:
• Productivity is a descriptive measure and defined as the relation of an output to an input. It has no meaning without a comparison to another input-output-relation. Thus at least two values are needed to evaluate productivity.
• Efficiency is a normative measure of input-output-relations. That is, observed values are compared to a maximum that can be achieved (either input- or output-oriented). The maximum is on the efficient frontier, which can be estimated or be determined by other input-output ratios (DEA, benchmarking).
• Effectiveness is also a normative measure that reflects whether within the process the intended output is produced, irrespective of the current efficiency level. We focus on technical efficiency in a non-parametric manner by using DEA. Observed input-output-relations are compared with a best possible solution for a relation [12]. While PM gathers the underlying process model in this regard of efficiency, BPS focusses on delivering to-be values of parameters that can be used to calculate technical efficiency scores.
A. Process Mining
The method of process mining aims at analysing timestamps that contain information of process execution [4]. Starting point are instances of the process (e.g. customers, objects or animals) for which it is documented when which
S. H. is Professor at University of Rostock, Justus-von-Liebig-Weg 2, 18059 Rostock, Germany (e-mail: [email protected]).
Performance Analysis with DEA, Process
Mining and Business Process Simulation
on a Livestock Process
M. Leyer,
Member, IAENG
, and S. Hüttel
activities have been executed by whom [13]. It is important that every instance has an unambiguous identification number (ID) that allows one to assign activities to an ID [14]. Elements of a timestamp are (1) a continuous number, (2) an ID, (3) the executed activity, (4) the time stamp of the beginning (date, time), (5) the end and (6) the executing resource. An instance can thus be described from a process perspective as a sequence of timestamps (event log).
Such timestamps are typically recorded automatically by process-oriented information systems but can also manually [15]. The decisive characteristic of such a documentation is that information is assigned unambiguously to IDs of instances throughout the whole process [16]. Each time an activity is executed (event) a timestamp will be stored either automatically by a system or manually by an employee. Using these timestamps, tools of process mining can be used to discover a process model, to check the conformance of the model with the process execution data and to extend existing models [17].
B. Data Envelopment Analysis
DEA is a non-parametric efficiency measurement method [5]. It is typically used when the production function is unknown and data is not normally distributed [18]. The method detects the best possible input-output-relations in the given dataset in order to create a best practice frontier. Several inputs and outputs can be compared simultaneously. For each Decision Making Unit (DMU, which reflects an input-output-combination) the distance to this best practice frontier is calculated. This distance equals the efficiency score in comparison to the best possible input-output-relation [19]. DEA can be applied on several levels of an organisation using the organisation itself as a DMU, organisational units and processes. On the level of processes, instances are analysed which is the same object to be used by PM and BPS.
C. Business Process Simulation
BPS uses models that reflect relevant characteristics of a process in reality to the best possible extent. Such models allow one to test process changes that cannot be observed in reality for several reasons [6]. Models of business processes can be static, partially dynamic and consider stochastic influences while executing activities or fully dynamic where stochastic influences on incoming instances are considered causing a dynamic relation while executing activities) [20]. The model of a process forms the basic structure of a simulation model, which is then enriched with information about the available number of employees, their working times and costs as well as machines [21].
III. RELATED WORK
Besides variations of the methods PM, DEA and BPS, not much work with the aim to connect these methods is available. One strand of literature describes the joint application of DEA and BPS, either focussing on BPS to generate data for conducting a DEA analysis [22, 23] or describing the connection of both at the company level [24]. No approach that describes the integration of DEA and BPS in one methodology at the process level has been reported [7]. Here, a stepwise procedure is proposed that requires a definition of input and output variables as well as potential changes of the chosen process. This is followed by an initial efficiency measurement using DEA. The potential changes are then simulated and the respective results are compared
with DEA measures to determine the best solution. This procedure of simulating with BPS and evaluating the results with DEA can be repeated multiple times to determine the best possible combination of process improvements.
Another type of methodologies targets at the combination of PM and BPS. Event logs are mined to generate a process model then enriched by further information to allow for simulations of the process itself. Some approaches focus more on the technical perspective of connecting both methods. For instance describe Rozinat et al. [25, 26] the technical implementation of such a combination within two tools (ProM and CPN). This covers how a process model is built and can be transformed into a simulation model using further information from the event logs. Maruster and van Beest [27] describe a similar procedure at the example of two case studies while Liu, Zhang, Li and Jiao [28] focus on how event-based representations for simulation models can be extracted from event logs. Leyer and Moormann [8], however, go one step further and integrate concepts for operational control, resource availabilities, process cost and customer integration.
Prior work, however, does investigate the connection of PM and DEA as well as the integration of PM, DEA and BPS so far. Our newly proposed methodology exactly closes this gap. This integrative approach is described in the next section.
IV. METHODOLOGY
According to Bussmann, Jennings and Woolridge [29], a methodology must be composed of:
• An (optional) definition of the problem space,
• a set of models that represent different aspects of the problem, domain or the solution at different stages,
• a set of methods that transform instances of one model into another model, and
• a set of procedural guidelines which define an order for the systematic application of the methodological steps. A. Problem Space
Applying this procedure to the given context, we start with the definition of the problem space. We target at the level of business processes with the aim of improving technical efficiency of the processes. The problem to be addressed is thus easiness of conducting such analyses. This covers gathering the data, measuring efficiency and conducting improvements. Each step should be supported in the best possible way to ensure that an analysis takes not much time and produces accurate results.
B. Solution models and methods
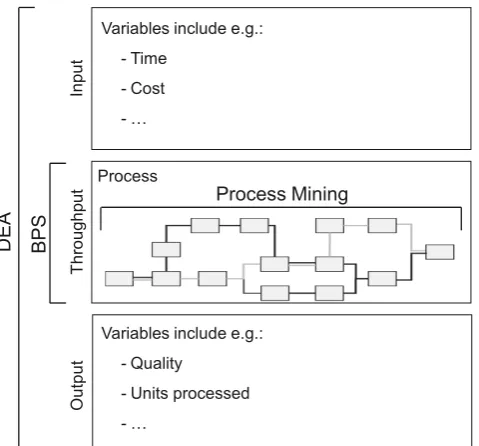
Fig. 1: Application areas of PM, DEA and BPS on process level
PM allows one to gather process execution data from event logs and to construct a process model. DEA can then be used to determine the performance of the process and BPS addresses the modelling and evaluation of potential changes. The process model derived with PM is directly used as basis for constructing a simulation model that is enriched with additional data from the event logs. To conduct this conversion the method from [8] is adopted. The outcome variables of the simulation model are then the input for conducting the DEA analyses beyond the as-is situation.
C. Procedural guideline
The three methods are connected within the proposed methodology, i.e. the procedural guideline, as follows: First, (Phase 1) the process model is set up to cover the relevant steps that will be included in the process model and then evaluated in subsequent steps. Process mining starts with analyzing event logs of the process and discovers the process model.
Second, for this process, input and output variables have to be defined. The variables can either be input- or output-oriented, but have to cover the relevant variables of interest in terms of the process efficiency. Figure 2 summarizes the phases of the methodology. This phase further includes the definition of possible changes of the discovered process model with the aim to improve the process efficiency. These changes have to account for the information on how the process model will be affected.
Third, the defined input and output variables of the process are used to perform a DEA analysis of the as-is process. The observed data from the process have to be extended by one artificial DMU that reflects a perfect input-output-combination. This allows one to compare the results from each DEA analysis conducted in the following phases with the as-is results. Afterwards, the process model is implemented in a simulation model as described in [8]. This model is verified and then used to simulate the possible changes. The results have to be recorded in terms of the defined input and output variables. These variables can then be used to calculate DEA scores again and to compare these with the as-is situation. To compare the results statistically, a standard analysis of variance (ANOVA) can be used. Finally,
the best solution in terms of efficiency increase can be identified.
Fourth, the previous phase/step is repeated by implementing the remaining possible changes in addition to the identified best solution. DEA scores are re-calculated and the best solution in this phase is identified if it increases the previously achieved efficiency score.
[image:3.595.317.558.306.619.2]Finally, the described procedure is repeated until no further possible changes can be added or if there is no additional increase in efficiency. Results can always be compared to the as-is situation.
Fig. 2: Schematic model for the combination of PM, DEA and BPS on the process level
V. SAMPLE APPLICATION OF THE METHODOLOGY IN A
LIVESTOCK ENVIRONMENT
A. General description
Production processes in the agricultural livestock environment can be described by several cornerstones that differ from traditional production or service systems. First, there is no consideration of cycle time to be minimized from a process perspective. Animals have natural feeding and growing cycles that cannot be shortened by improving the process. Second, data stems from the herd as well as from the
O
ut
put
Thr
oug
hp
ut
DE
A
Process
Input
BPS
Variables include e.g.: - Time
- Cost - …
Variables include e.g.: - Quality
- Units processed - …
Process Mining
DE
A
Phase 3:
Phase 4
Phase n Phase 2:
Step 1: Definition of input-output-variables of interest in terms of process efficiency
Step 2: Definition of possible changes in the
throughput that influence the input-output-relation
BPS
DE
A
BPS
DE
A
BPS
DE
A
ID Customer
order Activity Originator Begin End #203 Checkup Clerk 10:04;
05.03.2010 10:14; 05.03.2010 #204 Checkup Clerk 10:15;
05.03.2010 11:00; 05.03.2010 #203 Revision Customer 10:15;
05.03.2010 15:25; 07.03.2010 #194 Checkup Clerk 11:10;
05.03.2010 11:15; 05.03.2010 #203 Checkup Clerk 11:05; 08.03.2010 14:23; 08.03.2010 #194 Decision Manager 16:10;
05.03.2010 09:18; 08.03.2010
… … … … …
general maintenance surrounding the herd. The second type of activities occurs independently from individual activities of animals within the herd. Still, general maintenance is part of the growing process of animals. Third, there are two types of livestock production processes. Breeding starts continuously, i.e. animals enter and leave the herd at individual points in time. With fattening, all animals start at the same time and are also leaving the process all at once.
Regarding input and output, typically the number of DMUs declines over the production process, i.e. some animals die in between. The level of analysis is on animals as well as general activities that are not carried out for a specific animal. As such, the variables being used emerge from the process (time stamps) as well as from fixed conditions (ccontinuously running equipment).
B. Case data
In our exemplary application, we focus on fish fattening. Using experimental data, we observe three types of fattening intensity: (1) Intensive (I): 140 fish by tank; (2) Semi-intensive (SI): 70 fish by tank; (3) Extensive (E): 35 fish by tank. Three fish tanks for each intensity level allow us to compare intensity levels and provide sufficient data. The fattening period is 184 days and the production environment is similar to each type of intensity (all tanks are in the same fish glasshouse). We demonstrate the proposed methodology to improve efficiency by reducing the inputs such as water, feed and energy.
[image:4.595.50.290.437.580.2]C. Phase 1: Process model derived with process mining We gather time stamps over a time period of 6 months that covers the 184 day fattening period. The activities are the same for each type of intensity, thus, we present one process model (Figure 3).
Fig. 3: Phase 1: Process model derived with process mining
The model shows that the process starts with stocking fish into the water tanks and ends with the process of selling. In between there are repeated activities that happen continuously in a daily manner (e.g. feeding of fish), weeks (e.g. adding new water) or monthly (e.g. hygienic cleaning RAS).
D. Phase 2: Application of DEA, as-is situation
For the given process, we define five relevant inputs and one output (final fish weight) since the aim is to minimize the input. (see Table 1).
TABLEI
INPUT AND OUTPUT OF FISH FATTENING
Inputs (per fish) Output (per fish)
Initial weight Weight
Average amount of feeding Average working time Power supply Water supply
In addition, we define three potential changes of the process and analyse the following scenarios:
• Scenario 1: It would be possible to completely automate the feeding. Thus far, an employee fills the fodder in a machine that releases the fodder automatically over time. In this scenario, a door would be installed in the wall of the building that allows to directly filling in the fodder from the delivery truck. In addition, storage capacity would be constructed that connects the door and the machine for releasing the fodder. The cost for this scenario would be 10.000 €. As a result, the activity “Feeding of fish” would be eliminated in the process.
• Scenario 2: In this scenario, taking the water probes would be automated, which is manually carried out in the as-is-situation. Indicators would be installed in the tanks to directly measure water nitrogen levels necessary to keep the fish environment in good conditions (survival rate). The cost for this option would be 5.000 € and the activity “Physical water variables” would be eliminated.
• Scenario 3: Within this scenario, the aim would be to develop a better procedure to clean the water. This would result in a lower frequency of the cleaning of the tanks. The cost for this option would be 40.000 € as it includes some research and development.
E. Phase 3: First comparison
We conduct the first DEA analysis for the as-is situation. The results compared to the artificial best value are as follows for the three types of intensity: (1) Intensive: .3822; (2) Semi-intensive: .3644 and (3) Extensive: .3202. All values are significantly higher.
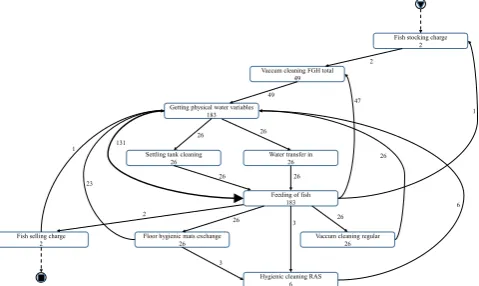
In the following, we build a simulation model that is based on the process model derived in phase 1. Information about working and waiting times are added. As fish fattening starts in an empty state, no warm-up period has to be considered. In addition, idle time optimisation is not in the focus as noted before. Figure 4 provides an overview on the simulation model.
Fig. 4: Phase 3: Simulation model as-is process Fish stocking charge
2
Floor hygienic mats exchange 26
Vaccum cleaning FGH total 49
Getting physical water variables 183
Water transfer in 26
Feeding of fish 183
Vaccum cleaning regular 26
Hygienic cleaning RAS 6 Settling tank cleaning
26
Fish selling charge 2
2
49
26 26
26
6 47
26
3 1
26
2
26
3 131
26 23
1
Fill up
stock Providing fodder Delay: One day
Clean stock Delay: 184 days
Water probes Delay: 7 days
Tank cleaning
Vacuum cleaning
Hygienic mats refilling
Fresh water adding
The results are then calculated for each scenario resulting in the DEA scores reported in table 2.
TABLEII
DEA SCORES OF PHASE 3
Types of intensity Scenario 1 Scenario 2 Scenario 3
Intensive .4222 .3872 .4212
Semi-intensive .4044 .3794 .3910
Extensive .3602 .3352 .3438
The results show that scenario 1 is dominant in terms of efficiency increase in each type of intensity.
F. Phase 4: Second comparison
In this phase, scenario 2 and 3 are implemented in the simulation model in addition to scenario 1. The comparison is repeated using the DEA scores. The results show that scenario 3 leads to an increase on top of scenario 1 in each type of intensity (Table 3).
TABLEIII
DEA SCORES OF PHASE 4
Types of intensity Scenario 2 Scenario 3
Intensive .4272 .4612
Semi-intensive .4094 .4310
Extensive .3652 .3838
G. Phase 5: Third comparison
Lastly, scenario 2 is implemented on top of scenario 1 and 3. The results of the DEA scores (Table 4) show, however, that there is still a small but non-significant increase of the efficiency scores possible. Thus, it would make sense to implement scenario 1 and 3 in the given exemplary process.
TABLEIV
DEA SCORES OF PHASE 5
Types of intensity Scenario 2
Intensive .4662
Semi-intensive .4360
Extensive .3888
VI. CONCLUSION
This article describes a new methodology for assessing process efficiency combining DEA, BPS and PM. Prior work was limited in describing the combination of DEA and BPS [e.g. 7] as well as BPS and PM [e.g. 8]. We not only combine all three methods from a conceptual perspective but also describe a methodology including a practical application procedure.
In addition, we demonstrate the capability of the methodology at the example of a livestock setting. This is an application context that has rarely been chosen and provides the opportunity to explore new application areas beyond traditional production and service processes. While there are some similarities that allow an application of the methodology to these contexts as well, different conditions apply and should be considered. Thus, a limitation is that we describe one application setting with empirical date that could be extended by production and service settings in future
work. Furthermore, we do not present an extended business case including the cost for initial investments over time. This should be addresses in future work as well.
Regarding further extensions, future work should focus on the exploration of the connection between direct (focussing on individual animals) and indirect (focussing on maintenance around the herd) activities. Another interesting extension would the application of the methodology on the level of single animals. This would require tracking individual animals and using their data to detect individual differences in the herd in a better way.
REFERENCES
[1] A. H. W. Yeung, Lo, Victor, H. Y., Yeung, Andy C. L., Cheng, T. C.
E., , "Specific customer knowledge and operational performance in
apparel manufacturing," International Journal of Production
Economics, vol. 114, no. 2, pp. 520-533, August 2008.
[2] L. B. Kofoed, F. Gertsen, and F. Jorgensen, "The role of CI and learning
in an organisational change process. Experiences from a longitudinal
study of organisational change," Integrated Manufacturing Systems,
vol. 13, no. 3, pp. 165-175, 2002.
[3] R. Doomun and N. V. Jungum, "Business process modelling,
simulation and reengineering. Call centres," Business Process
Management Journal, vol. 14, no. 6, pp. 838-848, 2008.
[4] B. F. van Dongen, "The ProM framework. A new Era in process mining
tool support, " in 26th International Conference on Applications and
Theory of Petri Nets, Berlin, Heidelberg, Springer, 2005, pp. 444-454.
[5] A. Charnes, W. W. Cooper, and E. Rhodes, "Measuring the efficiency
of decision making units," European Journal of Operational Research,
vol. 2, no. 6, pp. 429-444, July 1978.
[6] R. G. Sargent, "Verification and validation of simulation models,"
Journal of Simulation, vol. 7, no. 1, pp. 12-24, December 2013.
[7] A. Dohmen and M. Leyer, "Combining Data Envelopment Analysis
and Business Process Simulation for Analyzing the Efficiency of
Business Processes, " in International MultiConference of Engineers
and Computer Scientists 2010, S.I. Ao, O. Castillo, C. Douglas, D.D. Feng, and J.-A. Lee, Eds. Hongkong, China, Newswood, 2010, pp. 2134-2138.
[8] M. Leyer and J. Moormann, "Comparing concepts for shop floor
control of information-processing services in a job shop setting. A case
from the financial services sector," International Journal of Production
Research, vol. 53, no. 4, pp. 1168-1179, August 2015.
[9] T. J. Coelli, D. S. P. Rao, C. J. O´Donnell, and G. E. Battese, An
Introduction to Efficiency and Productivity Analysis. 2nd ed., New
York: Springer, 2005.
[10] R. Johnston and P. Jones, "Service productivity. Towards
understanding the relationship between operational and customer
productivity," International Journal of Productivity and Performance
Management, vol. 53, no. 3, pp. 201-213, 2004.
[11] C. P. McLaughlin and S. Coffey, "Measuring Productivity in Services,"
International Journal of Service Industry Management, vol. 1, no. 1,
pp. 46-64, 1990.
[12] U. Cantner, J. Krüger, and H. Hanusch, Produktivitäts- und
Effizienzanalyse. Der nichtparametrische Ansatz. Berlin Heidelberg:
Springer, 2007.
[13] A. Rozinat and W. M. P. van der Aalst, Decision Mining in Business
Processes, Eindhoven University of Technology, 2006.
[14] W. M. P. van der Aalst and A. J. M. M. Weijters, "Process Mining. A
Research Agenda," Computers in Industry, vol. 53, no. 3, pp. 231-244,
2004.
[15] M. Dumas, W. M. P. van der Aalst, and A. H. ter Hofstede,
Process-Aware Information Systems. Bridging People and Software Through
Process Technology Hoboken, NJ: Wiley, 2005.
[16] W. M. P. van der Aalst, B. F. van Dongen, J. Herbst, L. Maruster, G.
Schimm., and A. J. M. M. Weijters, "Workflow Mining. A Survey of
Issues and Approaches," Data and Knowledge Engineering, vol. 47,
no. 2, pp. 237-267, November 2003.
[17] W. M. P. van der Aalst and C. W. Günther, "Finding Structure in
Unstructured Processes. The Case for Process Mining," In Proceedings of the 7th International Conference on Applications of Concurrency to System Design, 2007. 2007, pp. 3-12.
[18] W. W. Cooper, L. M. Seiford, and J. Zhu, "Data Envelopment Analysis.
History, Models and Interpretations " in Handbook on Data
Envelopment Analysis, W.W. Cooper, L.M. Seiford, and J. Zhu, Eds.
[19] M. K. Epstein and J. C. Henderson, "Data Envelopment Analysis for
Managerial Control and Diagnosis," Decision Sciences, vol. 20, pp.
90-119, June 1989.
[20] M. Pidd, Computer Simulation in Management Science. 5 Chichester:
Wiley, 2004.
[21] Y. Liu, H. Zhang, C. Li, and R. J. Jiao, "Workflow simulation for
operational decision support using event graph through process
mining," Decision Support Systems, vol. 52, no. 3, pp. 685-697,
February 2012.
[22] P. R. McMullen and G. V. Frazier, "Using Simulation and data
envelopment," Journal of Productivity Analysis, vol. 11, pp. 149-168,
April 1998.
[23] M. Braglia and A. Petroni, "Data envelopment analysis for dispatching
rule selection," Production Planning & Control, vol. 10, no. 5, pp.
454-461, July-August 1999.
[24] A. Greasley, "Using process simulation within a
business-process reengineering approach," Business Process Management
Journal, vol. 9, no. 4, pp. 408-420, 2003.
[25] A. Rozinat, M. T. Wynn, W. M. P. van der Aalst, A. H. M. ter Hofstede,
and C. J. Fidge, "Workflow Simulation for Operational Decision
Support," Data & Knowledge Engineering, vol. 68, no. 9, pp. 834-850,
September 2009.
[26] A. Rozinat, R. S. Mans, M. Song, and W. M. P. van der Aalst,
"Discovering simulation models," Information Systems, vol. 34, no. 3,
pp. 305-327, 2009.
[27] L. Maruster and N. R. T. P. van Beest, "Redesigning business
processes. A methodology based on simulation and process mining
techniques," Knowledge and Information Systems, vol. 21, no. 3, pp.
267-297, 2009.
[28] Y. Liu, H. Zhang, C. Li, and R. J. Jiao, "Workflow simulation for
operational decision support using event graph through process
mining," Decision Support Systems, vol. forthcoming, pp. 2011.
[29] S. Bussmann, N. R. Jennings, and M. Woolridge, Multiagent Systems