Vol. 3 (1/2019)
Vol.3 (1/2019)
Editor in Chief: Aziz Pollozhani, PhD (NM)Editors:
Robert Pichler, PhD (Austria) Iraj Hashi PhD (England) Rizvan Sulejmani, PhD (NM)
Quirico Migheli, PhD (Italy) Iraj Hashi PhD (England) Zoran popovski, PhD (NM) Mimoza Dushi, PhD (RKS) Bekim Fetaji, PhD (NM) Olga popovska, Phd (NM)
Publisher: Mother Teresa University in Skopje, North Macedonia
Editorial Board
Alfonso Vargas Sanchez, PhD (Spain) Nezir Kraki, PhD (France) M. M. Sulphey, PhD (India) Marc Hill, PhD (Austria) Andrea Maliqari, PhD (Albania) Inge Hutter, PhD (Netherland)
Gëzim Karapici, PhD (Albania) Yavuz Emre Arslan, PhD (Turkey) Agni Dika, PhD (Kosovo) Ayhan Oral, PhD (Turkey)
Sermin Senturan, PhD (Turkey) Valentina Gogovska, PhD (North Macedonia) Mirko Perano, PhD (Italy) Anton Stoilov, PhD (Bulgaria)
Salvatore Rubino, PhD (Italy) Afrim Hamidi, PhD (North Macedonia)
Ruzhdi Sefa, PhD (Kosovo) Mehmed Ganic, PhD (Bosnia and Hercegovina) Sani Demiri, PhD (North Macedonia) Bashkim Ziberi, PhD (North Macedonia) Agim Mamuti, PhD (North Macedonia) Mesut Idriz, PhD (Bosnia and Hercegovina)
Kalman Mizsei, PhD (Hungary) Zoran Trifunov, PhD (North Macedonia) Shaban Buza, PhD (Kosovo) Isak Idrizi, PhD (North Macedonia) Fiona Todhri, PhD (Albania)
South East European Journal of Managing Editors: Sani Demiri, PhD
Sustainable Development Olga Popovska, PhD
ISSN (print) 2545-4463 Technical Editing/Layout: Besnik Hamiti ISSN (online) 2545-4471 Editorial Office: South East European is published twice a year. Journal of Sustainable Development
Account No. 160016267778815
723019 - 45 Mother Teresa University in Skopje, Tax No. 4080016561272 North Macedonia
Bank: Narodna Banka RM
12 UdarnaBrigada 2a/ VII, Skopje, North Macedonia
Phone: +389 2 3161 004
E-mail: [email protected]
Web: www.seejsd.unt.edu.mk
The publication of the Journal is supported by:
Ministry of Culture of North Macedonia
South East European Journal of Sustainable Development 4
Contents
SECTION A
Research article
ANALYSES OF ONLINE VIRTUAL LEARNING LAB FOR PROMOTING HIGHER EDUCATION COURSES AND COLLABORATION BETWEEN UNIVERSITIES
Bekim Fetaji, Mirlinda Ebibi, Majlinda Fetaji, Samet Kera
Professional article
IMPORTANCE OF VISUALIZATION IN MATH PROBLEMS AT THE UNIVERSITIES
Zoran Trifunov, TeutaJusufi- Zenku, Elena Karamazova, TatjanaAtanasova–Pachemska
Research article
MATHEMATICAL AND NUMERICAL MODEL OF THE STEAM TURBINE FOR SUSTAINABLE ENERGY SOLUTIONS
Vesna Antovska Knights, Olivera Petrovska Professional article
INTELLIGENT VEHICLES
Olivera Petrovska, Vesna Antovska Knights, Andon Petrovski, Jovan Hristoski
Professional article
PERFORMANCE ANALYSIS OF PARALLEL AND SEQUENTIAL SORTING ALGORITHMS – COMPARATIVE STUDY AND IMPLEMENTATION ON DIFFERENT HARDWARE PLATFORMS
Elham Hamiti, Valdete Hamiti Professional article
METHODS FOR ANALYZING AND SUPPORTING A SUSTAINABLE PRODUCTION SYSTEM
Albina Mucha, Monika Lutovska Professional article
A SUSTAINABLE URBAN TRANSPORT SYSTEM IN IZMIR CITY – TURKEY, WITH RECOMMENDATIONS FOR THE CITIES IN THE REPUBLIC OF NORTH MACEDONIA Emel Hamza Sherif
Research article
FLOW ANALYSIS OF UNGAUDED KACANDOL RIVER Arban Berisha
Professional article
HEATING, VENTILATING, AIR CONDITIONING SYSTEMS AND ERGONOMIC WORKPLACE SEAT IN THE FUNCTION OF A SAFETY AND PRODUCTIVE WORKING ENVIRONMENT
Isein Ajdari
Research article
THE RATE OF PESTICIDES PRESENCE IN THE GRAPE CULTIVATED IN KOSOVO
Vlora Rama
SECTION B
Case study
TAX SYSTEM AND RATES IN THE REPUBLIC OF KOSOVO AND THEIR COMPARACION WITH THE BALLKAN COUNTRIES
Refik Kryeziu
Case study
TECHNOLOGICAL CHANGE AND UNEMPLOYMENT IN DEVELOPING COUNTRIES – THE CASE OF THE REPUBLIC OF NORTH MACEDONIA
Simona Kovachevska
Case study
ROLE OF MARKETING IN THE PRODUCTION AND SALE OF KOSOVO WINE
Hamëz Rama, Vlora Rama
Case study
THE IMPORTANCE OF PROFIT PLANNING AND CONTROL PROCESS, A LITERATURE REVIEW
Agim Mamuti, Bujamin Bela
Case study
CHALLENGES THROUGH THE PROCESS OF TRANSFORMATION TO TEACHING HEALTH CARE INSTITUTIONS
Dardan Kocinaj, Idriz Berisha, Arben Boshnjaku, Kushtrim Grezda
Case study
STUDENTS BEHAVIOR ANALYSIS TO IMPROVE THE LEARNING PROCESS USING MOODLE DATE
Case study
EMIGRATION FROM SOUTHEAST EUROPE AND ITS ECONOMIC IMPACT ON SENDING COUNTRIES
Ilija Jovanov
Case study
TWINNING CITIES-A LINK FOR IMMIGRANTS AND DIASPORA WITH THEIR COUNTRIES OF ORIGIN Xhemail Çupi
Case study
THE CONTRIBUTE OF THE DIASPORA IN THE OVERALL SOCIAL WELFARE-THE CASE OD DEBAR
Fisnik Muça
Students Behavior Analysis to Improve the Learning Process Using
Moodle Data
Zoran Zdravev, Aleksandar Velinov, Aleksandra Nikolovska
GoceDelcev University, Stip, Republic of Macedonia, [email protected], [email protected], [email protected]
ABSTRACT:
The main purpose of this research is to analyze student behavior using Moodle Data from the e-learning system at the GoceDelcev University in Stip. Using the tables from the database, we created temporary tables that contain the number of activities for each user, on specific modules of the system. By determining the role of the users, we made a filtering of results and we got the number of activities for each student. To make the analysis, we used tools forBig Data analysis.After that, we performed clustering of students in several clusters. For this purpose, we usedk-means clustering technique and Elbow method to find the optimal number of clusters.At the end, we performed visualization of the clusters using the Scikit-learn Python library.With the knowledge gained from the analysis, in the future we can improve the learning process.
INTRODUCTION
The term “Big Data” refers to datasets that increase so much that it is difficult to analyze using traditional database management systems [1]. By using traditional techniques this process becomes quite complex. Therefore, special tools are used for analysis that are used to process and analyze big data. Data is generated from different sources and this is the reason for increasing big data. Recent years big data. In recent years, big data has appeared in many domains such as: health care, public administration, retail, biochemistry, education and so on [2]. In all these domains, big data are generated and it is virtually impossible to analyze them in terms of time for processing, method of analysis and presenting of results. If we analyze this data with traditional techniques, then we would take much more time. Some of the methods used in small data processing (for example the statistical method) are inadequate to handle big data. The way of presenting the analyzed results in small data is quite simple. This process becomes complex when we need to present the results of big data analysis. Prior to 2008, there was no determination whether the data were “small” or “big” data [3]. Then all data were called by the term known to us as small data. The term for big data was introduced because the number of data has steadily increased and the process of analysis, processing and storage has become complex. The term big data is defined by the four V’s: Volume, Velocity, Veracity and Variety [4]. Volume refers to the size of the data. Streaming of the data at much faster rates represents the velocity property. The veracity feature refers to the quality of the data available.Presenting data of different types is characteristic of the variety property. Big data can be analyzed to find associations, patterns, trends and to get knowledge. Particularly interesting area is the big data in education. We can use this data to get knowledge.
Knowledge discovery is an interdisciplinary area focusing mainly of methods for extracting meaningful and useful patterns from big data [5]. We can use the process known as Learning Analytics (LA) to improve the learning and teaching [6]. It refers to the measurement,
collection, analysis and presenting the data in order to optimize the learning.The main goal of Learning Analytics is the detection of patterns in learning data. Using the patterns, we can build hypotheses, confirm them, making conclusions and presenting the results from the analysis [7]. The other term devoted to analyzing data is Educational Data Mining (EDM). This term represents the process of developing and adapting statistical, machine learning and data-mining methods to study data generated by students and instructors [8]. The both processes (LA and EDM) are quite similar. The main difference is that the EDM focuses on the application of data mining techniques while LA includes other methods such as statistical and visualization tools or social network analysis techniques[9]. The basic idea in this research is by using LA and EDM techniques to gain knowledge about student behavior, which in the future can help us to improve the learning process. We present a workflow for analyzing Big Data from Moodle system. By creating temporary tables, we facilitate the process of Big Data analysis. The same tables in the future can be used for other research.
In Section 2 of this paper, it is presented the used technology and the dataset that we used in our research. The analysis of student behavior is presented in Section 3. The results of our research you can see in Section 4. The last section is conclusion of our work.
USED TECHNOLOGY AND DATA (material)
For the purposes of our research, we used the database of Moodle E-Learning Platform at the GoceDelcev University. At the beginning, we selected the tables from which we could extract some knowledge. The size of the database was 6.9 GB, and it contains data for a period of six years (2012-2018). Using the tables from the database, especially the table with logged user activities (mdl_logstore_standard_log), we created temporary tables that contained the data for individual users for a certain activity. We investigated the student activity for various Moodle modules such as: Forums, Lessons, Glossary, Assignments, Survey, Quizzes, Choices, Chats, and so on. These tables are presented in Section 3 of our research. We created
temporary tables using big data processing tools.We created two versions of tables for each module. The first version contains all user actions for the given modules. The second version contains all the actions except the action presented as “view” with which students only see something. For this, we used the Cloudera Hadoop distribution, and tools that are part of Cloudera such as Hive, Impala [10]. The key elements of this distribution are HDFS (Hadoop Distributed File System) and Reduce. HDFS can store a huge amount of data. Map-Reduce as a second core element of Hadoop is used for processing the data. It divides the work into a set of independent tasks for processing the data in parallel manner. For the clustering part, we have used Python distribution – Anaconda and Scikit-learn [11]which is a set of Python modules for machine learning and data mining. Also, we have used some libraries and modules from Scikit-learn, for the visualization part of the results that we got after we finished the clustering.
ANALYSIS OF STUDENTS BEHAVIOR (ActivitIes) (methods)
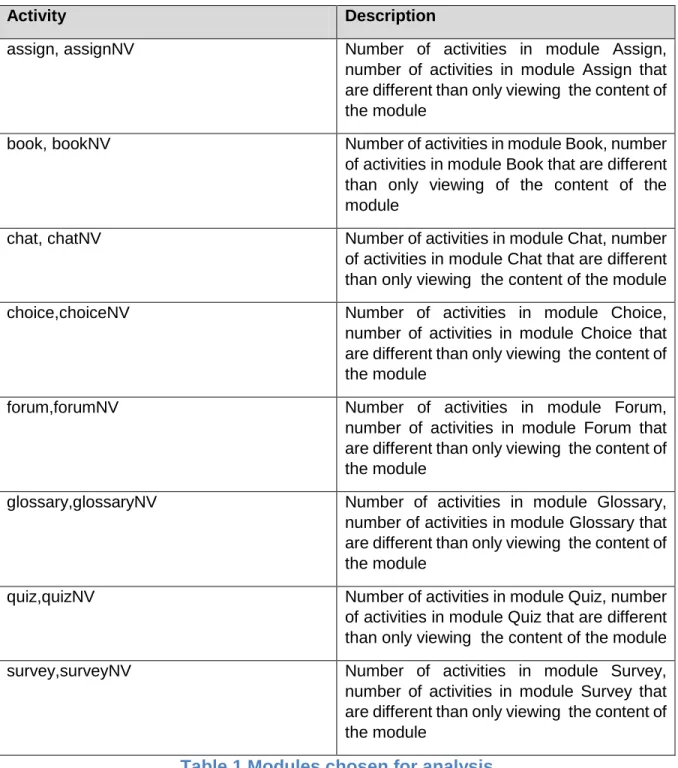
As we said before, in this research we have focused on analyzing the activities of the students in Moodle e-learning system. More precisely, our biggest challenge was to extract useful information from carefully chosen data from Moodle database which contains the information regarding every action of the students in the Moodle platform.In other words our main idea was to make a descriptive analysis of the student activities. In order to achieve this goal, we have decided to cluster the data about the student actions.First, we build dataset using tools and technologies mentioned in Section 2 of this paper. After we have completed the final version of the dataset, we proceed to the next phase of this research - clustering. For this purpose, we have used K-means algorithm and we tried to divide students in a few clusters, each with separate characteristics, based on the activities presented in Moodle modules which were subject of analysis. In the table below, are presented the selected modules from Moodle platform, which were the main basis for this work.
Activity Description
assign, assignNV Number of activities in module Assign,
number of activities in module Assign that are different than only viewing the content of the module
book, bookNV Number of activities in module Book, number
of activities in module Book that are different than only viewing of the content of the module
chat, chatNV Number of activities in module Chat, number
of activities in module Chat that are different than only viewing the content of the module
choice,choiceNV Number of activities in module Choice,
number of activities in module Choice that are different than only viewing the content of the module
forum,forumNV Number of activities in module Forum,
number of activities in module Forum that are different than only viewing the content of the module
glossary,glossaryNV Number of activities in module Glossary,
number of activities in module Glossary that are different than only viewing the content of the module
quiz,quizNV Number of activities in module Quiz, number
of activities in module Quiz that are different than only viewing the content of the module
survey,surveyNV Number of activities in module Survey,
number of activities in module Survey that are different than only viewing the content of the module
Table 1.Modules chosen for analysis
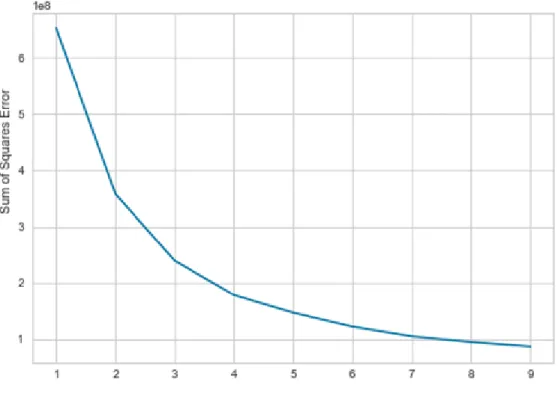
Before moving to the clustering part, we have done a research for finding the optimal number of clusters, and for this purpose we have used the Elbow method on our prepared dataset.
Figure 1.Elbow method – choosing the optimal number of K
Elbow method is a way to find the optimal value of K, while using K-means for clustering. This method calculates the variance (sum of squares) inside each of the clusters, and this is done for different values for number of clusters (Figure 1).
By implementing the Elbow method on our dataset, we make a decision to cluster the students in three clusters (K=3).
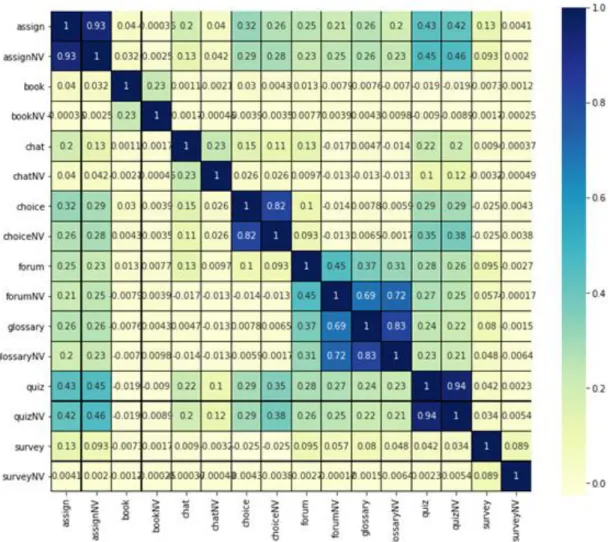
In order to get better preview of how our data looks like, and what are the relationships between attributes in the dataset, we build a matrix of correlation of the attributes in the
dataset (Figure 2). This is a statistical measure of the relation between two variables. So in our case, the matrix that we get is a review of the connection between the attributes in the dataset which is presented as a value in range from -1 to 1.
If the value of the correlation between two attributes is 0, that means that there is no correlation between the attributes. In other case, negative correlation means that if the value of the first attribute is increased, then the value of the second attribute is decreased and vice versa. Positive correlation means that the values of the two attributes are moving in the same direction.
Figure 2.Matrix of correlation for the attributes in the dataset
RESULTS and discussion
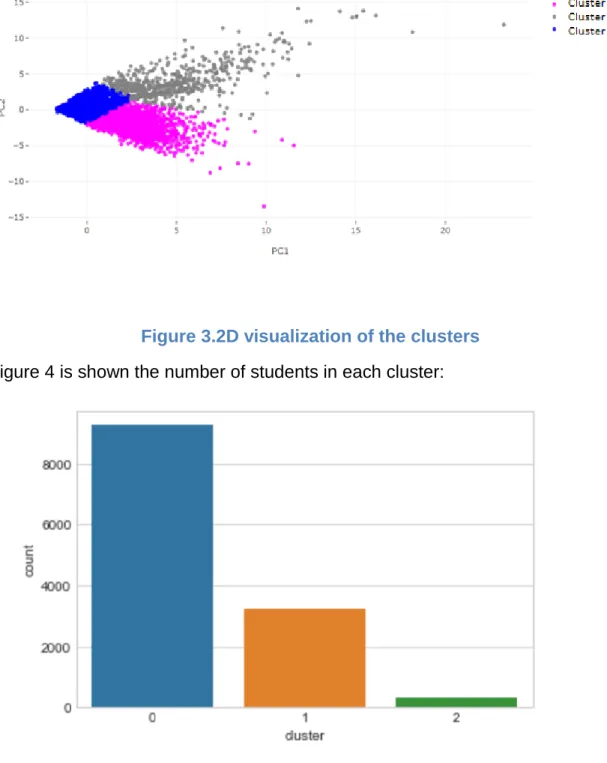
Finding the best way of presenting the results of the clustering, was the other challenge in our research. We have tried a few methods of visualizing the clustering results that we get. Speaking of this, we have used some functions from Scikit-learn Python library, which offers a plenty of options for visualizing the results while using different techniques of machine learning. Using the PCA(Principal component analysis) technique, the results that we get are shown in the Figure 3:
Figure 3.2D visualization of the clusters
In Figure 4 is shown the number of students in each cluster:
Figure 4.Number of students in each cluster
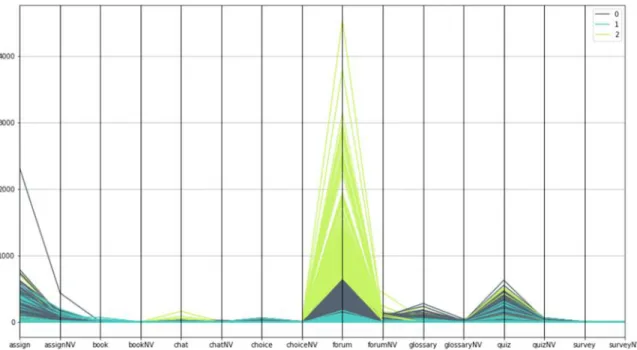
In the Figure 5,you can see the results that we got, for the activities of the students separated in three clusters. By showing the parallel diagram of all the activities in every module, and all that for every cluster, we can have better picture of how each one of the modules (student’s actions) is represented in each cluster.
Figure 5.All clusters and modules shown together
Based on the results, from the graph, we can see that the module forum is the most visited and used module from the students, and this is true for each one of the clusters. The modules for which the students shown the smallest interest are book, survey and choice and this is the case for the students belonging in each one of the defined clusters.
Combining the results shown in the previous graphs, we can say that the smallest cluster (cluster 2), contains the students which were pretty active in the explored modules in Moodle platform. In opposite, in the most numerous cluster (cluster 0), there are the students which based on their activities and actions in e-learning platform, are positioned somewhere in between students from cluster 2 and cluster 1.In other words, we can say that the largest part of the analyzed students, according to our research, are classified in a cluster which have characteristics of moderate usage of the Moodle e-learning system. In cluster 1, there are the students, which have shown minimal activities in the modules that were subject of our research. Finally, as we mentioned earlier, the most active students are classified in cluster 2, which in the same time is the cluster with the least number of students.
conclusion
We used Moodle data to get the number of student activitieson Moodle site. We created a dataset using big data analytics tools and then we extracted useful information from it. After we created the dataset, we made clustering. For that, we have used the K-means algorithm and we divide the students into few clusters using the number of activities on Moodle modules. Using the results, we can conclude that the cluster with most active student is also the cluster with the least number of students. In the future, we must provide techniques to increase the number of students in this cluster and their activities on Moodle. From all that been said we can say that from this research we got more information related on how Moodle modules were used in the years that were subject of analysis and based on the collected
information we have better picture of students activities. Beside the fact that we can utilize this information for deciding the future steps and plans for the teaching processes, the results also could be used as a base for some further research and analysis.
references
Elgendy, N., &Elragal, A. (2014, July). Big data analytics: a literature review paper. In Industrial Conference on Data Mining (pp. 214-227). Springer, Cham.
Acharjya, D. P., & Ahmed, K. (2016). A survey on big data analytics: challenges, open research issues and tools. Int. J. Adv. Comput. Sci. Appl, 7(2), 1-11.
Kitchin, R., &Lauriault, T. P. (2015). Small data in the era of big data. GeoJournal, 80(4), 463-475. Zhou, Z. H., Chawla, N. V., Jin, Y., & Williams, G. J. (2014). Big data opportunities and challenges: Discussions from data analytics perspectives [discussion forum]. IEEE Computational Intelligence Magazine, 9(4), 62-74.
Daniel, B. (2015). B ig D ata and analytics in higher education: Opportunities and challenges. British journal of educational technology, 46(5), 904-920.
Sclater, N., Peasgood, A., &Mullan, J. (2016). Learning analytics in higher education. London: Jisc. Accessed February, 8, 2017.
Rebholz, S., Libbrecht, P., & Müller, W. (2012, September). Learning analytics as an investigation tool for teaching practicioners. In Proceedings of the Workshop on Towards Theory and Practice of Teaching Analytics.
Liñán, L. C., & Pérez, Á. A. J. (2015). Educational Data Mining and Learning Analytics: differences, similarities, and time evolution. International Journal of Educational Technology in Higher Education, 12(3), 98-112.
Chatti, M. A., Dyckhoff, A. L., Schroeder, U., &Thüs, H. (2012). A reference model for learning analytics. International Journal of Technology Enhanced Learning, 4(5-6), 318-331.
[10] (2018) Cloudera. [Online]. Available: https://www.cloudera.com/ [11] (2018) Scikit-learn. [Online]. Available: https://www.scikit-learn.com