101
MEDIA KOMUNIKASI TEKNOLOGI
homepage URL : ejurnal.itats.ac.id/index.php/iptek
Development of artificial neural network for predicting the photodegradation
of Reactive Black 5 dye
Dika Rahayu Widiana1, dan Ryan Yudha Adhitya2
1Department of Waste Management Engineering, Surabaya Shipbuilding State Politechnic, Surabaya 60111, Indonesia
2
Department of Automation Engineering, Surabaya Shipbuilding State Politechnic, Surabaya 60111, Indonesia
INFORMASI ARTIKEL ABSTRACT
Jurnal IPTEK – Volume 23 Nomer 2, Desember 2019 Halaman: 101 – 116 Tanggal Terbit : 31 Desember 2019 DOI: 10.31284/j.iptek.2019.v23i2 .547
We applied a multilayer artificial neural network (ANN) developed using a Lavenberg–Marquadt algorithm to predict the photodegradation activity of the Reactive Black 5 (RB5) dye. A copper-doped titanium dioxide was employed as a photocatalyst. A copper doped titanium dioxide was synthesized through a wet-impregnation method. To optimize the network the operational parameters including the RB5 initial concentration, photocatalyst dose, irradiation time, hydrogen peroxide concentration, and visible light intensity were used as the input parameter. Removal efficiency of RB5 was selected as output. The number of neurons in the second hidden layer was optimized to determine the suitable ANN model structure for the RB5 removal. ANN based through Levenberg-Marquadth algorithm with structure 1-10-21-1 gave the best performance in this study. The criteria for the applicability of the model were the root mean square error (0.1) and coefficient of correlation (0.98275).
Keyword: artificial neural network; Levenberg–Marquadt; copper-doped TiO2;
photodegradation; Reactive Black 5.
EMAIL ABSTRAK
Multilayer artificial neural network (ANN) yang dikembangkan menggunakan algoritma Levenberg–Marquadt diterapkan untuk memprediksi potodegradasi dari Reactive Black 5 (RB5). Photocatalyst yang digunakan adalah titanium dioxide yang didoping dengan tembaga. Untuk mengoptimalkan pengoperasian parameter yang terdiri dari konsentrasi awal RB5, dosis photocatalyst, waktu iradiasi, konsentrasi hydrogen peroksida, dan intensitas visible light digunakan sebagai parameter input sedangkan effisiensi removal RB5 digunakan sebagai parameter output. Jumlah neuron di layer kedua dioptimalkan untuk menentukan struktur model ANN yang sesuai untuk potodegradasi dari RB5. ANN berdasarkan algoritma Lavenberg-Marquadth dengan struktur 1-10-21-1 memberikan performa terbaik pada penelitian ini. Kriteria untuk penerapan model adalah root mean square error (0.1) dan koefisien korelasi (0.98275).
Kata kunci: artificial neural network; Levenberg–Marquadt; copper-doped TiO2;
photodegradation; Reactive Black 5.
PENERBIT
LPPM- Institut Teknologi Adhi Tama Surabaya Alamat:
Jl. Arief Rachman Hakim No.100,Surabaya 60117, Telp/Fax: 031-5997244
Jurnal IPTEK by LPPM-ITATS is licensed under a Creative Commons Attribution-ShareAlike 4.0 International License.
102
INTRODUCTIONIndustrial activities cause water pollution. Textile industries are one of the largest polluters in the world. The World Bank has estimated that 20% of industrial water pollution originates from textile dyeing and the finishing treatment of fabrics. 72 toxic chemicals in the water solely from textile dyeing, and 30 of these chemicals cannot be removed [1]. Majority of the dyes used in textile industries are classified as azo dyes, which are the most problematic pollutants in textile wastewater [2].
Photocatalytic oxidation, an advanced oxidation process, is a promising and environment-friendly method for converting harmful organic dye substances into water and carbon dioxide [3].
Titanium dioxide (TiO2), a heterogeneous photocatalyst, is the most widely used photocatalyst
because of its strong oxidizing abilities (in decomposing organic pollutants), superhydrophilicity,
chemical stability, durability, nontoxicity, and low cost [4]. However, TiO2 responds only to
ultraviolet irradiation and absorbs a limited amount of visible light because of its wide band gap (3.2 and 3.0 eV for the anatase and rutile mineral forms, respectively). Copper is a widely used
transition metal that modifies the band gap of TiO2, resulting in enhanced absorption of visible
light [5].
The process of a photocatalytic activity is complex. Moreover, the absorption efficiency of
TiO2, despite its modified forms, tends to decline at high dye concentrations. Therefore, predicting
photodegration data through computational models would be useful. Artificial neural network (ANN) is a performance prediction tool for photocatalytic processes characterized by complex photocatalytic reactions [6]. ANN modeling had reliable, robust, and salient characteristics suitable for nonlinear relationships between the variables in a complex system [7]. The process of photocatalytic activity consists of input variables and an output factor [8]. Each input is varied and optimized to achieve the maximum efficiency of output.
In the present study, Reactive Black 5 (RB5), an azo dye, was used for modeling the dye degradation through ANN. For the first time, modeling of RB5 photodegradation by ANN using
copper doped TiO2 were studied. Several input variables were considered—photocatalyst dose,
amount of dye, hydrogen peroxide (H2O2) concentration, visible light intensity, and irradiation
time. The efficiency of removing RB5 was the output factor. Levenberg–Marquardt algorithm was adopted because of its learning capability and high efficiency. The Levenberg–Marquardt algorithm (a standard technique) solve nonlinear least square problems [9]. Min-Max normalization was applied to convert the value of primary data into normalized numbers (from −1 to 1). The result of normalized numbers was analyzed to determine the activation function. To obtain the optimum ANN model, the number of hidden layers (connection between input and output layers) was optimized through iteration until the minimum root mean square error (RMSE) was achieved.
LITERATURE REVIEW Photocatalyst
Photocatalytic oxidation, an advanced oxidation process, is a promising and environment-friendly method for converting harmful organic dye substances into water and carbon dioxide. Most of the photocatalytic dye degradation studies reported have been with Titanium dioxide as a
photocatalyst. However, the major disadvantage of TiO2 that it absorbs only in the UV region since
it has a band gap of around 3.2 eV. Copper is a widely used transition metal that modifies the band
gap of TiO2, resulting in enhanced absorption of visible light.
Artificial Neural Network
An artificial neuron network (ANN) is a computational model based on the structure and functions of biological neural networks. Information that flows through the network affects the structure of the ANN because a neural network changes - or learns, in a sense - based on that input and output. ANNs are considered nonlinear statistical data modeling tools where the complex relationships between inputs and outputs are modeled or patterns are found.
103
MATERIALS AND METHODSMaterials
All chemicals in the experiments were used without purification. Titanium isopropoxide
(Ti[OCH(CH3)2]4; 98%, Aldrich), ethanol (99.5%, Nihon Shiyaku), acetic acid (CH3COOH; 95%,
Scharlab), and HCl (95%, Aldrich) were used in synthesizing the photocatalyst. Copper nitrate
(Cu(NO3)2.3H2O; 99.5%, Merck) was used as a copper source. Hydrogen peroxide (H2O2; 30%,
Merck), TiO2 (P25) (anatase 80% and rutile 20%, 20 nm), and RB5 (C26H21N5Na4O19S6; 50%,
Aldrich) were used in the photocatalytic experiments. Table 1 presents the structure and characteristics of RB5. Deionized water was used throughout the experiments.
Table 1. Structure and characteristic of Reactive Black 5
Chemical structure Formula IUPAC name C26H21N5Na4O19S6 tetrasodium;(6Z)-4-amino-5-oxo-3-[[4-(2- sulfonatooxyethylsulfonyl)phenyl]diazenyl]-6-[[4-(2- sulfonatooxyethylsulfonyl)phenyl]hydrazinylidene]naphthalene-2,7-disulfonate Molecular mass 991.82 Maximum wavelegth of adsorption spectrum 597 nm
Photocatalyst synthesis and characterization
TiO2 was synthesized through a modified sol-gel method [10]. A mixture of 3 mL titanium
isopropoxide, 14 mL ethanol, and 1 mL acetic acid was stirred for 30 min. Afterward, 12 mL each of ethanol and acidified deionized water (pH was adjusted to 2 by using 1 M HCl) were added to this mixture, and it was then stirred continuously for 12 h. The resulting thickened mixture was dried in an oven at 80 ºC overnight; finally, it was calcined in a furnace at 500ºC for 2 h.
A copper-doped photocatalyst (Cu/TiO2) was synthesized through a wet-impregnation
method [11]. A mixture of 1 g TiO2 and 50 mL deionized water was stirred. A solution of 0.27%
Cu was pepared by dissolving the desired amount of Cu(NO3)2.3H2O in 4 mL ethanol, and this
solution was added to the aforementioned mixture. Afterward, the obtained mixture was placed in a water bath at 70 °C, which was continuously stirred, to evaporate most of the water. The resulting mass was dried in an oven at 80 ºC overnight and calcined in a muffle furnace at 500 °C for 5 h.
The synthesized Cu/TiO2 was crushed in a mortar, and it was then sieved (50–80 mesh) to obtain a
homogeneous powder. A composite Cu-doped TiO2 photocatalyst was finally synthesized.
The structure and morphology of Cu/TiO2 were investigated using a scanning electron
microscope (SEM, Hitachi S-4800, Japan) at an acceleration voltage of 30.0 kV. X-ray diffraction (XRD) analyses on a Bruker D8 Advance Eco diffractometer (40 kV, 40 mA) were performed to
characterize TiO2 (P25) and Cu/TiO2. The XRD patterns were recorded from 20 to 80° at a scan
rate of 0.2°/s. Energy dispersive X-ray (XRD) analysis was conducted to determine the Cu content
104
remaining in the test solution was measured using a Genesys 10s ultraviolet-visible (UV-Vis) spectrophotometer (Thermo-Scientific) at a wavelength of 597 nm.
Photocatalytic degradation experiments
The photodegration experiment was conducted using a batch reactor (250-mL Pyrex glass beaker) (Figure 1). A compact fluorescent lamp (13, 20, or 27 W) was installed 15 cm above the
beaker. The experimental setup was covered using a box coated with an aluminum foil. Cu/TiO2
was added to the beaker containing 100 mL of RB5 solution. H2O2 was also added as an oxidizing
agent. After the addition of Cu/TiO2and H2O2, the solution under magnetic stirring at a constant
rate was kept in the dark for 60 min to achieve adsorption-desorption equilibrium. Irradiation time started when the lamp was turned on; this point was taken as zero time. Afterward, the solution was irradiated with visible light for 180 min. Samples were taken using pipet every 30 min and analyzed using a Genesys 10s UV-Vis spectrophotometer (Thermo Fisher Scientific, US). The dye removal efficiency was calculated using the following equation:
... (1)
where At and A0 were the solution absorbance at time t and 0, respectively.
Magnetic stirrer Pyrex glass beaker Dark box
Aluminum foil Fluorescent lamp
Photocatalyst + RB5 + H2O2
Figure 1. Experimental setup.
Development of artificial neural network
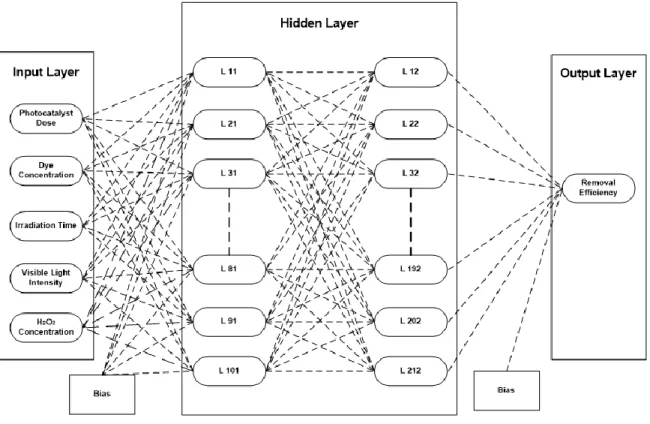
ANN contains a series of mathematical equations used for simulating patterns based on learning and memory. In other words, ANN is patterned after the structure of the human brain [12]. In the present study, ANN was developed using Levenberg–Marquardt, a multilayer feedforward backpropagation algorithm. Experimental data were obtained using the ANN tool in MATLAB 2013a. Figure 2 diagrams the architecture of ANN, which comprised an input layer, two hidden layers, and an output layer—these layers were all interconnected by parallel nodes. Interconnections of nodes were qualified by weighted connections. The nodes of the input layer are passive (i.e., they do not modify data). Each node receives a single value as an input and duplicates the value to its multiple outputs. In contrast, the nodes of both the hidden and output layers are active (they modify data). The variables (L11, L21, .... L212) hold the data to be evaluated.
105
Figure 2. Architecture of artificial neural network.
In ANN, three steps must be underlined. First is the preparation of primary data, which are divided into training, validation, and testing data. Training data adjust the weights on the neural network. Validation data minimize overfitting. Testing data analyze the final solution to confirm the network predictive power. Second is the normalization. Min-Max normalization converts the original data into normalized ones, because the working value in the ANN structure is between −1 to 1. Third is the determination of activation functions, which are crucial to ensure that the calculation of input and weight values is within the normalized range. If the activation function is incorrect, then RMSE is large. The logsig transfer function is used in ANN applications if the normalized range were between 0 to 1 and to use tansig if the range were between −1 to 1 [13].
Table 2 indicates the details of the transfer functions used in the Levenberg–Marquardt algorithm adopted by the present study. In a feedforward backpropagation neural network, the first layer (input) sends data via weights to the nodes of the second layer (hidden layer) and then to the third layer (output). If the predicted output has an error, where the error is a gap between the actual removal efficiency (target) and the predicted removal efficiency, then iterations are continued (weight value is updated) until the predicted is close enough to the target (depends on the error tolerance set before the training). In the present study, the number of neurons was modified several times, and the root mean square error was used as a criterion for choosing the optimum structure of the ANN.
Table 2. Algorithms of the transfer functions used for developing the ANN model.
Transfer function Algorithm
purelin purelin (n) = n, for all n
logsig logsig (n) = 1 (1 + exp(−n))
RESULTS AND DISCUSSION Photocatalyst Characterization
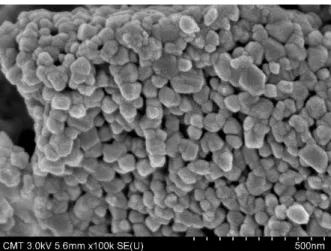
Figure 3 illustrates the SEM morphology of the synthesized photocatalyst, which
106
shape. On average, the particle sizes were uniform. The SEM analysis did not confirm the presence of Cu, probably because the Cu metal dopant may have been integrated into the basic structure of
TiO2 [14].
Figure 3. Scanning electron microscopic image of copper-doped titanium dioxide.
XRD was measured to describe the photocatalyst crystalline structure. Figure 4 compares
the XRD patterns of TiO2 (P25) and Cu/TiO2. Peaks in Cu/TiO2 were observed at the following 2θ
values: 25.26, 37.77, 48.0, 53.84, 55.02, 62.62, 68.67, 70.25, and 75.00°. These peaks agree with those of the standard spectrum (JCPDS no 01-075-2246). However, the two XRD patterns differed
at 2θ = 27.4, which describes the rutile polymorph in TiO2 (P25). The sample crystallinity was
influenced by the annealing temperature [15]. No characteristic peaks were attributed to the Cu
metal, which is probablly due to the low metal concentration in the TiO2 matrix.
20 30 40 50 60 70 80 In te n si ty ( a .u ) 2 theta (degree) Cu/TiO 2 TiO 2 (P25)
Figure 4. X-ray diffraction patterns of commercial titanium dioxide and copper-doped titanium dioxide.
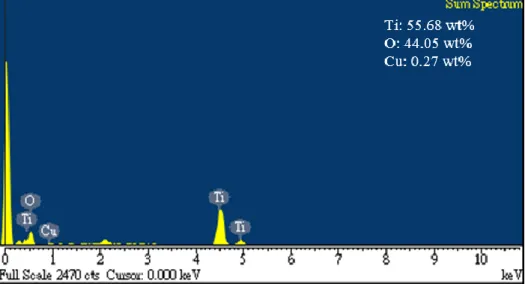
Figure 5 presents the EDX analysis of the Cu-doped TiO2. The quantitative analysis reveals
the presence of Ti (55.68%), O (44.05%), and Cu (0.27%). No other components were observed, indicating that the synthesized photocatalyst contained no impurities.
107
Figure 5. Spectral data of copper-doped titanium dioxide.
Mechanism of photocatalytic activity
When the synthesized photocatalyst (Cu/TiO2) was illuminated under a visible light during
the photocatalytic degradation process in the presence of an oxidizing agent, an electron migrated
from the valence band to the conduction band and formed electron–hole (e-–h+) pairs. The
generated hole in the valence band can produce hydroxyl radicals that attack organic pollutants, resulting in a complete decomposition of toxic compounds into harmless molecules. The
photogenerated e- and h+ are vigorous oxidizing and reducing agents, respectively; their reactions
are given as follows:
H2O +h+→OH+H+ ...(2)
e− + H2O2→OH+OH− ...(3)
e− + O2→O2−, H2O2 +O2−→OH+OH− +O2 ...(4)
Eq. 2 generates hydroxyl radicals through the oxidation step, as a result of the reaction between the positive holes and the absorbed water. The reduction step leading to the hydroxyl
radical generation can occur either by direct or indirect routes. H2O2 can react with electrons (Eq.
3) to generate hydroxyl radicals directly. The indirect route (Eq. 4) is composed of two steps: (1)
O2 adsorbed on Cu/TiO2 reacts with e− to produce super oxide anions (O2−); (2) O2− reacts with
H2O2, resulting in the hydroxyl radical generation. When reduction and oxidation do not occur
simultaneously, electrons would accumulate in the conduction band. Therefore, this would cause
increased rate of e− and h+ recombination. Because recombination leads to energy waste, it should
be prevented to ensure efficient photocatalysis. The role of a dopant in photocatalysis is to keep the
charges separate by trapping the electrons of TiO2; consequently, the recombination of e− and h+
would be suppressed. Cu2+ions, which are absorbed on the TiO2surface, can act as electron trapping
centers. Hence, Cu2+ ions increase the electron-hole pair separation efficiency [16].
A preliminary experiment was conduced to determine the effect of Cu-doped TiO2 on
photocatalysis. Figure 6 compares the photocatalytic activities of TiO2 (P25) and Cu/TiO2. The
experimental conditions were as follows: initial dye concentration = 20 mg L-1, photocatalyst
concentration = 0.55 g L-1, H
2O2 solution concentration = 0.5 M, irradiation time = 180 min, and
visible light intensity = 360 Wm-2. The RB5 degradation efficiency was 56.43 % for TiO
2 (P25)
and 87.98 % for Cu/TiO2. The higher performance of Cu/TiO2 is caused by doping TiO2 with the
108
TiO2 Cu/TiO2 0 10 20 30 40 50 60 70 80 90 100 R em ov al Efficie nc y (%) PhotocatalystFigure 6. Comparison of photocatalytic activities of commercial titanium dioxide and copper-doped titanium dioxide.
Effect of operational parameters on photodegradation efficiency Effect of the initial dye concentration
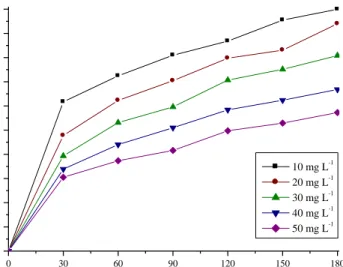
We determined the effect of the initial concentration of RB5 on the dye degradation.
Except for the initial dye concentration, which was varied from 10 to 50 mg L-1, the other
operational parameters were held constant: 0.55 g L-1 Cu/TiO2, visible light irradiation at 360 W
m-2, and 0.5 mol L-1 H2O2 solution added. At a given irradiation time, Figure 7 indicates that the
dye removal efficiency decreased as the initial dye concentration increased, which is generally the
case. For 10 mg L-1 initial dye concentration, the dye removal efficiency was 100% at 180 min.
When the dye concentration was twice as much (20 mg L-1), the efficiency was lower at 93.97%
at the same irradiation time of 180 min. When the conconcentration was much higher at 50 mg L
-1
, the efficiency dropped to 57.25% at 180 min irradiation time. At increased dye concentrations, the photocatalyst active sites would not be enough to accommodate the dye adsorption [17].
0 30 60 90 120 150 180 0 10 20 30 40 50 60 70 80 90 100 R e mo va l Effici e n cy(%) Time(min) 10 mg L-1 20 mg L-1 30 mg L-1 40 mg L-1 50 mg L-1
109
Effect of the photocatalyst dosageFigure 8 plots the data on the influence of varying the amount of Cu/TiO2—from 0.25 to
0.55 g L-1—in the presence of 10 mg L-1 of dye and 0.5 mol L-1 H2O2 and under a visible light
intensity of 360 W m-2. At 180 min irradiation time, the dye removal efficiency increased from
80.63 to 100% with increasing photocatalyst dose from 0.25 to 0.55 g L-1. The photocatalytic
activity was enhanced because of the greater number of actives sites at higher photocatalyst dose, in addition to possible light scattering and screening effects [17].
0 30 60 90 120 150 180 0 10 20 30 40 50 60 70 80 90 100 R e mo va l Effici e n cy(%) Time(min) 0.55 g L-1 0.45 g L-1 0.35 g L-1 0.25 g L-1
Figure 8. Effect of photocatalyst concentration on the removal of Reactive Black 5.
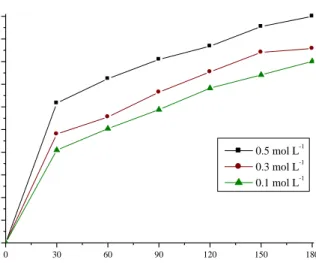
Effect of the H2O2 concentration
The influence of varying the H2O2 concentration (from 0.1 to 0.5 mol L-1) on the dye
removal was investigated, with the other parameters held constant: 10 mg L-1 of dye, 0.55 g L-1
Cu/TiO2, and 360 W m-2 light intensity. H2O2 is a stronger electron acceptor than oxygen
according to its high oxidation potential and electrophilicity [18]. The presence of H2O2 led to a
more efficient generation of hydroxyl radicals and inhibition of electron–hole pair recombination; hence, the photodegradation of compound was enhanced [19]. The maximum photodegradation
was observed using 0.5 mol L-1 of H2O2 (100% dye removal at 180 min irradiation time) (Figure
9). 0 30 60 90 120 150 180 0 10 20 30 40 50 60 70 80 90 100 R e mo va l Effici e n cy(%) Time(min) 0.5 mol L-1 0.3 mol L-1 0.1 mol L-1
Figure 9. Effect of hydrogen peroxide concentration on the removal of Reactive Black 5.
110
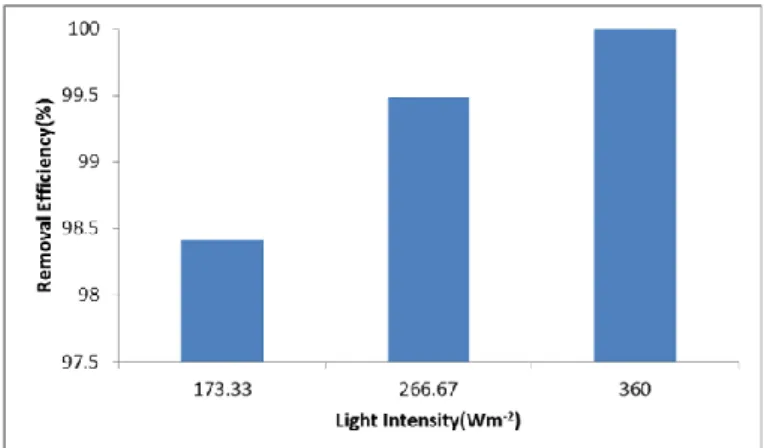
Figure 10 illustrates the effect of changing the visible light intensity on the dye removal.
Three different light intensities (173.39, 270, and 360 W m-2) were employed for the following
photodegradation conditions: 10 mg L-1 dye, 0.5 mol L-1 H2O2, and 0.55 g L-1 Cu/TiO2. The dye
removal efficiency increased with the visible light intensity. This is due the generation of more free hydroxyl radicals on the photocatalyst surface under the irradiation of visible light at a higher intensity [20].
Figure 10. Effect of visible light intensity on the removal of Reactive Black 5.
Model for the photodegradation data
Artifical neural network model development
Table 3 indicates the units and range of values of independent variables as input parameters. Experimental data set at different operational parameters were used to train, validate, and test the artificial neural network model. To develop an optimum ANN model, the type of ANN must be specified. The ANN used in the present study was a feedforward backpropagation neural network. The training method used the Levenberg–Marquardt algorithm, which is commonly applied to model highly nonlinear data. The Levenberg–Marquardt training method was more suitable for modeling photocatalytic degradation than the other methods such as conjugate gradient, scaled conjugate, resillent backpropagation, and even gradient descent [17].
Table 3. Units and range of values of various input variables.
Input variables Unit Range
Photocatalyst dose g L-1
0.25 0.55
Dye concentration mg L-1
10 50
Irradiation time min 0 180
Visible light intensity W m-2 173.33 360
H2O2 concentration mol L-1 0.1 0.5
Normalization of experimental data
A total of 192 sets of data—obtained from the photodegradation experiments—were divided into training data (75%), validation data (10%), and testing data (15%). Each set of data was normalized using the Min-Max normalization, which is a simple technique for fitting specific data in a predefined boundary. The normalization refers to the process of dividing the data with the data range (maximum data − minimum data); the following equation was used [21]:
min max min 0 x x x x x xn n .... (5)
where xn = normal data, x0 = experimental data, xmin = minimum experimental data, and xmax =
maximum experimental data.
The normalized value ranged between 0 and 1. The logsig transfer function was applied by following the procedure in a previous research [13], which proved that logsig was the most
111
suitable transfer function for modelling the RB5 photodegradation. Training and testing data were used as a criterion to end the iteration when the RSME was stabilized. These data were used to compute and ensure robustness of the network parameter.
Appropriate combination of transfer functions
In the present study, the logsig transfer function was tested in the hidden layer and combined with the purelin transfer function in the output layer to determine the best coefficient of
correlation (R2). The combination of logsig in the hidden layer and purelin in the output layer in
the Levenberg–Marquadt algorithm yielded a higher R2 compared with that of the other
combination of transfer functions [17]. The transfer function is one of the parameters in ANN that can optimize the model. Calculating the normal data and weight in the hidden layer produces a large number, which must be converted into a working value by using a transfer function, because the ANN system has a working value from −1 to 1. An incorrect transfer function would lead to a
prediction number that deviates from the target (R2< 1). A correct transfer function would lead to
convergence of the predicted number and the target (R2 ͠1).
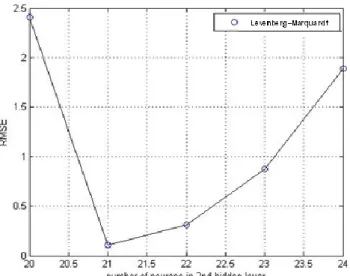
Optimization of the number of neurons
The number of neurons in the first hidden layer was selected as 10. In the second hidden layer, the number was varied from 1 to 25. On the basis of the minimum RMSE for the training and prediction, the optimum number of neurons was determined. For 21 neurons, the RMSE was 0.1. Figure 11 reveals the optimum number of neurons. The RMSE decreased with increasing hidden neuron sizes and increased when the number of hidden neurons was greater than 21. Accordingly, the optimum layer structure for modeling the RB5 photodegradation consisted of the following parameters and the corresponding optimum numbers: input layer = 5, first hidden layers = 10, second hidden layers = 21, and output layer = 1.
Figure 11. Relationship between the number of neurons and the root mean square error.
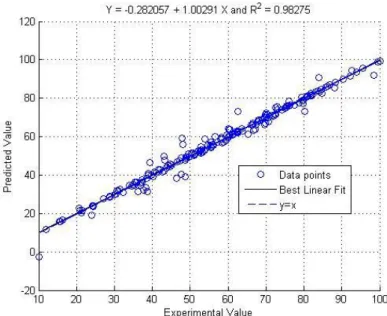
Validation and testing of the artificial neuron network model
Figure 12 is a regression plot of the target values compared with the predicted output. To validate the ANN model performance, the neutral network toolbox in MATLAB was used. The optimum model structure was attained by modifying the number of neurons in the hidden layers. In the present paper, the minimum RMSE was obtained from 10% of the data from validation and 15% of the data from testing. The data interpretation is given in the next section (section 3.4.6).
112
Figure 12. Comparison between the predicted and experimental output values.
Results of the artificial neuron network model
Figure 13 presents the regression analyses for training, validation, and testing and for the overall data. R values are 0.99925, 0.95731, and 0.97579 for the training, validation, and testing, respectively. Therefore, the ANN model can predict the experimental data accurately in the training and testing stages.
Figure 13. Comparison between predicted and experimental values (training, validation, and testing).
Figure 14 indicates the RMSE for each data division (training, validation, and testing). The iteration in the training was terminated when the network converged and the RMSE for
validation and testing divisions was constant at the 74th iteration. In the present study, thebest
validation was obtained at the 24th iteration, where the RMSE was 4.7021 . The mininum RMSE
113
Figure 14. Artificial neural network performance plot.
Figure 15 summarizes the ANN model results. The network was trained using the
‘trainlm’ (Levenberg–Marquadt) algorithm, and the RMSE was minimized to 110-5. The
network was trained for 1000 iterations. The final result indicates that the training perfomance had an RMSE of 0.1. This means that the average error between the target and the predicted removal efficiency in the model was 0.0111. In this research, the RMSE was comparable with the RMSE criterion; therefore, the ANN model could predict accurately the dye removal efficiency from highly nonlinear input data.
114
CONCLUDING REMAKSANN using the Levenberg–Marquadt approach was applied to model the RB5 degradation
over the Cu/TiO2 photocatalyst. The results indicate that the copper-doped TiO2 (composite
photocatalyst) synthesized through calcination at a high temperature exhibited higher absorption of
visible light compared with TiO2 (P25). The effect of operational parameters, such as the RB5
initial concentration, photocatalyst dose, irradiation time, concentration of H2O2, and visible light
intensity, on the RB5 removal efficiency was investigated. The experimental and predicted values were compared. The optimum hidden layer structure for the ANN model comprised 10 neurons in the first layer and 21 neurons in the second layer. A logsig-purelin transfer function was used. For
the RB5 removal, the RMSE was 0.1 and R2 was 0.98275 .
DAFTAR PUSTAKA
[1] Kant, R. (2012). Textile dyeing industry an environmental hazard. Natural Science, 4, 22–26. [2] Lucas, M.S., Peres, J.A. (2006). Decolorization of the azo dye reactive black 5 by fenton and
photo-fenton oxidation. Dyes and Pigments, 71, 236–244.
[3] Kuyumcu, O.K., Kibar, E., Dayioglu, K., Gedik, F., Akin, A.N., Aydinoglu, S.O. (2015). A
comparative study for removal of different dyes over M/TiO2 (M = Cu, Ni, Co, Fe, Mn and Cr)
photocatalysts under visible light irradiation. Journal of Photochemistry and Photobiology A:
Chemistry, 311, 176–185.
[4] Nakata, K., Fujishima, A. (2012). Invited review TiO2 photocatalysis: Design and applications.
Journal of Photochemistry and Photobiology C: Photochemistry Reviews, 13, 169–189.
[5] Tian, F., Wu, Z., Yan, Y., Ye, B.C., Liu, D. (2016). Synthesis of visible-light-responsive Cu
and N-codoped AC/TiO2 photocatalyst through microwave irradiation. Nanoscale Research
Letters, 11, 292.
[6] Eskandarloo, H., Badiei, A., Behnajady, M.A., Ziarani, G.M. (2016). Hybrid homogeneous and heterogeneous photocatalytic processes for removal of triphenylmethane dyes: artificial neural network modeling. Clean Soil Air Water, 44, 739–739.
[7] Abdollahi, Y., Zakaria, A., Abbasiyannejad, M., Masoumi, H.R.F., Moghaddam, M.G., Matori, K.A., Jahangirian, H., Keshavarz, A. (2013). Artificial neural network modeling of p-cresol photodegradation. Chemistry Central Journal, 7, 96.
[8] Abdollahi, Y., Zakaria, A., Sairi, N.A., Matori, K.A., Masoumi, H.R.F., Sadrolhosseini, A.A., Jahangirian, H. (2014). Artificial neural network modelling of photodegradation in suspension
of manganese doped zinc oxide nanoparticles under visible-light irradiation. The Scientific
World Journal, 2014, 1.
[9] Pakrou, V., Pakrou, S., Nasermehrdadi, Amiri, M.J. (2015). Prediction of pollutant removal in
the treatment plant of industrial shahid salimi town using ANN. Current World Environment,
10, 899–907.
[10] Li, C., Sun, Z., Xue, Y., Yao, G., Zheng, S. (2016). A facile synthesis of g-C3N4/TiO2 hybrid
photocatalyst by sol-gel method and its enhanced photodegradation towards methylene blue under visible light. Advanced Power Technology, 27, 330-337.
[11] Boningari, T., Pappas, D.K., Ettireddy, P.R., Kotrba, A., Smirniotis, P.G. (2015). Influence of
SiO2 on M/TiO2 (M = Cu, Mn, and Ce) formulations for low-temperature selective catalytic
reduction of NOx with NH3: surface properties and key components in relation to the activity
of NOx reduction. Industrial & Engineering Chemistry Research, 54, 2261–2273.
[12] Tu, J.V. (1996). Advantages and disadvantages of using Artificial Neural Networks versus Logistic Regression for predicting medical outcomes. J Clin Epidemiol, 49, 1225–1231. [13] Syai’in, M., Soeprijanto, A., Yuniarno, E.M. (2011). New algorithm for neural network
optimal power flow (NN-OPF) including generator capability curve constraint and statistic-fuzzy load clustering. International Journal of Computer Applications, 36, 1.
115
[14] David, A.O., Tahir, M., Amin, N.A.S. (2015). Copper modified TiO2 and g-C3N4 catalysts for
photoreduction of CO2 to methanol using different reaction mediums. Malaysian Journal of
Fundamental and Applied Sciences, 11, 102–105.
[15] Wang, W.K., Chen, J.J., Zhang, X., Huang, Y.X., Li, W.W., Yu, H.Q. (2016). Self-induced
synthesis of phase-junction TiO2 with a tailored rutile to anatase ratio below phase transition
temperature. Scientific, 6, 1.
[16] Sohrabi, S., Akhlaghian, F. (2016). Modeling and optimizaton of phenol degradation over
copper-doped titanium dioxide photocatalyst using response surface methodolgy. Process
Safety and Environmental Protection, 99, 120–128.
[17] Das, L., Maity, U., Basu, J.K. (2014). The photocatalytic degradation of carbamazepine and
prediction by artificial neural networks. Process Safety and Environmental Protection, 92,
888–895.
[18] Tseng, D.H., Juang, L.C., Huang, H.H. (2012). Effect of oxygen and hydrogen peroxide on the
photocatalytic degradation of monochlorobenzene in TiO2 aqueous suspension. International
Journal of Photoenergy, 2012, 1.
[19] Saggioro, E.M., Oliveira, A.S., Pavesi, T., Maia, C.G., Ferreira, .F.V., Moreira, J.C. (2011). Use of titanium dioxide photocatalysis on the remediation of model textile wastewaters containing azo dyes. Molecules, 16, 10370–10386.
[20] Rasoulifard, M.H., Dorraji, M.S.S., Ghadim, A.R.A., Babaeinezhad, N.K. (2016). Visible-light photocatalytic activity of chitosan/polyaniline/CdS nanocomposite: Kinetic studies and artificial neural network modeling. Applied Catalysis A: General, 514, 60–70.
[21] Jayalakshmi, T., Santhakumaran, A. (2011). Statistical normalization and back propagation for classification. International Journal of Computer Theory and Engineering, 3, 1793–8201.