Abstract
We develop a novel cell coverage estimation method based on radio fingerprints collected from practical wireless service systems. A large size radio fingerprint map that shows cell identifiers and signal strength measurements on grid segmentation is built for effective estimation of cell coverage. An essential part of cell coverage estimation is radio fingerprint data cleansing and compensation. Based on this proposed iterative fingerprint data analysis method, we detect the proper cell borderline for each cell site. By the proposed method, we can efficiently estimate the cell coverage of each cell site without difficult manual field measurements. Moreover, mobile service providers can economically plan network configuration and manage subscribers using these advances in cell coverage estimation.
Keywords:Cell coverage; Radio fingerprint; Data analytics
1 Introduction
Accurate estimate of cell coverage is essential for cellular network design and deployment. Cell coverage is usually defined as the maximum distance, from a mobile user to a serving cell site, while maintaining sufficient service quality. It is well known that cell coverage is related to signal attenuation or path loss. The maximum path loss determines the maximum cell coverage. The Okumura-Hata [1] or COST-231 [2] models are generally utilized as path loss models. The various link budget parameters shown in [3] are applied as input factors to the path loss models, then useful information can be extracted for network deployment, such as the location of cell sites re-quired to cover the target area. Some of these parame-ters are within the control of the designer, such as transmit (Tx) power levels, antenna orientation, or tilt [4]. By manipulating these parameters, network opera-tors try to optimize wireless cell coverage. The literature [5-7] describes several methods for optimizing wireless cell coverage. An optimization method focuses on cover-age and antenna configuration by using a simulated an-nealing/tabu search [5]. A multi-objective algorithm is used to determine a series of solutions for locating the
access points of wireless local area networks (WLANs) to maximize coverage and QoS [6]. A multi-criteria gen-etic algorithm has also been presented that selects cell sites from candidate sets with the goal of maximizing in-frastructure, cost efficiency, and coverage while constrain-ing pairwise cell overlap [7]. Another focus of research on cell coverage is the inverse relationship of coverage to traf-fic load in a cell. An increase in the volume of active traftraf-fic in the cell causes the interference at the cell site, and ef-fective cell coverage is consequently decreased [8]. The coverage estimation based on traffic load estimation in a cellular network was thoroughly analyzed in [9]. They cal-culated the outage rate caused by interference and then restricted the effective cell coverage within an outage rate threshold.
The exact estimation of cell coverage is applicable to cellular network management. Combined with demo-graphics and foot traffic of a particular area, decisions of cell split, addition, or re-configuration are performed. In this article, we propose a novel cell coverage estimation method using radio fingerprint data. A radio fingerprint map is built based on the measured radio fingerprint data. A grid segmentation of the fingerprint map pro-vides an efficient frame in which to store a large amount of fingerprint data. Each grid contains a reference cell identifier in the form of a reference Pilot Number (refer-ence PN for 3G WCDMA) or Physical Cell ID (PCI for * Correspondence:[email protected]
2
Department of Information and Communications Engineering, Sejong University, 98 Gunja-dong Gwangjin-gu, Seoul 143-747, South Korea
Full list of author information is available at the end of the article
4G LTE) and its signal strength measurement value. A customized data analysis method that consists of cleans-ing and compensation is applied to the fcleans-ingerprint map. From understanding the cell shapes, outlier fingerprint data are eliminated by the iterative data cleansing method. In addition, the data compensation method can keep fin-gerprint data integrity and confirm the proper cell border-line for effective cell coverage estimation. This effective coverage estimation creates powerful advantages for net-work planning and operation. For instance, economic planning for subscriber penetration is a good example. The scheduled subscriber penetration plan has a critical impact on radio resource planning for commercial service providers.
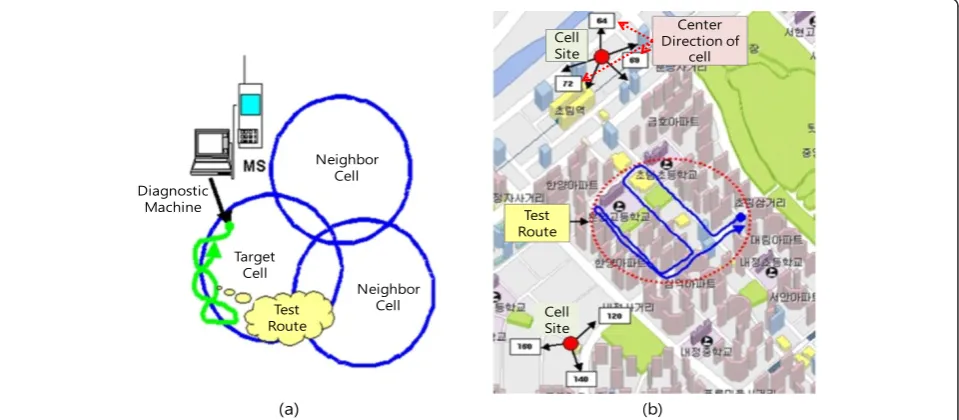
2 Coverage estimation by radio fingerprint maps The traditional method of estimating cell coverage is tracking the radio signal over the actual fields. Figure 1 shows typical ways to track radio signals. The diagnostic machine (DM) attached to a mobile station (MS) collects the radio signal while travelling a test route in Figure 1a. Figure 1b shows an example of a test route. The selected test route is usually located at the intersection of two adjacent cell sites.
Radio signal tracking is one of the most intricate pro-cesses in wireless network planning. It needs a special-ized diagnostic machine and analysis procedure. The radio signal should be scanned during a specific time band and analyzed by a custom-designed tool. Furthermore, the en-tire procedure of tracking and analysis is performed manu-ally. This complexity restricts the wide adoption of manual tracking, despite its relatively higher estimation precision. In [10], researchers suggest a variation of manual tracking
to estimate cell coverage. A cell site could receive and de-termine the signal quality measurements of forward and reverse links at a particular location of a MS. The distribu-tion of measured signal quality informadistribu-tion could deter-mine cell coverage.
As an alternative to manual tracking, we adopt beam lobe estimation (see Figure 2). The beam lobe estimation is based on radio propagation. The propagation shape of a radio beam can be estimated by path loss models [11]. Then, the shape of the beam lobe is calibrated considering geograph-ical objects (e.g., buildings and roads) to estimate the actual cell coverage. However, radio propagation models contain various errors and uncertainties, such as noise level fluctu-ation, traffic loads, moving objects, and so on. The beam lobe model needs both of geographical map and manual measurement of cell configuration (i.e., center direction and antenna beamwidth of radiation). The 3D geographical map data may be obtained from an external map building com-pany. However, the purchasing or operational cost of exter-nal maps is the problem of mobile service providers. The purchasing cost of the entire 3D digital map of South Korea is approximately one million USD and the periodic maintenance of geographical map is additionally charged. In addition, the manual measurement of cell configuration is laborious for mobile service providers. Considering the large number of base stations and cells, the manual process can contain several erroneous measurements. In the ongoing operational phase in particular, there can be many operational mistakes in measurements, which can adversely affect practical system performance.
The proposed cell coverage estimation uses the radio fin-gerprint map to overcome the limitations of beam lobe es-timation and manual signal tracking. The radio fingerprint
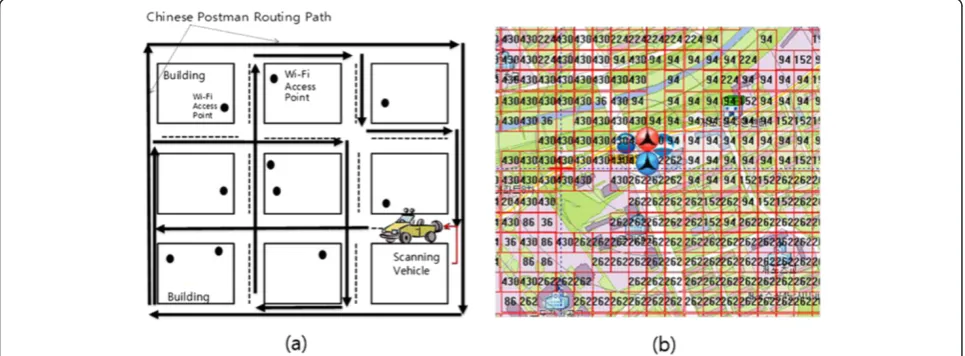
data contains cell identifiers and signal strength indexes. The cell identifier is the reference pilot number for 3G WCDMA or physical cell ID for 4G LTE. The signal strength index denotes the Received Signal Strength Index (RSSI). In general, radio fingerprint data are collected by wardriving that is suitable for collecting fingerprint data over a wide range [12]. Data acquisition methods are based on a variety of modes of transport such as walking, bicy-cles, motorcybicy-cles, and cars. In small urban environments, walking or travelling by bicycle can be sufficient for data collection. However, for large-scale fingerprint data collec-tion, fingerprint data should be collected using a fully equipped vehicle. The entire process of vehicle-based war-driving is fully automated and the radio fingerprint map is automatically generated. Figure 3 shows an example of a radio fingerprint map in a cellular system. Figure 3a shows a simplified diagram for fingerprint collection by a scan-ning vehicle. A scanscan-ning vehicle runs through the metro-politan area to make an entire radio fingerprint map. For efficient fingerprint collection, a fingerprint collector seg-ments an entire area into multiple fractions and builds effi-cient scanning routes for each fraction. The most popular method of building scanning routes is Chinese Postman
Routing. Chinese Postman Routing is a very well-known postman tour or route inspection method of finding the shortest closed path or circuit that visits every edge of a graph. This method can be used to obtain the optimal Eulerian circuit (a closed walk that covers every edge once). The complexity to solve the Chinese Postman Routing is known as O(V3+E).V denotes the intersection of roads andEdenotes the sectioned roads.
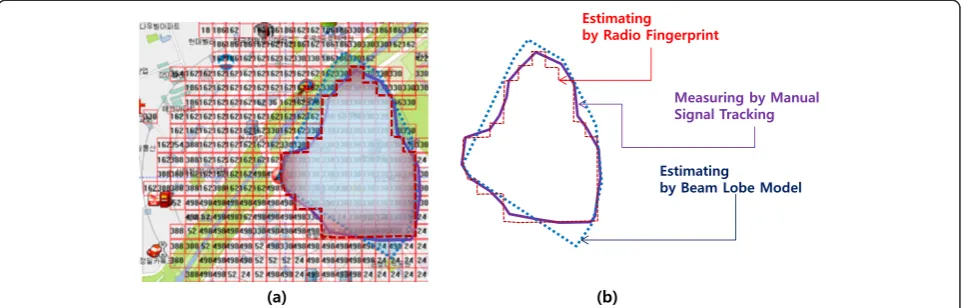
The radio fingerprint map in Figure 3b is composed of a large number of grids. The grids have a fixed size (for example, 50 × 50 m) in a given geographical region, and each grid is indexed. Figure 4 shows the numeric cell identifier that is specified by the radio propagation from cell sites. In 3G WCDMA, the pilot number has a nu-meric range from 1 to 512 and the Physical Cell ID value is taken from the address space of 504 IDs for 4G LTE. The MS gets the PN or PCI from the parameters used for the downlink reference signalsviaa cell broadcasting channel. Given the distribution of radio fingerprints on grids, we can effectively estimate the cell coverage, as shown in Figure 4. The grid borderline of a specific cell identifier shows the specific cell coverage itself. Figure 4a represents the cell coverage over the radio fingerprint Figure 2Beam lobe model application for cell coverage estimation.
map and Figure 4b shows the difference between this method and other coverage estimation methods: beam lobe estimation and manual tracking.
Note that in practical cellular systems, there are many interference factors. A single grid is influenced by mul-tiple cell sites and radio relay stations. Thus, a single grid can have multiple cell identifiers with different sig-nal strength indexes. We should determine a single cell identifier per grid as a reference cell identifier(ref. Cell-ID) for fingerprint-based cell coverage estimation. The grid borderline of a ref. Cell-ID shows the coverage of cell with the ref. Cell-ID. Generally, the cell identifier with the highest RSSI becomes the ref. Cell-ID. How-ever, the complexity of radio interference leads to errors for RSSI measurement. If the selection of cell identifiers from the highest RSSI is only a way to set the ref. Cell-ID in all cases, we find many irregularities in the distri-bution pattern of a ref. Cell-ID. In addition to a typical three-sector cell formation (e.g., Figure 5a), we can find various atypical patterns (e.g., Figure 5b,c) in empirical
studies. These irregularities need careful pre-processing of the radio fingerprint data for effective cell coverage estimation. Proper fingerprint data analytics such as cleansing and compensation for grid borderline detec-tion are essential to fingerprint-based estimadetec-tion of cell coverage.
3 Radio fingerprint data analytics for grid borderline detection
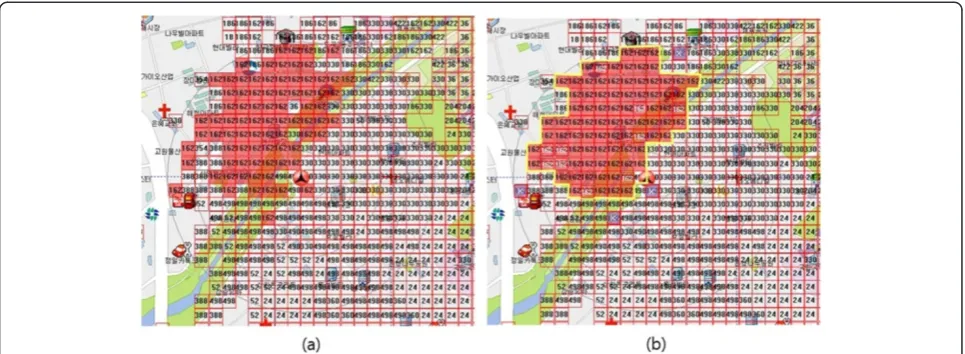
Figure 6 shows an example of cell borderline detection. Using proper fingerprint data cleansing and coherent compensation, we find the definite cell borderline. The cell borderline defines cell coverage clearly.
In Figure 6, we can find the white ref. Cell-ID num-bers that are newly compensated ref. Cell-IDs. The grids with the‘X’marker are grids eliminated by the cleansing procedure. The yellow line shows the final borderline of the target cell coverage. As shown in the example of cell borderline detection, the cleansing and compensation are essential analytical tools to identify the cell coverage. Figure 4Coverage estimation by radio fingerprint. (a)Coverage illustration on map.(b)Coverage comparison.
A logical solution for many problems is to clean the data to enhance the solution quality: exploring the data set for possible problems and endeavoring to clean the er-rors. Of course, for any real world data set, doing this data cleansing and/or relational data integrity analysis
‘by hand’ is completely out of the question, given the amount of person-hours required [13]. While a data cleansing method can uncover a number of possible er-rors in a data set, it does not address other, more complex errors. Errors or irregularities that involve relationships among multiple fields are often very difficult to uncover. These types of errors require serious inspection and ana-lysis to be cleaned: statistical [14], clustering [15], pattern-based [16], and association [17] techniques are used to identify patterns that can uncover the data error or irregu-larities. In addition, informative patterns [17] and‘garbage patterns’ of meaningless or mislabeled patterns [18] are used to perform data cleansing. Machine learning tech-niques are also used to cleanse data in the written charac-ter classification problem. However, none of the mentioned researches can present an effective tool for general data cleansing. A data cleansing activity has a very domain-specific applicability [19]. General purpose data cleansing methods, such as the Kalman filter [20], do not have the specific knowledge needed to effectively eliminate the outliers to detect the borderline of a cell. Thus, we de-veloped a customized data cleansing method for effect-ive fingerprint-based cell coverage estimation.
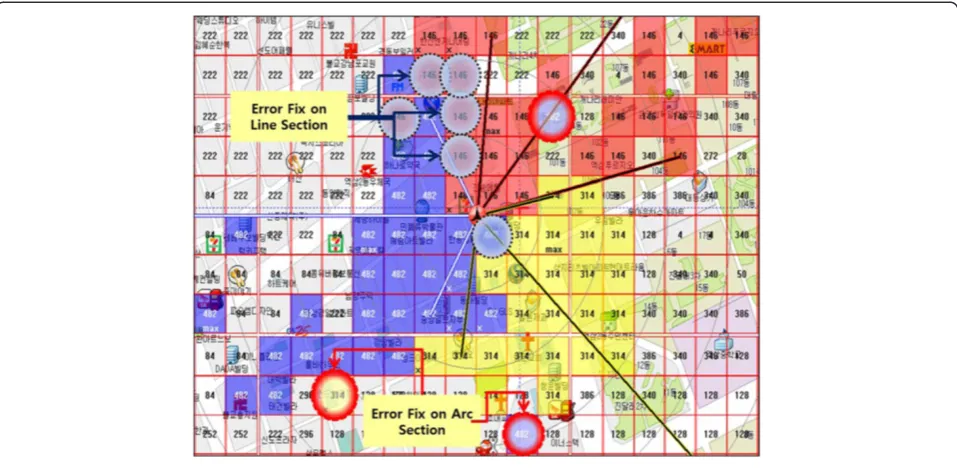
The majority of errors originate at the boundaries of cell coverage. The typical cell of a circular sector form has two types of boundaries: arc section and line section (see Figures 7 and 8). Errors in the arc section can be easily detected and fixed. The majority of errors in these sections have been found to be a form of ‘island grid’ identified as the red circles in Figure 7. A simple inspec-tion of the ref. Cell-IDs of neighbor grids is sufficient to
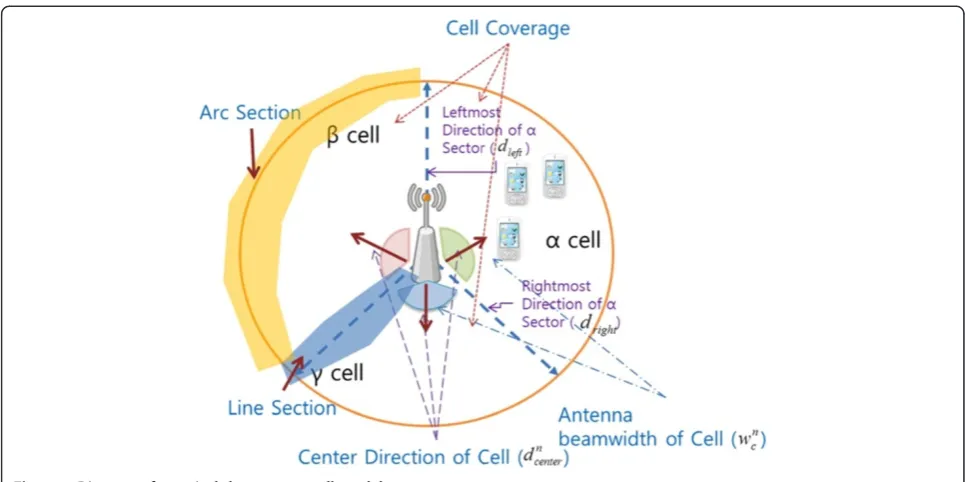
detect grids with erroneous fingerprints. The coher-ent compensation is then applied to these grids. The compensation process is described in the latter part of section 3. However, errors in line sections are hard to detect and fix. The black circles in Figure 7 show examples of grids in line sections. Because of the prox-imity to the cell center, multiple Cell-IDs with strong RSSI measurements are usually detected for each grid. Thus, it is hard to determine which grid belongs to a specific cell. To determine and fix the errors in line sec-tions, an iterative fingerprint cleansing is proposed. This iterative cleansing method uses the phenomena of directional radio radiation that make a cell form into a circular sector. Figure 8 shows a typical three-sector cell model: a single base station supports α, β, and γ cells. Each cell has a circular sector form. A circular sector has two determinants that characterize its shape: center direction and antenna beamwidth. The antenna beam-width can be determined by the leftmost and rightmost directions of the circular sector.
The irregular fingerprints in the line sections are de-tected by finding the leftmost and rightmost directions of a circular sector cell form. Given the leftmost and rightmost directions, we can detect the grids that are lo-cated outside of the target cell. When the function direc-tion (i) returns the angular direction of grid i, the grids that satisfy the following condition (1) are determined to be outliers.
directionð Þi <dright or directionð Þi >dleft; ifdleft>dright directionð Þi <dright directionð Þi >dleft; ifdleft<dright
ð1Þ
where dleft is the leftmost direction of a circular sector
cell form and dright is the rightmost one. The following
pseudocode details the process of finding erroneous Figure 6Example of cell borderline detection. (a)Original fingerprint.(b)Compensated fingerprint and borderline detection.
fingerprint data given the leftmost and rightmost direc-tions. Note that the following code also includes errone-ous fingerprint detection in the arc section by a simple inspection of the ref. Cell-IDs of neighbor grids.
The S means a set of grids which have the same ref. Cell-ID. The values of dleft and dright of the target cell are updated during the iterative calculation of antenna beamwidth and center direction of the target cell. After the fingerprint data cleansing is performed by the above code using the current dleftand dright, we obtain newly updated proper fingerprint data (i.e., the updated ref. Cell-ID data for each grid). Using the updated proper ref. Cell-ID data, we calculate the updated antenna beam-width for each cell. The antenna beambeam-width of a target cell can be calculated by counting the number of grids (gc) that have the target cell's ref. Cell-ID within the current
dleftanddright. The counting procedure is described in the following pseudocode.
The antenna beamwidth of thenth iteration wn c can
now be given as
wnc ¼360gc=gBS ð2Þ
where gBS is the total number of grids in the analysis
area. A series of circular areas from the center of the cell can be selected as the analysis area. For example, circles with a 100-, 200-, or 500-m radius can be the target ana-lysis area. The anaana-lysis area does not have any relation to cell coverage itself. But, we obtain the antenna beam-width by grid counting and the ratio ofgcovergBS. Thus,
we should set a standard circular area to obtain proper ratio of gc over gBS. The larger area contains a larger
larger area contains many erroneous ref. Cell-IDs which would be invalid for borderline detection.
The center direction of the target cell is simply esti-mated using the currentdleftanddright. We can obtain the center direction of the nth iteration dncenter by simply aligning the center of the boundary grids as follows (3).
dncenter¼drightþ 1
2 dleft−dright
; fordleft>dright
dncenter¼drightþ 1
2 360−dright
þdleft
; fordleft<dright
8 > < > :
ð3Þ
After fixing the antenna beamwidth and center direc-tion of the target cell for thenth iteration, we recalculate the leftmost and rightmost directions of the target cell as follows (4):
dleft¼dncenterþ 1 2w
n
c; dright ¼dncenter− 1 2w
n
c ð4Þ
Then, the cleansing procedure runs again with the newly updateddleftanddright. The new cleansing procedure deter-mines the center direction and antenna beamwidth ofn+ 1th stage. This iterative approach continuously enhances the accuracy of the cell borderline detection in the line
section. The iteration finishes when the difference between thenth andn−1th stage values is within a certain bound (i.e., wn
c−wnc−1
≤δ). The following pseudocode presents the entire iterative structure for cleansing fingerprint data.
gBS. A single iteration contains counting operations by gBS times. When the difference bound (δ) is given, the number of iterations is limited to 360/δ times. There-fore, the overall complexity of cleansing for a single cell is bounded as O(360/δ×gBS). In the case of the differ-ence bound (δ) as the smallest integer value (i.e., δ= 1), where all angular directions are measured by an integer value, the number of iterations is limited to 360 times. Therefore, the overall complexity of cleansing for a sin-gle cell is practically bounded asO(360gBS).
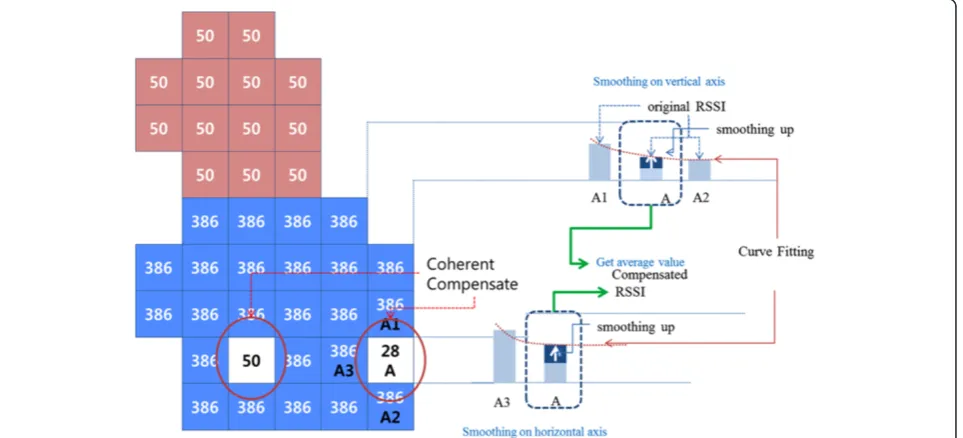
Next, we perform a coherent compensation process to assign the proper ref. Cell-IDs to erroneous grids in the arc section. We can calibrate the imperfectly measured RSSI values in the radio fingerprint by using the compen-sated ones. The imperfection of measurement is observed as the temporal fluctuation of RSSI measurement. The temporal fluctuation of RSSI measurements are widely ob-served in collecting and building a radio fingerprint map. Figure 9 shows the concept of compensation. If an island-type erroneous grid is detected by the inspection of the neighbor grids' ref. Cell-IDs, we select the vertical and horizontal neighbor grids and apply a smoothing tech-nique. By curve fitting with neighboring RSSI values, the two newly compensated RSSI values are obtained accord-ing to both the vertical and horizontal axes. The final compensated RSSI value is calculated by averaging the two vertical and horizontal compensated RSSI values. When the compensation for RSSI is completed, we select the cell identifier with the highest RSSI as the new ref. Cell-ID. Note that, the temporal fluctuation of RSSI used in the proposed compensation method is the possible key to discrimination between deep-faded grids and erroneous grids. The deep-faded grids are not influenced by the
compensation. The compensation method is only applic-able to the temporal fluctuation of RSSI.
4 Numerical results
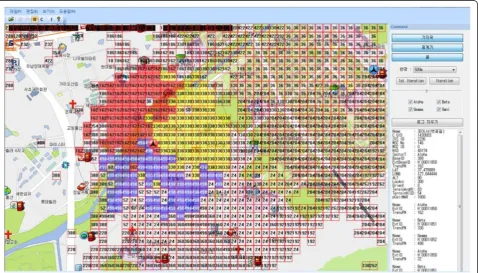
To test the proposed method, we developed a cell cover-age estimation program which has a map of an urban (Gangnam) area in South Korea. The test area has a total of 47,439 grids and we collected complete ref. Cell-ID and RSSI (i.e., fingerprint) data by actual wardriving. The cell coverage estimation program includes all the collected fingerprint data of the grids and the position data of cell sites. The positions of cell sites were ob-tained using an information database from a commercial WCDMA system. In addition, the cell coverage estima-tion program contains the posiestima-tion informaestima-tion of the relay stations. All the information for grids, cell sites, and relay stations are shown in a map and information window of the cell coverage estimation program. The area shown in the map window can be moved by sim-ple mouse drag operations. The function of map pan-ning in/out is implemented by simple menu directions. To determine the coverage of the cell site, we first simply select a cell site in the map window. After the se-lection, we set the analysis area for the coverage. Five different radii for the analysis area can be selected: 100, 200, 300, 400, and 500 m.
The results of the estimation are given by the iterative approach. The ‘iteration’ command can be activated by one button press in the coverage estimation program, giv-ing the result of a sgiv-ingle iteration. Each iteration is given the information of the cell areas: leftmost/rightmost direc-tions, denoted as ‘min/max degree,’center direction of a cell, denoted as‘center,’and antenna beamwidth, denoted
resent the manually measured coverage of the cell site. The area enveloped by dotted lines show the estimated coverage by the empirical models, such as beam lobe es-timation or fingerprint-based eses-timations. From the geo-graphical relationships among them, we classify three regions as following:
RegionA: included in both the Measured and Estimated Coverage
RegionB: included in the Estimated Coverage, but not in the Measured Coverage
RegionC: included in the Measured Coverage, but not in the Estimated Coverage
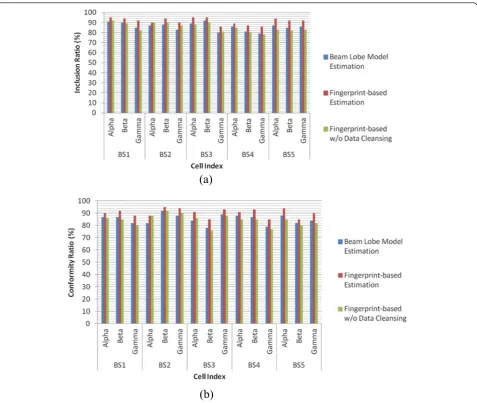
The primary criterion is Inclusion Ratio, defined as A/(A + C). A good estimation should contain a large amount of measured coverage within the estimated cover-age. However, even a simple overestimation of the cell
and conformity ratios for fingerprint-based cell coverage estimation. The cell coverage measurements from man-ual signal tracking are the given as a ground truth for the inclusion and conformity ratio calculations. For comparison, the results of the beam lobe model esti-mation are also presented, based on the approach of a spatial moving least squares (MLS) method [21]. The improvement of the inclusion ratio is observed for all of the experiments. The average value of the beam lobe model is 85.9%, and the fingerprint-based estimation is 91.4%, giving an improvement of 5.5%. In addition, the proposed fingerprint-based estimation also improved the conformity ratio. The average value of the beam lobe model is 85.1% and the fingerprint-based estimation 90.3%, giving an improvement of 5.2%. Note that, we add the fingerprint-based estimation without data cleansing and compensation. There is no significant enhancement without data analytics: slightly lower performance is
observed (−0.6% for inclusion ratio, −0.8% for con-formity ratio).
The practical processing time of proposed cell border-line detection method is very fast. All operations of method are elementary integer arithmetic and numbers of iterations are bounded to practically less than 10 times. For the tested 15 cells, total practical processing time is less than 1 second using a plain PC server. Com-pared to beam lobe model estimation, which needs the logarithm calculation of path loss model, the processing time of proposed method has competitive advantage. Apparently, fingerprint collection by wardriving is a time-consuming procedure. However, the beam lobe model also requires geographical map data for estimation.
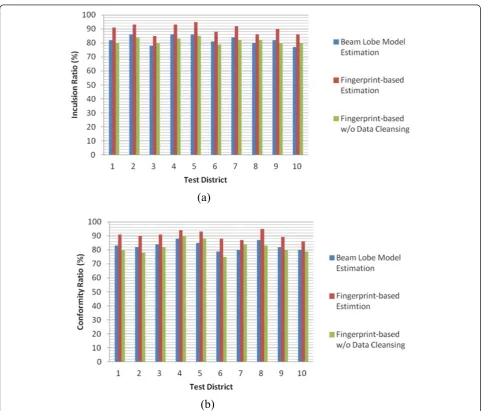
We next extended our cell coverage estimation method to a large area. We selected districts in Gangnam, Seoul as our targets. A total of ten test districts were selected for the extended test (see Figure 13). All fingerprint data of Figure 11Performance measurement frame.
effectiveness of the proposed method in the diverse envi-ronments of an urban area. An improvement of the inclu-sion ratio is observed for all test districts. The average value of the beam lobe model is 82.2%, and the fingerprint-based estimation is 89.9%, giving an improvement of 7.7%. Figure 13Test districts in Gangnam, Seoul.
In addition, the proposed fingerprint-based estimation also improved the conformity ratio. The average value of the beam lobe model is 83.0%, and the fingerprint-based esti-mation is 90.4%, giving an improvement of 7.4%. Note that, we add the fingerprint-based estimation without data cleansing and compensation. There is no signifi-cant enhancement without data analytics: slightly lower performance is observed (−0.7% for inclusion ratio,−1.1% for conformity ration).
5 Conclusions
In this paper, we dealt with cell coverage estimation. The problem is to find precise cell coverage information for proper network design and operation. By gathering complete radio fingerprint data in the test area, we make a grid map with reference cell identifiers and signal strengths. Based on this fingerprint map, we can estimate the cell coverage. The fingerprint data cleansing and compensation for borderline detection is an essential part of cell coverage estimation. Given our understanding of circular sector cell configura-tions, we developed an iterative data cleansing and compen-sation method. As a result of an appropriate cleansing and compensation method, we can detect a tight cell borderline. We presented the entire estimation procedure and a cover-age estimation program that consists of a large amount of radio fingerprint data and a proposed procedure. The useful-ness of the developed algorithmic procedure and coverage estimation program is proven by actual fingerprint data col-lected from a commercial wireless service provided by SK Telecom, Korea. A field engineer can now estimate cell coverage without manual operations using this simple cover-age estimation program. Note that, the fine grid granularity guarantee higher performance. But it also generates higher cost for fingerprint data collection. Thus, we select single-sized grids in building a radio fingerprint map (e.g. 50 × 50). To enhance the accuracy on estimation, we can adopt vari-able granularity: fine granularity for cell border area and coarse granularity for cell inner area.
Appendix
The sample proportion (^p) is a good candidate for a statistical estimator. The sample proportion represents the population proportion (p). The size of sample ref-erence points (n) is determined by the error tolerance limit (ε). To restrict the estimation error (i.e., p^−p) within ±ε, the size of the sample reference points is given as Equation 5.
n¼pð1−pÞZ
2 a=2
ε2 ð5Þ
whereZa/2is the standard score (orZvalue) obtained from
the probability table of standard normal distribution. When we set 1−a as the existing probability of estimation error
within the error tolerance limit (i.e.,Pð−ε<^p−p<þεÞ ¼1−a),
to follow a standard normal distribution. Then,
ε
ffiffiffiffiffiffiffiffiffiffiffiffiffiffi
pð1−pÞ=n
p ¼Za=2. However, the population proportion (p) is generally unknown. Thus, we setpto 0.5 for conservative error estimation (εis maximized whenpis 0.5). Finally, we derive the size of the sample reference points as follows:
n¼0:25Z2a=2=ε2 ð6Þ
To restrict the estimation error (i.e.,^p−p) within ±0.05 (i.e., the error tolerance limit is 5%) under the 95% probability (i.e.,Pð−0:05<^p−p<þ0:05Þ ¼0:95), we se-lect approximately 384 samples to represent the total population.
Competing interests
The authors declare that they have no competing interests.
Acknowledgements
This research work is supported by SK Telecom, South Korea. All data are collected using the facility of SK Telecom. This work was also supported by the National Research Foundation of Korea (NRF) grant funded by the Korean Government (2011-0011825).
Author details
1Department of Industrial Engineering, Ajou University, San5
Woncheon-dong Yeongtong-gu, Suwon 443-749, South Korea.2Department of Information and Communications Engineering, Sejong University, 98 Gunja-dong Gwangjin-gu, Seoul 143-747, South Korea.
Received: 15 January 2014 Accepted: 14 April 2014 Published: 4 May 2014
References
1. A Medeisis, A Kajackas,On the use of the universal Okumura-Hata propagation prediction model in rural areas, In IEEE 51st Vehicular Technology Conference Proceedings, VTC 2000 Spring(IEEE, Piscataway, 2000)
2. R Mardeni, TS Priya, Optimised COST-231 Hata models for WiMAX path loss prediction in suburban and open urban environments. Mod. Appl. Sci. 4, 9 (2010)
3. H Holma, A Toskala,LTE for UMTS(Wiley, New York, 2011) 4. D Fagen, PA Vicharelli, J Weitzen, Automated wireless coverage
optimization with controlled overlab. IEEE Trans. VT57, 4 (2008)
5. I Siomina, P Varbrand, D Yuan, Automated optimization of service coverage and base station antenna configuration in UMTS networks. IEEE Wireless Commun.13(6), 16–25 (2006)
6. K Jaffres-Runser, J-M Gorce, S Ubeda, QoS-constrained wireless LAN optimization within a multiobjective framework. IEEE Wireless Commun. 13(6), 26–33 (2006)
7. R Whitaker, L Raisanen, S Hurley, The infrastructure efficiency of cellular wireless networks. Comput. Netw.48(6), 941–959 (2005)
8. H Holma, A Toskala,WCDMA for UMTS(Wiley, New York, 2000) 9. H Jiang, CH Davis, Cell-coverage estimation based on duration outage
criterion for CDMA cellular systems. IEEE Trans. VT52, 4 (2003) 10. Lucent Inc,System for Determining Wireless Coverage Using Location
Information for a Wireless Unit. US Patent US6,522,888. B1, 18 Feb 2003 11. VS Abhayawardhana, IJ Wassel, D Crosby, MP Sellars, MG Brown,
Cleaning, inAdvances in Knowledge Discovery and Data Mining, ed. by UM Fayyad, G Piatetsky-Shapiro, P Smyth, R Uthurasamy (MIT Press/AAAI Press, Cambridge, 1996), pp. 181–203
18. CJ Date,An Introduction to Database Systems(Addison-Wesley, Reading, 1990) 19. ML Lee, H Lu, TW Ling, YT Ko, ML Lee, H Lu, TW Ling, YT Ko,Cleansing data for mining and warehousing, In Database and Expert Systems Applications LNIC, vol. 1677 (Springer, Berlin Heidelberg, 1999). pp. 751-760
20. G Welch, G Bishop,An Introduction to the Kalman Filter(University of North Carolina Press, Chapel Hill, 2006)
21. S Pollin, B Adams, A Bahai, Spatial reuse for practical scenarios: iterative power adjustment from distributed contour estimation and propagation, in The International Conference of Communications (ICC)(IEEE, Piscataway, 2008)
doi:10.1186/1687-1499-2014-72
Cite this article as:Kim and Yeo:Cell coverage estimation by radio fingerprint data analytics.EURASIP Journal on Wireless Communications and Networking20142014:72.
Submit your manuscript to a
journal and benefi t from:
7Convenient online submission
7Rigorous peer review
7Immediate publication on acceptance
7Open access: articles freely available online
7High visibility within the fi eld
7Retaining the copyright to your article