ISSN(Online): 2320-9801
ISSN (Print): 2320-9798
I
nternational
J
ournal of
I
nnovative
R
esearch in
C
omputer
and
C
ommunication
E
ngineering
(An ISO 3297: 2007 Certified Organization)
Vol. 3, Issue 6, June 2015
Using Wavelet Features for Analyzing
Gamma Lines
M.E. Medhat
Department of Experimental Nuclear Physics, Nuclear Research Center, Cairo, Egypt
ABSTRACT: Data processing methods for analyzing gamma ray spectra with symmetric bell-shaped peaks form are
considered. In many cases the peak form is symmetrical bell shaped in particular a Gaussian case is the most often used due to many physical reasons. The problem is how t evaluate parameters of such peaks, i.e. their positions, amplitudes and also their half-widths, that is for a single peak and overlapped peaks. Through wavelet features by using Marr wavelet (Mexican Hat) as a correlation method, it could be to estimate the optimal wavelet parameters and to locate peaks in the spectrum. The performance of the proposed method and others shows a better quality of wavelet transform method.
KEYWORDS: Gamma lines, Wavelet transform, Gamma Wavelet Transform Features.
I.INTRODUCTION
Gamma-ray spectroscopy around the middle of the last century focused largely on -rays emitted by radio nuclides
produced in neutron, proton and -induced reactions, using nuclear reactors and particle accelerators.
In parallel with the fast development of High Pure Germanium (HPGe) detectors of high resolution and usage of increased efficiency, the quality of gamma spectral analysis have increased. Of course, the analysis can be done graphically with good results but the need for numerical analysis is still in need especially when there are a large number of peaks to be located in a spectrum, or when many spectra are to be analyzed. This technique would not only provide saving in time but could also lead to even every small peaks could be easily detected [1].
Several methods have been reported for the computer analysis of gamma spectrum such as GAMANAL developed by Gunnink and Niday [2], HYPERMET developed by Philips and Marlow [3], and SAMPO developed by Rouiti and Prussin [4, 5].
The gamma spectrum of a source usually consists of discrete lines of very small width. Ideally a full-energy peak can be represented quite accurately by a one dimension Gaussian function:
(
x
x
)
2f
(
x
)
A
.exp(
) ,
(1)2
2where A is the maximum amplitude, x0 is the centroid, and is the
half-width. In such a doublet of two overlapping peaks can approximated as:
(
x
x
)
2(
x
x
)
2f
(
x
;
A
,
x
1;
B
,
x
2)
A
.exp(
1
)
B
.exp(
2
) ,
(2)2
22
21 2
where x1 , x2 are the center coordinates and 1 ,2 are the half-widths
In the process of registration, a peak is to be discredited as a histogram {hk} on the interval (xbeg , xend ),
1
xkh
k
F (x; A, x
1; B, x
2) dx ,
(3)
xk 1
where xk = xbeg + k, and is the bin width.
ISSN(Online): 2320-9801
ISSN (Print): 2320-9798
I
nternational
J
ournal of
I
nnovative
R
esearch in
C
omputer
and
C
ommunication
E
ngineering
(An ISO 3297: 2007 Certified Organization)
Vol. 3, Issue 6, June 2015
than real peaks. There are many methods of locating peaks in the spectrum, the most important one is the wavelet transformation which we are used it as a correlation method for peak searches. In the present work, we present a new and accurate method for peak location allows detecting all single and multiple peaks. The searching method depends on wavelet transform technique to locate all peaks. A wavelet function is scanned across the spectrum and over the width of the search function, each spectrum count is multiplied by the corresponding value of the search function then any channels in the correlation spectrum which are greater than zero represent channels within a peak.
II.GAUSSIAN WAVELET ALGORITHM
A wavelet transform involves the decomposition of a signal f(x) at different scales and positions. In a WT
treatment, all basis functions are
(
x
)
derived from a mother wavelet
(
x
)
through the following dilation anda ,b translation processes [6]:
(
x
)
a
1 / 2
(
x
b
)
a, b
R, a
0 ,
(4)a,b
a
where a and b are, respectively, the scale and position parameters, with a>0 and b having arbitrary values. The continuous wavelet transform of f (x) is given by:
1
W
(
a
,
b
)
f
(
x
)
f
(
x
) d
x
, (5) a,b
C
where C is the normalization constant [7]. In practical computation, since the spectrum to be analyzed is often
discrete sampling data, the discrete form of Eq. (4) is necessarily used, which can be expressed as:
1
1
N1
x
b
W
(
a
,
b
)
f
(
)
f
(
x
)
(6)
N
a
C
a
k 1
The formula (6) does not contain integral and this fact allows one to apply WT method for analyzing spectrum.
According to the Gaussian-like shape of our signals, it is natural to choose the family of vanishing momentum wavelets, since they are generated by a Gaussian distribution function.
WT method has been incorporated into a computer code which called Gamma Wavelet Transform Model (GWTM). The program performs peak search for single and multiple peaks, fitting peaks, and line shape calibrations. The code has been used with a variety of spectra detected by HPGe detectors
ISSN(Online): 2320-9801
ISSN (Print): 2320-9798
I
nternational
J
ournal of
I
nnovative
R
esearch in
C
omputer
and
C
ommunication
E
ngineering
(An ISO 3297: 2007 Certified Organization)
Vol. 3, Issue 6, June 2015
Figure 1: Wavelet function scans the whole gamma spectrum.
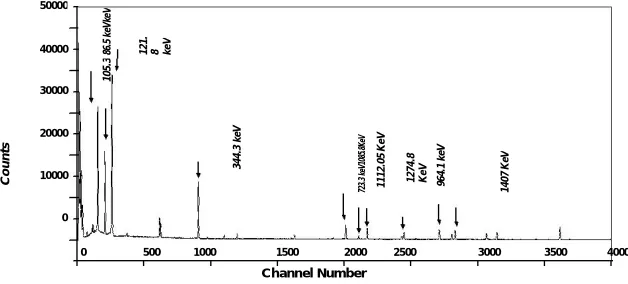
The program starts by reading gamma spectra. The original data from the multichannel analyzer or analyzer build in a computer system are saved in ASCII input data file with 4096 or more rows. After reading input file, GWTM goes to the calibration step. WT function reads the input data file to locate all peaks along the whole spectrum with subtraction from the background. Every point in the wavelet spectrum represents a peak with known centriod. GWTM program produces one output file. It contains the whole analysis of the spectrum. A sample output file is shown in Table 1. The performance of the method and the computer program were tested by analysis of gamma spectra of some radioactive isotopes, which are detected by a vertical HPGe detector surrounded by a lead shield with resolution 2.3 keV at 1332.5 keV. These Spectra are 152,154,155Eu, 133Ba, and 60Co as shown in Figures
2, 3, 4. Comparison between GWTM and a graphical method by PCAIII program is summarized in Tables 2, 3, 4.
50000 86 .5 k eV ke V 1 2 1 .
8 ke
V
40000
105
.3
C o u n ts 30000 3 4 4 .3 k e V 20000 72 3. 3 ke V 10 85 .8 K eV 1 1 1 2 .0 5 K e V 9 6 4 .1 k e V 1 4 0 7 K e V
10000 127
4 .8 K e V 0
0 500 1000 1500 2000
2500
3000 3500 4000
ISSN(Online): 2320-9801
ISSN (Print): 2320-9798
I
nternational
J
ournal of
I
nnovative
R
esearch in
C
omputer
and
C
ommunication
E
ngineering
(An ISO 3297: 2007 Certified Organization)
Vol. 3, Issue 6, June 2015
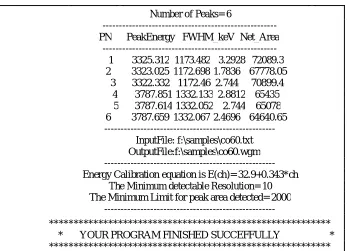
Table 1: A sample run of GWTM code.
Number of Peaks= 6
---PN PeakEnergy FWHM_keV Net_Area
---1 3325.312 1173.482 3.2928 72089.3
2 3323.025 1172.6981.7836 67778.05
3 3322.332 1172.46 2.744 70899.4
4 3787.851 1332.133 2.8812 65435
5 3787.614 1332.052 2.744 65078
6 3787.659 1332.0672.4696 64640.65
---InputFile: f:\samples\co60.txt OutputFile:f:\samples\co60.wgm ---Energy Calibration equation is E(ch)= 32.9+0.343*ch
The Minimum detectable Resolution= 10 The Minimum Limit for peak area detected= 2000
---*********************************************************
* YOUR PROGRAM FINISHED SUCCEFFULLY *
ISSN(Online): 2320-9801
ISSN (Print): 2320-9798
I
nternational
J
ournal of
I
nnovative
R
esearch in
C
omputer
and
C
ommunication
E
ngineering
(An ISO 3297: 2007 Certified Organization)
Vol. 3, Issue 6, June 2015
Table 2: Comparison of GWTM and PCAIII for analysis of 60Co spectrum
Eγ
Centriod Peak Net Area
(channel) 104 (counts)
(keV) GWTM PCAIII Diff(%) GWTM PCAIII Diff(%)
1173.2 3323.65 3323.06 0.0058 7.025 7.108 -8.3
1332.5 3787.54 3787.46 0.0008 6.5051 6.5497 -4.46
Table 3: Comparison of GWTM and PCAIII for analysis of 152,154,155 Eu spectrums
Eγ
Centriod Peak Net Area
(channel) 104 (counts)
(keV) GWTM PCAIII Diff(%) GWTM PCAIII Diff(%)
86.5 158.8 158.7719 0.0008 11.8263 11.7418 8.45
105.3 212.2 212.29 -0.0009 9.538 9.5631 -2.51
121.8 258.84 258.8304 9.5E-05 2.73037 2.8578 -12.74
123.1 265.48 265.4678 0.0002 10.19649 10.3179 -12.14
344.3 911.37 911.345 0.0002 6.9121 6.8396 7.25
723.3 2017.62 2017.37 -5.204 2.10912 2.2373 -12.81
904 2536.2 2535.67 0.0053 0.05782 0.0336 2.42
964.1 2717.1 2716.95 0.0015 1.15682 1.0186 13.82
1004.7 2837.78 2837.71 0.0007 1.484405 1.5064 -2.19
1274.4 3622.32 3622.34 -0.0002 1.41284 1.3757 3.71
1408 4039.64 4039.59 0.0005 1.7513 1.8317 -8.04
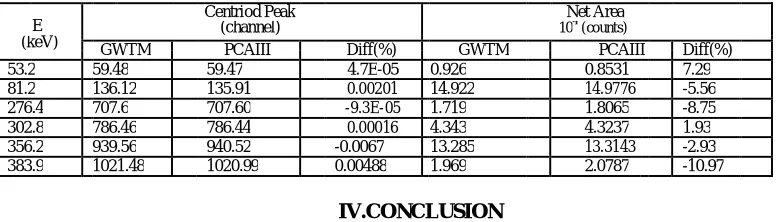
Table 4: Comparison of GWTM and PCAIII for analysis of 133Ba spectrum
Eγ
Centriod Peak Net Area
(channel) 104 (counts)
(keV) GWTM PCAIII Diff(%) GWTM PCAIII Diff(%)
53.2 59.48 59.47 4.7E-05 0.926 0.8531 7.29
81.2 136.12 135.91 0.00201 14.922 14.9776 -5.56
276.4 707.6 707.60 -9.3E-05 1.719 1.8065 -8.75
302.8 786.46 786.44 0.00016 4.343 4.3237 1.93
356.2 939.56 940.52 -0.0067 13.285 13.3143 -2.93
383.9 1021.48 1020.99 0.00488 1.969 2.0787 -10.97
IV.CONCLUSION
To summarize, wavelet transform is used to extract the spectral information efficiently from gamma spectra. In this method, estimation of peak number, peak position and half-widths can be determinate with high efficiency. The method has been incorporated into a general – purpose C++ computer program. The code has been used with different spectra detected by HPGe detector. The performance is evaluated with test cases and by comparing the results of 152,154,155
Eu, 133Ba, and 60Co spectra which shows a good agreement.
REFERENCES
1. P.H.G.M. Hendriks, J. Limburg, and R.J. de Meijer, J. Env. Radio. 53: 365, 1999.
2. R.J. Gunnink and B. Niday, Report UCRL-51061, Vol I-IV, Lawrence Livermore National Laboratory, Livermore, USA, 1972.
3. G. W. Philips, and K. W. Marlow, J. Nucl. Instrum. Methods, 137, 525, 1976.
4. M. J. Koskelo, P. A. Aarnio, and J.T. Routti, J. Nucl. Instrum. Methods, 190, 89, 1981.
5. P. A. Aarnio, J.T. Routti, and J.V. Sandberg, J. Radioanal. Nucl Chem., 124, 457, 1988.
6. I. Daubechies Ed., Ten Lectures on Wavelets, SIAM Press, Philadelphia, 1992.