ISSN: 2252-8938 89
A New DG Allocation Approach Based on Biogeography-Based
Optimization with Considering Fuzzy Load Uncertainty
Mohammad Sedaghat, Esmaeel Rokrok, Mohammad Bakhshipour Department of Electrical Engineering, Lorestan University, Daneshgah Street, 71234-98653,
Khorramabad, Lorestan, Iran.
Article Info ABSTRACT
Article history: Received May 23, 2015 Revised July 13, 2015 Accepted August 2, 2015
A new distributed generation placement method based on biogeography-based optimization (BBO) is investigated in this paper. A significant novelty of this study lies in considering fuzzy load uncertainty. For this purpose a fuzzy backward- forward sweep load flow is proposed. The main objectives of this study is minimizing power losses and improving voltage profile. A comparative study between optimal location and sizing under typical load condition and fuzzy load uncertainty is presented. To verify the efficiency of proposed BBO method, it is conducted on IEEE 33 bus distribution system, also a comparative study between proposed BBO approach and particle swarm optimization (PSO), Technical-learning based optimization (TLBO), Artificial bee colony (ABC), Imperialist competitive algorithm (ICA) is investigated. The simulation results show the excellent and superior performance of proposed BBO approach in comparison with the other intelligent methods.
Keyword:
Biogeography-based optimization (BBO) Distributed generation Fuzzy load uncertainty Power loss reduction Voltage profile
Copyright © 2015 Institute of Advanced Engineering and Science. All rights reserved.
Corresponding Author: Mohammad Sedaghat,
Department of Electrical Engineering Lorestan University
Daneshgah Street, 71234-98653, Khorramabad, Lorestan, Iran. Email: [email protected]
1. INTRODUCTION
Nowadays the nature of distribution networks is changing from passive to active by installation of small power sources called distributed generations (DGs). The penetration level of these non-conventional units is increasing and it is expected that this growth will continue along with customer’s demand. Therefore it is obvious that their integration creates remarkable technical and economical challenges for the Distribution Network Operators (DNOs) or developers and industries [1]. A properly planned DG, can be beneficial to the distribution system and will have positive economical and technical impacts. The economical advantages are deferral of network replacement [2], reduction the cost of both network and DG [3] and energy price [4]. Technical advantages include various indices such as active and reactive power loss reduction [5], reliability improvement [6,7], improvement in the network voltage stability [8] and security [9]. From grid planning perspective, several researchers have developed interesting approaches for optimal DG planning due for a defined objective function. In [10], a fast analytical method for DG sizing and allocation for loss reduction in primary distribution systems is presented. The authors in [11] studied a fuzzy logic-based method to determine the optimum DG units locations by considering technical parameters such as power losses, voltage level and cable loading. Ref [12] presented a combined GA and PSO method to solve optimal DG location and sizing in distribution networks. Although most of the above mentioned approaches are generally able to also result in minimum overall energy and power losses, the problem of minimizing losses has been investigated using a single demand level.
In [13], the practice of minimizing power losses by examining only a single load demand condition is unlikely to lead to an overall optimal energy loss especially when a renewable generation could be connected to distribution networks. Therefore, a multi-period AC power flow technique is used to cater for variability of demand and generation in DG planning and optimization [14]. Also in recent years, applying probabilistic (or stochastic) power flow analysis is widely used to consider the uncertainties associated to the distribution network loads [15,16]. A methodology to evaluate dispersed photovoltaic (PV) impact on loss reduction using probabilistic power flow in a distribution line is studied in [17], also it has shown that by considering both stochastic generation and loading conditions, uniform DG sitting would have the highest impact on power loss reduction in a distribution line.
Authors in [18–21] have shown that from the concept of multiple objective approaches, load models can significantly affect the optimal location and sizing of DGs in distribution systems. In one of the new researches, El-Zonkoly proposed a multi-objective index-based DG size-location optimization problem including different load models using particle swarm optimization (PSO) technique. Also it has shown that by placement of a DG at most of the system buses the value of the short circuit level increased and in the case of the industrial load model, the maximum increase is experienced [22].
In [23], a methodology is proposed to study the effect of load models on the evaluation of energy losses based on time series simulations to take into account both the variations of renewable generation and load demand. However the authors considered the detailed load model such as demand profile and demand type, by considering a single wind power as a renewable DG, only the impact of load models on energy losses is investigated. In these studies, however loads have been modeled as voltage dependent for residential, industrial and commercial load types, the demand has been considered as a single load level, without differences in the pattern of each type.
This paper presents a novel DG planning approach based on biogeography-based optimization (BBO) algorithm in order to loss reduction and voltage profile improvement in the distribution network. For considering uncertainty and stochastic nature of loads, a fuzzy representation of loads is presented in this study. The proposed method is applied to IEEE-33 test system and the obtained simulation results verified the proper performance of presented approach. All the simulations are carried out on Matlab environment.
2. PROBLEM FORMULATION
2.1. Objective Function
In this paper, the objective functions are minimizing power losses and improving voltage profile by means of optimizing the following equation:
[( 1 ) ( 2 )]
Objective FunctionMin W PLoss W VI (1)
Where, PLoss is power losses which is evaluated as below:
1 1
[ ( ) ( )]
b b
N N
Loss ij i j i j ij i j j i
P
a P P Q Q b Q P Q P (2)Where
cos( )
ij
ij i j
i j R a
V V
, ij sin( )
ij i j
i j
X b
V V
ij ij ij
Z R jX are the network impedance matrix components and Nb is the number of distribution
network buses [24].
Also the in equation (1), improving voltage profile is obtained by minimizing the index (VI) which defines as follows [25]:
1
1
(
)
N
i tg
tg i
V
V
VI
N
V
(3)In equation (3), Vtg is Vtarget which defines as 1pu. N is total the number of buses and Vi is the
voltage at bus i. Improving voltage profile could be provided by closing the index (VI) to zero, so it should be minimized.
W1 and W2 are the weights of objectives and given the same values as 0.5.
2.2. Constrains
The optimization process of DG allocation includes some technical constrains as follows: 1. The Limitation of Voltage:
min i max
V
V
V
(4)Where
V
min andV
max indicate the minimum and maximum permissible voltage (±5%) andV
i is the voltage at bus i.2. The power balance constraint:
/
1 1
g DG
N N
gw DG d d L
g d
Pg
Pg
P
P
(5)Where Ng and NDG are the whole number of traditional generation unit and whole number of DGs, Pggw/DG is
the value of active power of traditional power generation unit g with introducing of DG, Pgd is the amount of
active power of DG unit d, Pd is the whole load demand and PL is the whole loss of active power.
3. Active and reactive power constraint:
2 2 2 ,
gi gi gi max
P
Q
S
(6)Where Qgi and Sgi,max depicts the amounts of reactive and apparent power of the ith DG [26].
2.3. Fuzzy Load Flow
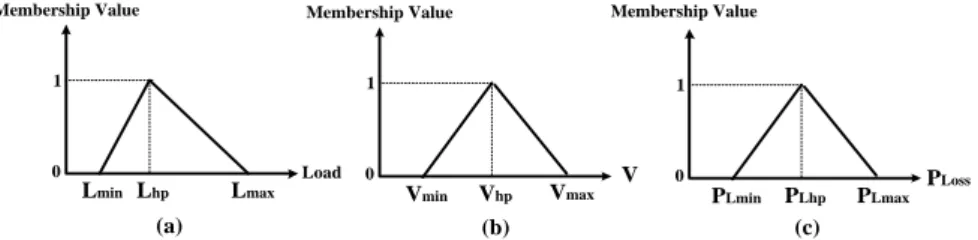
At any time, load can be shown as a fuzzy number. For example, load at time ti can be represented as a triangular fuzzy number (TFN) as depicted in Figure 1a. in this fuzzy load representation, Lhp is the load with highest membership values or load with highest possibility of occurrence and Lmin, Lmax are the lower and upper limits of load, respectively.
Other shapes for fuzzy numbers based on operator insight or gathered information can also be utilized. For consideration of uncertainty in load, a backward–forward sweep load flow method with fuzzy load is used [27].
Due to fuzzy modelling of loads, variables are treated as TFNs with real and/or imaginary parameters; mathematical operators applied in the fuzzy domain and load flow results are obtained in the fuzzy domain. In Figure 1b, voltage at node k is presented as TFN in which Vhp is the voltage with highest membership value and Vmin, Vmax are the lower and upper limits of voltage, respectively.
For a given condition in the distribution network, by running the fuzzy load flow, the result of power flow through the line segments and substations give also fuzzy numbers. Therefore active and reactive power losses obtain fuzzy numbers. as shown in Figure. 1c, where PLhp is the active power loss with highest
membership value and PLmin , PLmax are the lower and upper limits of power losses, respectively. Same
concept is used for the expression of reactive power losses and voltages at different nodes.
Membership Value
1
0
Lmin Lhp Lmax
Load
Membership Value
1
0
Vmin Vhp Vmax V
1
0
PLmin PLhp PLmax PLoss
Membership Value
(a) (b) (c)
Figure 1. Fuzzy Load Modelling – Triangular Membership for Power Load (a) – Voltage Constraint in Fuzzy Domain (b) – Active Power Loss Constraint in Fuzzy Domain (c)
3. BIOGEOGRAPHY THEORY
Biogeography Based Optimization (BBO) approach which is based on biogeography theory, has been proposed in 2008 by Dan Simon [28]. The procedure of BBO is an example of natural process that can be utilized to solve general problems of optimization. In BBO, each individual is assumed as an island (or a habitat), and the features subscription thorough individuals are depicted as emigration and immigration (figure 2). Each solution property is named a suitability index variable (SIV). Geographical regions that are appropriated as residences for biological types are said to have a high habitat suitability index (HSI). The meaning of a high HSI of a habitats is proper performance on the optimization problem whereas a low HSI shows improper performance on the optimization problem. Intelligent algorithms solve the optimization problem using Intensification the population. In BBO generating next generation performed by immigrating solution properties to the other islands, and giving solution properties by emigration from the other islands. Then mutation is done for all the population. This mutation procedure is similar to GA algorithm's mutation.
Figure 2. Emmigration and Immigration of Species and New Island
In BBO, each individual has its own immigration rate, depicted by λ, and emigration rate, depicted by μ. A proper solution has higher μ; Therefor, it has a very high probability of borrowing properties from other solutions, helping it to improve for the next generation illustrated in Figure 3.
Figure 3. Species Model of a Single Habitat
3.1. Proposed method steps
This study proposed a new approach based on BBO algorithm which is investigated to determine the optimal location and capacity of Distributed generation units which is applied to improve voltage profile as the main factor for power quality improvement and reduce power losses of the distribution network. Also in this investigation, the fuzzy load uncertainty is considered to make the investigation more practical. Due to triangular membership function selection for loads, all the output details from power flow and optimization process including voltage at different nodes and power losses have three values as lower and upper limits and highest membership value of apparent variables. The proposed algorithm steps are performed as follow: 1. Step 1:Enter the network's load data and run fuzzy power flow to evaluate voltage ate different nodes
and power losses.
2. Step 2: Define penalty functions in order to prevent violating constrains.
3. Step 3:Initialize the BBO parameters including maximum species count, maximum migration rates, and maximum mutation rate and an elitism parameter.
4. Step 4: Initialize habitats depending upon habitat size within feasible region. Set the iteration counter m= 0.
6. Step 6: Checking network constrains. If the solutions violate the constrains, then apply the penalty, otherwise go to next step.
7. Step 7: Add the counter by 1. Check whether it is less than the maximum iteration limit. If no, print the output results.
8. Step 8: If yes, calculate the HSI value for the given μ & λ and Select the optimum HSI value based on elitism parameters.
9. Step 9: Modify each non-elite habitat using immigration & emigration rate. 10. Step 10: Check for conceivability. If yes, HSI is computed.
11. Step 11: Species count probability is updated and recalculated the HSI.
12. Step 12: Go to step 7 for the next iteration. This procedure can be finished after a conceivable problem solution has been found.
The following BBO parameters have been used, population size=50, Habitat Modification Probability=1, Immigration Probability bounds per gene= [0, 1], elitism parameter = 4, step size for numerical integration of probabilities=1, maximum λ and μ rates for each island=1 and Mutation Probability=0.05
Initialize BBO parameters
DG Installation and Fuzzy Load Flow
Evaluation Read power flow
system Data Start
Network Constraints FunctionPenalty
Location and Size Constraints
Randomly generate SIVs for each Habitat & Set m=0
Check the Maximum Iteration Limit m ≤ Iteration (max)
Calculate HSI
Applying Immigration and Emigration for non-elite solutions Update species count probability and recalculate HSI
m = m +1
×
×
Yes
No Yes
No
Yes No
Optimum is reached. Show the size and location of DGs and also Fuzzy voltage profile and Losses
Figure 4. Flowchart of Proposed BBO Approch
4. SIMULATION RESULTS
In order to investigate the performance of the proposed approach, the IEEE 33-bus radial distribution test system is utilized in this section. Figure 5 shows the single line diagram of the test system. The total amounts of the active and reactive loads of the system are 3.715 MW and 2.3 MVAr, respectively. In addition, as mentioned in [29], the initial amount of the active and reactive power losses before DG allocation are 210.84 kW and 143.114 kVAr, respectively. Load is assumed as a triangular fuzzy number as shown in Figure 1(a) in section 2.3. Minimum load and maximum load on buses are 90 and 110%, respectively, of load with highest membership value. Loads with highest membership values on various buses are shown in appendix (table 4).
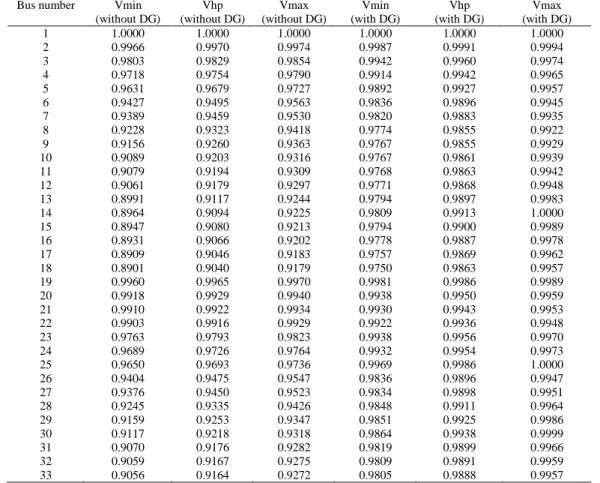
Optimal DG placement and sizing with considering load uncertainty is investigated. fuzzy load flow is applied in order to load uncertainty consideration. Table 1 hows the node voltages results of initial fuzzy load flow and DG placement under fuzzy uncertainty. It should be noted that because of fuzzy load flow consideration, all the voltages at different nodes and power losses take three values and that is due to the triangular fuzzy membership function as mentioned in section 2.3. These three values include lower and upper limits depicted by min and max indices respectively and also highest membership (hp) value.
Table 1. Results of Bus Voltages in Fuzzy Load Flow, before and after DG Placement using BBO Method
Bus number Vmin (without DG) Vhp (without DG) Vmax (without DG) Vmin (with DG) Vhp (with DG) Vmax (with DG) 1 1.0000 1.0000 1.0000 1.0000 1.0000 1.0000 2 0.9966 0.9970 0.9974 0.9987 0.9991 0.9994 3 4 5 6 7 8 9 10 11 12 13 14 15 16 17 18 19 20 21 22 23 24 25 26 27 28 29 30 31 32 33 0.9803 0.9718 0.9631 0.9427 0.9389 0.9228 0.9156 0.9089 0.9079 0.9061 0.8991 0.8964 0.8947 0.8931 0.8909 0.8901 0.9960 0.9918 0.9910 0.9903 0.9763 0.9689 0.9650 0.9404 0.9376 0.9245 0.9159 0.9117 0.9070 0.9059 0.9056 0.9829 0.9754 0.9679 0.9495 0.9459 0.9323 0.9260 0.9203 0.9194 0.9179 0.9117 0.9094 0.9080 0.9066 0.9046 0.9040 0.9965 0.9929 0.9922 0.9916 0.9793 0.9726 0.9693 0.9475 0.9450 0.9335 0.9253 0.9218 0.9176 0.9167 0.9164 0.9854 0.9790 0.9727 0.9563 0.9530 0.9418 0.9363 0.9316 0.9309 0.9297 0.9244 0.9225 0.9213 0.9202 0.9183 0.9179 0.9970 0.9940 0.9934 0.9929 0.9823 0.9764 0.9736 0.9547 0.9523 0.9426 0.9347 0.9318 0.9282 0.9275 0.9272 0.9942 0.9914 0.9892 0.9836 0.9820 0.9774 0.9767 0.9767 0.9768 0.9771 0.9794 0.9809 0.9794 0.9778 0.9757 0.9750 0.9981 0.9938 0.9930 0.9922 0.9938 0.9932 0.9969 0.9836 0.9834 0.9848 0.9851 0.9864 0.9819 0.9809 0.9805 0.9960 0.9942 0.9927 0.9896 0.9883 0.9855 0.9855 0.9861 0.9863 0.9868 0.9897 0.9913 0.9900 0.9887 0.9869 0.9863 0.9986 0.9950 0.9943 0.9936 0.9956 0.9954 0.9986 0.9896 0.9898 0.9911 0.9925 0.9938 0.9899 0.9891 0.9888 0.9974 0.9965 0.9957 0.9945 0.9935 0.9922 0.9929 0.9939 0.9942 0.9948 0.9983 1.0000 0.9989 0.9978 0.9962 0.9957 0.9989 0.9959 0.9953 0.9948 0.9970 0.9973 1.0000 0.9947 0.9951 0.9964 0.9986 0.9999 0.9966 0.9959 0.9957
By comparing the voltage values in Table 1. Before and after DG placement, a significant improvement in bus voltages is concluded after optimal DG allocation.
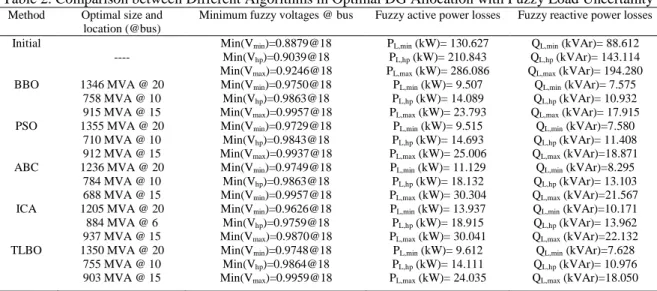
The optimization process is performed by using BBO algorithm and obtained simulation results are compared with PSO, ABC, ICA and TLBO algorithms. All the optimization methods are implemented on IEEE-33 bus test system considering fuzzy uncertainty. Table 2 shows the optimal location and sizes of three DGs, minimum voltages and active and reactive power losses before and after optimization process. As mentioned before, voltages and losses are depicted as fuzzy values. It should be noticed that the three allocated DGs have the capability of injecting both active and reactive powers and their maximum capacity is 1.5 MVA.
By looking at Table 2 and comparing the results of optimal DG allocation by different methods, it is clearly concluded that BBO approach resulted more reduction in active and reacative power losses and also the value of minimum voltages in three fuzzy levels of this approach have the best results among the other methods. This proper results is due to selection the optimum location for DGs and the best usage of DGs' capacities that performed by BBO approach. It should be noted that the population size 50 and the maximum number of iteration 120, are considered during the optimization process for all the methods.The details of optimal sizes selection of DGs obtained by BBO method are depicted in Table 3. Loads with highest membership in Table 4.
Table 2. Comparison between Different Algorithms in Optimal DG Allocation with Fuzzy Load Uncertainty
Method Optimal size and location (@bus)
Minimum fuzzy voltages @ bus Fuzzy active power losses Fuzzy reactive power losses
Initial
----
Min(Vmin)=0.8879@18
Min(Vhp)=0.9039@18
Min(Vmax)=0.9246@18
PL,min (kW)= 130.627
PL,hp (kW)= 210.843
PL,max (kW)= 286.086
QL,min (kVAr)= 88.612
QL,hp (kVAr)= 143.114
QL,max (kVAr)= 194.280
BBO 1346 MVA @ 20 758 MVA @ 10 915 MVA @ 15
Min(Vmin)=0.9750@18
Min(Vhp)=0.9863@18
Min(Vmax)=0.9957@18
PL,min (kW)= 9.507
PL,hp (kW)= 14.089
PL,max (kW)= 23.793
QL,min (kVAr)= 7.575
QL,hp (kVAr)= 10.932
QL,max (kVAr)= 17.915
PSO 1355 MVA @ 20 710 MVA @ 10 912 MVA @ 15
Min(Vmin)=0.9729@18
Min(Vhp)=0.9843@18
Min(Vmax)=0.9937@18
PL,min (kW)= 9.515
PL,hp (kW)= 14.693
PL,max (kW)= 25.006
QL,min (kVAr)=7.580
QL,hp (kVAr)= 11.408
QL,max (kVAr)=18.871
ABC 1236 MVA @ 20 784 MVA @ 10 688 MVA @ 15
Min(Vmin)=0.9749@18
Min(Vhp)=0.9863@18
Min(Vmin)=0.9957@18
PL,min (kW)= 11.129
PL,hp (kW)= 18.132
PL,max (kW)= 30.304
QL,min (kVAr)=8.295
QL,hp (kVAr)= 13.103
QL,max (kVAr)=21.567
ICA 1205 MVA @ 20 884 MVA @ 6 937 MVA @ 15
Min(Vmin)=0.9626@18
Min(Vhp)=0.9759@18
Min(Vmax)=0.9870@18
PL,min (kW)= 13.937
PL,hp (kW)= 18.915
PL,max (kW)= 30.041
QL,min (kVAr)=10.171
QL,hp (kVAr)= 13.962
QL,max (kVAr)=22.132
TLBO 1350 MVA @ 20 755 MVA @ 10 903 MVA @ 15
Min(Vmin)=0.9748@18
Min(Vhp)=0.9864@18
Min(Vmax)=0.9959@18
PL,min (kW)= 9.612
PL,hp (kW)= 14.111
PL,max (kW)= 24.035
QL,min (kVAr)=7.628
QL,hp (kVAr)= 10.976
QL,max (kVAr)=18.050
Table 3. Optimum Sizes and Locations of Allocated DGs using BBO Approach
DG location PDG (kW) QDG (kVAr)
10 697.6 298.3 15 20 828.7 953.4 391.4 951.7
Table 4. Loads with Highest Membership Values on Buses
Bus number P (kW) Q (kVAr) Bus number P (kW) Q (kVAr) 2 100.00 60.00 18 90.00 40.00 3 4 5 6 7 8 9 10 11 12 13 14 15 16 17 90.00 120.00 60.00 60.00 200.00 200.00 60.00 60.00 45.00 60.00 60.00 120.00 60.00 60.00 60.00 40.00 80.00 30.00 20.00 100.00 100.00 20.00 20.00 30.00 35.00 35.00 80.00 10.00 20.00 20.00 19 20 21 22 23 24 25 26 27 28 29 30 31 32 33 90.00 90.00 90.00 90.00 90.00 420.00 420.00 60.00 60.00 60.00 120.00 200.00 150.00 210.00 60.00 40.00 40.00 40.00 40.00 50.00 200.00 200.00 25.00 25.00 20.00 70.00 600.00 70.00 100.00 40.00 5. CONCLUSION
In this study a novel DG allocation approach based on biogeography-based optimization (BBO) algorithm in order to power loss reduction and voltage profile improvement in the distribution network is proposed. Uncertainty and stochastic nature of loads is considered as fuzzy representation of loads in this paper. To show the effectiveness of presented approach, the proposed method is applied to IEEE-33 test system and the obtained simulation results based on DG allocation under fuzzy load uncertainty are compared with some of well known optimization methods including particle swarm optimization (PSO), Technical-learning based optimization (TLBO), Artificial bee colony (ABC), Imperialist competitive algorithm (ICA). The comparison results verified the better performance of presented BBO approach among the introduced optimization methods. All the simulations are implemented on Matlab environment.
REFERENCES
[1] Ochoa LF, Dent CJ, Harrison GP. Distribution network capacity assessment: variable DG and active networks.
IEEE Trans Power Syst 2010; 25(1):87–95.
[2] Me´ndez VH, Rivier J, de la Fuente JI, Go´mez T, Arceluz J, Marı´n J, et al. Impact of distributed generation on distribution investment deferral. Int J Electr Power Energy Syst 2006; 28(4):244–52.
[3] Falaghi H, Singh C, Haghifam MR, Ramezani M. DG integrated multistage distribution system expansion planning. Int J Electr Power Energy Syst 2011; 33(8):1489–97.
[4] Khattam WE, Hegazy YH, Salama M. An integrated distributed generation optimization model for distribution system planning. IEEE Trans Power Syst 2005; 20(2):1158–65.
[5] Khalesi N, Rezaei N, Haghifam MR. DG allocation with application of dynamic programming for loss reduction and reliability improvement. Int J Electr Power Energy Syst 2011; 33(2):288–95.
[6] Banerjee B, Islam SM. Reliability based optimum location of distributed generation. Int J Electr Power Energy Syst
2011; 33(8):1470–8.
[7] Teng JH, Liu YH, Chen CY, Chen CF. Value-based distributed generator placements for service quality improvements. Int J Electr Power Energy Syst. 2007; 29(3):268–74.
[8] El-Khattam W, Bhattacharya K, Hegazy YH, Salama M. Optimal investment planning for distributed generation in a competitive electricity market. IEEE Trans Power Syst 2004; 19(3):1674–84.
[9] Popovic DH, Greatbanks JA, Begovic M, Pregelj A. Placement of distributed generators and reclosers for distribution network security and reliability. Int J Electr Power Energy Syst. 2005; 27(5–6):398–408.
[10] Acharya N, Mahat P, Mithulananthan N. An analytical approach for DG allocation in primary distribution network.
Int J Electr Power Energy Syst 2006; 28(10):669–78.
[11] Barin A, Pozzatti LF, Canha LN, Machado RQ, Abaide AR, Arend G. Multiobjective analysis of impacts of distributed generation placement on the operational characteristics of networks for distribution system planning. Int J Electr Power Energy Syst. 2010; 32(10):1157–64.
[12] Moradi MH, Abedini M. A combination of genetic algorithm and particle swarm optimization for optimal DG location and sizing in distribution systems. Int J Electr Power Energy Syst 2012; 34(1):66–74.
[13] Ochoa LF, Harrison GP. Minimizing energy losses: optimal accommodation and smart operation of renewable distributed generation. IEEE Trans Power Syst 2011; 26(1):198–205.
[14] Rotaru F, Chicco G, Grigoras G, Cartina G. Two-stage distributed generation optimal sizing with clustering-based node selection. Int J Electr Power Energy Syst. 2012; 40(1):120–9.
[15] Stefopoulos GK, Meliopoulos AP, Cokkinides GJ. Probabilistic power flow with non-conforming electric loads. Int J Electr Power Energy Syst 2005; 27(9– 10):627–34.
[16] Li X, Li Y, Zhang S. Analysis of probabilistic optimal power flow taking account of the variation of load power.
IEEE Trans Power Syst 2008; 23(3):992–9.
[17] Marinopoulos AG, Alexiadis MC, Dokopoulos PS. Energy losses in a distribution line with distributed generation based on stochastic power flow. Electr Power Syst Res 2011; 81(10):1986–94.
[18] Singh D, Singh D, Verma KS. Multiobjective optimization for DG planning with load models. IEEE Trans Power Syst 2009; 24(1):427–36.
[19] Singh D, Mishra RK, Singh D. Effect of load models on distributed generation planning. IEEE Trans Power Syst
2007; 22(4):2204–12.
[20] Vinothkumar K, Selvan MP, Srinath S. Impact of DG model and load model on placement of multiple DGs in distribution system. In: Proc 5th international conference on industrial and information systems, ICIIS, 29 July_1 August 2010: 508–13.
[21] Amany M, Zonkoly E. Optimal placement of multi DG units including different load models using PSO. Smart Grid Renew Energy 2010; 1(3):160–71.
[22] Zonkoly E. Optimal placement of multi-distributed generation units including different load models using particle swarm optimisation. IET Gener Transm Distrib 2011; 5(7):760–71.
[23] Qian K, Zhou C, Allan M, Yuan Y. Effect of load models on assessment of energy losses in distributed generation planning. Int J Electr Power Energy Syst 2011; 33(6):1243–50.
[24] Kothari DP, Dhillon JS. Power system optimization. New Delhi: Prentice-Hall; 2006: 180–185.
[25] Moravej, Zahra, Amir Akhlaghi. A novel approach based on cuckoo search for DG allocation in distribution network. International Journal of Electrical Power & Energy Systems 44.1 (2013): 672-679.
[26] Sedaghat, Mohammad, Esmaeel Rokrok, Mohammad Bakhshipour. A Novel Method Based on Biogeography-Based Optimization for DG Planning in Distribution System. TELKOMNIKA Indonesian Journal of Electrical Engineering 2015; 15(1):1-13.
[27] Haghifam, MR, Malik, OP. Genetic algorithm-based approach for fixed and switchable capacitors placement in distribution systems with uncertainty and time varying loads. IET Proc., Gener. Trans. Distrib. 2007; 1(2): 244– 252.
[28] Simon D. Biogeography-based optimization. IEEE Trans Evolut Comput 2008; 12(6):702–13.
[29] Baran ME, Wu FF. Optimal sizing of capacitor placed on radial distribution systems. IEEE Trans Power Deliv