Volume 1, Issue 1 March 2012
Network Intrusion detection by using Feature
Reduction Technique
Fiona Lowden Lawrence, Sanjay Kumar Sharma
Abstract
As network attacks have increased in number and severity over the past few years, intrusion detection system (IDS) is increasingly becoming a critical component to secure the network. Due to large volumes of security audit data as well as complex and dynamic properties of intrusion behaviors, optimizing performance of IDS becomes an important open problem that is receiving more and more attention from the research community. Intrusion poses a serious security risk in a network environment. The ever growing new intrusion types pose a serious problem for their detection. In this paper, a new intrusion detection method based on Principle Component Analysis (PCA) and Random Forest with low overhead and high efficiency is presented. System call data and command sequences data are used as information sources to validate the proposed method. The frequencies of individual system calls in a trace and individual commands in a data block are computed and then data column vectors which represent the traces and blocks of the data are formed as data input. PCA is applied to reduce the high dimensional data vectors and distance between a vector and its projection onto the subspace reduced is used for anomaly detection. Experimental results show that the proposed method is promising in terms of detection accuracy, computational expense and implementation for real-time intrusion detection.
Keywords: Network Intrusion Detection, Principal Component Analysis (PCA), Random Forest (RF), Detection Rate and False Positive Rates.
I. INTRODUCTION
With the tremendous growth of network-based services and sensitive information on networks, network security is becoming more and more importance than ever before. Intrusion detection techniques are the last line of defenses against computer attacks behind secure network architecture design, firewalls, and personal screening. Despite the plethora of intrusion prevention techniques available, attacks against computer systems are still successful. Thus, intrusion detection systems (IDSs) play a vital role in
network security. Symantec in a recent report[1] uncovered that the number of fishing attacks targeted at stealing confidential information such as credit card numbers, passwords, and other financial information are on the rise, going from 9 million attacks in June2004 to over 33 millions in less than a year.
One solution to this is the use of network intrusion detection systems (NIDS), which detect attacks by observing various network activities. It is therefore crucial that such systems are accurate in identifying attacks, quick to train and generate as few false positives as possible. This paper presents the scope and status of our research in anomaly detection. This paper gives a comparative study of Principle Component Analysis (PCA) & Random Forest (RF) technique for identifying novel network intrusion detections. We present experimental results on KDDCup’99 data set. Experimental results have demonstrated that our method is much more efficient in the detection of network intrusions. Section 2 describes IDS in general. Section 3 presents an overview of frequently occurring network attacks, and section 4 discusses related research done so far. Section 5 describes our proposed method and section 6 presents the experimental results. Finally, section 7 provides the concluding remarks and future scope of the work.
II. INTRUSIONDETECTION
Volume 1, Issue 1 March 2012
for known attacks, so it is only as good as the database of attack signatures that it uses for comparison. Misuse detection has low false positive rate, but cannot detect novel attacks. However, anomaly detection can detect unknown attacks, but has high false positive rate.
Many types of data can be used for anomaly detection, such as Unix commands, audit events, keystroke, system calls, and network packages, etc. Early studies [2, 3] on anomaly detection mainly focus on learning normal system or user behaviors from monitored system log or accounting log data. Examples of the information derived from these logs are: CPU usage, time of login, duration of user session, names of files accessed, etc. In recent years, many research in anomaly detection focus on learning normal program behavior. In 1996, Forrest et al. introduced a simple anomaly detection method based on monitoring the system calls issued by active, privileged processes [4]. This work was extended by various methods. Lee et al. used data mining approach to study a sample of system call data to characterize sequences occurring in normal data by a small set of rules [5]. Warrender et al. proposed Hidden Markov Model (HMM) method for modeling and evaluating invisible events based on system calls [6].
In practice, a protected computer system could produce massive data streams, for example, during the experiments of capturing the system calls on the sendmail, only 112 messages produced a combined trace length of over 1.5 million system calls [4].
Therefore, processing the high dimensional audit data in real time for online intrusion detection would be computationally expensive.
\Principle Component Analysis (PCA, also called =0Karhunen-Loeve transform) is one of the most wildly used dimension reduction techniques for data analysis and compression in practice. In this paper, we discuss a novel intrusion detection method based on PCA, by which intrusion detection can be employed in a lower dimensional subspace and the computational complexity can be significantly reduced. Two types of data are used to verify the proposed method and the testing results show that the method is efficient and effective.
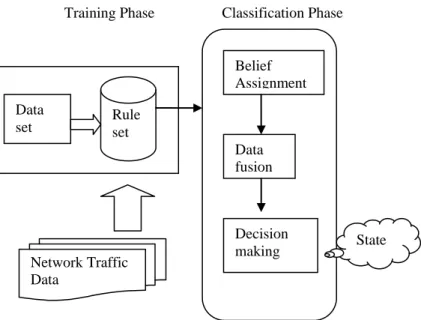
Training Phase Classification Phase
Fig. 1 Intrusion detection identification
III. NETWORKINGATTACKS
The simulated attacks were classified, according to the actions and goals of the attacker. Each attack type falls into one of the following four main categories [3]:
Denials-of Service (DoS) attacks have the goal of limiting or denying services provided to the user, computer or network. A common tactic is to severely overload the targeted system. (e.g. apache, smurf, Neptune, Ping of death, back, mailbomb, udpstorm, SYNflood, etc.).
Probing or Surveillance attacks have the goal of gaining knowledge of the existence or configuration of a computer system or network. Port Scans or sweeping of a given IP-address range typically fall in this category. (e.g. saint, portsweep, mscan, nmap, etc.).
User-to-Root (U2R) attacks have the goal of gaining root or super-user access on a particular computer or system on which the attacker previously had user level access. These are attempts by a non-privileged user to gain administrative privileges (e.g. Perl, xterm, etc.).
Remote-to-Local(R2L) attack is an attack in which a user sends packets to a machine over the internet, which the user does not have access to in order to expose the machine vulnerabilities and exploit privileges which a local user would have on the computer (e.g. xclock, dictionary, guest_password, phf, sendmail, xsnoop, etc.).
IV. RELATEDWORK
The problem of huge network traffic data size and the invisibility of intrusive patterns which normally are hidden among the irrelevant and redundant features have posed a great challenge in the domain of intrusion detection [8]. One way to address this issue is to reduce these input features in order to disclose the hidden significant features. Thus, an accurate classification can be achieved. Besides identifying significant features that can represent intrusive patterns, the choice of classifier can also influence the accuracy and classification of an attack. The literature suggests that hybrid or assembling multiple classifiers can improve the accuracy of detection [7] [9]. According to Chebrolu et al. [9], an important advantage for combining redundant and complementary classifiers is to increase robustness, accuracy and better overall generalization. Mukkamala et al. [10] demonstrated the use of ensemble classifiers gave the best accuracy for each category of attack patterns. Ensemble methods aim at improving the predictive performance of a given statistical learning or model fitting technique. The general principle of ensemble methods is to construct a linear combination of some model fitting method, instead of using a single fit of the method. In designing a classifier, the first step is to carefully construct different connectional models to achieve best generalization performance for classifiers. Chebrolu et al. [9] proposed CART-BN approach, where CART performed best for Normal, Probe
and U2R and the ensemble approach worked best for R2L
and DoS.
Meanwhile, Abraham et al. [11] illustrated that ensemble Decision Tree was suitable for Normal, LGP for Probe, DoS
and R2L and Fuzzy classifier was for R2L. Abraham et al. [12] also demonstrated the ability of their proposed ensemble structure in modeling lightweight distributed IDS. Meanwhile, Mukkamala et al. [7] proposed three variants of Data
set Rule set
State Belief
Assignment
Decision making Data fusion
Volume 1, Issue 1 March 2012
Neural Networks, SVMand MARS as components in their IDS. This combining approach has demonstrated better performance when compared to single classifier approach. Here, we have chosen three soft computing techniques to develop our classifiers and they are: Linear Genetic Programming, Adaptive Neural Fuzzy Inference and Random Forest.
V. THE PROPOSED INTRUSION DETECTION METHOD
BASED ON PCA&RANDOM FOREST
5.1 Principal Component Analysis
PCA is a useful statistical technique that has found application in fields such as face recognition and image compression, and is a common technique for finding patterns in data of high dimension. The entire subject of statistics is based on around the idea that you have this big set of data, and you want to analyze that set terms of the relationships between the individual points in that set [21]. The goal of PCA is to reduce the dimensionality of the data while retaining as much as possible of the variation present in the original dataset. It is a way of identifying patterns in data, and expressing the data in such a way as to highlight their similarities and differences [22].
5.2 Random Forest
The random forests [14] are an ensemble of unpruned classification or regression trees. In general, random forest generates many classification trees and a tree classification algorithm is used to construct a tree with different bootstrap sample from original data using a tree classification algorithm. After the forest is formed, a new object that needs to be classified is put down each of the tree in the forest for classification. Each tree gives a vote about the class of the object. The forest chooses the class with the most votes [15].By injecting randomness at each node of the grown tree, it has improved accuracy.
RF algorithm is given below [16]:
1. Build bootstrapped sample Bi from the original dataset D, where |Bi| = |D| and examples are chosen at random with replacement from D.
2. Construct a tree τi, using Bi as the training dataset using the standard decision tree algorithm with the following modifications:
a. At each node in the tree, restrict the set of candidate attributes to a randomly selected subset (x1, x2, x3, …,
xk), where k = no. of features.
b. Do not prune the tree.
Figure.2 The proposed Intrusion Detection System
Data set
Preprocessing
Scaled
Data
Feature map
Convert Symbolic Feature to numeric Value
Scaling
Feature Selection
Principle Component Analysis (PCA)
Reduced Dimensi -ons data
Data Splitting
Test Set Training
set
Intrusion Detection
Random Forest
Cross Validation
Training Phase
Volume 1, Issue 1 March 2012
3. Repeat steps (1) and (2) for i = 1, …, no. of trees, creating a forest of trees
τi
, derived from different bootstrap samples.4. When classifying an example x, aggregate the decisions (votes) over all trees
τi
in the forest. Ifτi
(x) is the class of x as determined by treeτi
, then the predicted class of x is the class that occurs most often in the ensemble, i.e. the class with the majority votes.Random Forest has been applied in various domains such as modeling [17, 18], prediction [19] and intrusion detection system [14, 20]. Zhang and Zulkernine [13] implemented RF in their hybrid IDS to detect known intrusion. They used the outlier detection provided by RF to detect unknown intrusion. Its ability to produce low classification error and to provide feature ranking has attracted Dong et al. [20] to use the technique to develop lightweight IDS, which focused on single attack.
A. Dataset Description
The data set used was the KDD Cup 1999 Data [13], which contained a wide variety of intrusions simulated in a military network environment. It consisted of approximately 4,900,000 data instances, each of which is a vector of extracted feature values from a connection record obtained from the raw network data gathered during the simulated intrusions. The simulated attacks fell in one of the following four categories: DOS-Denial of Service (e.g. a syn flood), R2L- Unauthorized access from a remote machine (e.g. password guessing), U2R- Unauthorized access to superuser or root functions (e.g. a buffer overflow attack), Probing-surveillance and other probing for vulnerabilities (e.g. port scanning).
B. Feature Selection
The feature selection included the basic features of an individual TCP connection such as its duration, protocol type, number of bytes transferred, and the flag indicating the normal or error status of the connection. Other features of an individual connection obtained using some domain knowledge, and included the number of file creation operation, number of failed login attempts. In total, there were 41 features, with most of them taking on continuous values.
C. Normalization
Since our algorithm is designed to be general, it must be able to create clusters given a dataset from an arbitrary distribution. A problem with typical data is that different features are on different scales. This cause bias toward some features over other features. To solve this problem, we convert the data instances to a standard form based on the training dataset’s distribution. That is, we make the assumption that the training dataset accurately reflects the range and deviation of feature values of the entire distribution. Then, we can normalize all data instances to a fixed range of our choosing, and hard code the cluster width based on this fixed range.
VI. EXPERIMENTANDRESULTS
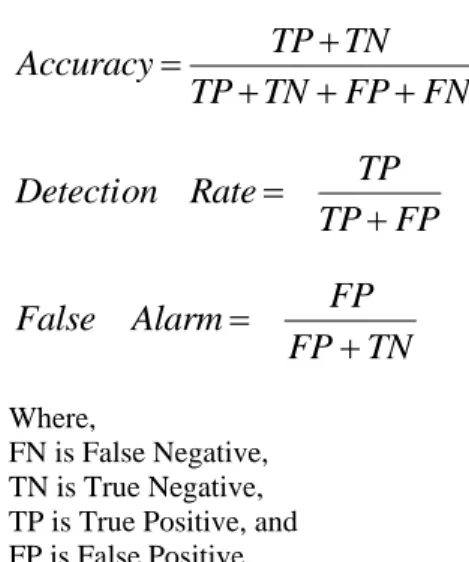
For our experiments we are using KDD CUP 99 dataset. KDD CUP 1999 contains 41 fields as an attributes and 42nd field as a label. In our algorithm we have taken 7473 instances from KDD CUP 99 dataset and have selected randomly as shown in Table1. The 42nd field can be generalized as Normal, DoS, Probing, U2R, and R2L. The performances of each method are measured according to the Accuracy, Detection Rate and False Positive Rate using the following expressions:
FN
FP
TN
TP
TN
TP
Accuracy
FP
TP
TP
Rate
Detection
TN
FP
FP
Alarm
False
Where,
FN is False Negative, TN is True Negative, TP is True Positive, and FP is False Positive
The detection rate is the number of attacks detected by the system divided by the number of attacks in the data set. The false positive rate is the number of normal connections that are misclassified as attacks divided by the number of normal connections in the data set.
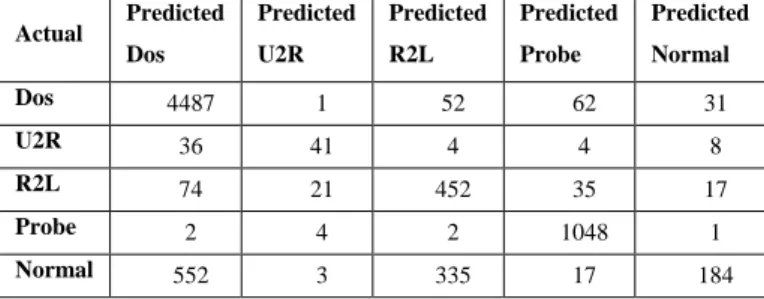
A “Confusion Matrix” is sometimes used to represent the result of , as shown in Table2 and Table3 .The Advantage of using this matrix is that it not only tells us how many got misclassified but also what misclassifications occurred. For our model we get the following confusion matrix.
Attack Types Examples
Normal 1091 Denial of Service 4633 Remote to Local (R2L) 599
User to Root (U2R) 93 Probing 1057 Total Examples 7437
Volume 1, Issue 1 March 2012
Table 4 are showing the overall correctly classified and correctly classified attack by our approach and RBF network. Table4 show our approach are much better than RBF network
0 10 20 30 40 50 60 70 80 90 100
Dos U2R R2L Probing Normal
Class RBF network Detection Rate (%)
Class RBF network False Alarm Rate (%)
PCA via RANDOM FORESTS Detection Rate (%) PCA via RANDOM FORESTS False Alarm Rate (%)
Figure 1: Detection Rate and False Alarm of RBF network and PCA via Random Forest
Table5 and Figure 1 Show the comparison of detection rate and false alarm for our approach and RBF network. As in Table5 and Figure 1 the overall detection rate for our approach is 96.7% while the detection rate for RBF network is 83.3%. In term of false alarm our approach are much better than RBF network shown in Table5 and Figure 1.
Our experimental results showed that the proposed model gives better and robust representation of data as it was able to reduce features resulting in a 80.4% data reduction and approximately 35%-40% reduction in training time and 75%-80% reduction in testing time ,classification accuracy achieved in detecting new attacks. Meantime it significantly reduce a number of computer resources, both memory and CPU time, required to detect an attack. This shows that our proposed algorithm is reliable in intrusion detection.
VII. CONCLUSION AND FUTURE WORK
Our research work based on Intrusion detection system, we found that Most of the existing IDs use all 41 features in the network to evaluate and look for intrusive pattern some of these features are redundant and irrelevant. The drawback of this approach is time-consuming detection process and degrading the performance of ID system. To solve this problem we proposed an algorithm based on PCA (Principal Component Analysis) and RF (Random Forest) that uses Principal Component Analysis as a Features reduction algorithm. The goal of PCA is to reduce the dimensionality of the data while retaining as much as possible of the variation present in the original dataset and trained artificial neural network to identify any kind of new attacks .Tests and comparison are done on KDD CUP 99 dataset. The test data contains 4 kinds of different attacks in addition to normal system call. Our experimental results showed that the proposed model gives better and robust representation of data as it was able to reduce features resulting in a 80.4% data reduction and approximately 35%-40% reduction in training time and 75%-80% reduction in testing time ,classification accuracy achieved in detecting new attacks. Meantime it significantly reduce a number of computer resources, both memory and CPU time, required to detect an attack. This shows that our proposed algorithm is reliable in intrusion detection.
Actual Predicted Dos
Predicted U2R
Predicted R2L
Predicted Probe
Predicted Normal Dos 4487 1 52 62 31 U2R 36 41 4 4 8 R2L 74 21 452 35 17 Probe 2 4 2 1048 1 Normal 552 3 335 17 184
Table2 : Confusion Matrix for RBF network classifier.
PCA with Random Forest
RBF Network Correctly
Classified Instances
7228 96.72% 6212 83.12%
Incorrectly Classified Instances
245 3.28% 1261 16.87%
Total Number of
Instances
7473 7473
Table4: shows the summary of cross-validation of RBF network and PCA via Random Forest.
Class
RBF network
PCA via RANDOM FORESTS Detection
Rate (%) False Alarm Rate (%)
Detection Rate (%)
False Alarm Rate (%) Dos 96.8 23.4 99.8 0.8
U2R 44.1 0.4 87.1 0.1
R2L 75.5 5.7 84.8 1.8
Probing 99.1 1.8 99.1 0
Normal 16.9 0.9 88.7 1.4
Weighte
d Avg. 83.1 15.3 96.7 0.8
Table5 : Detection Rate and False Alarm of RBF network and PCA via Random Forest
Actual Predicted Dos
Predicted U2R
Predicted R2L
Predicted Probe
Predicted Normal
Dos 4624 2 2 1 4
U2R 3 81 8 1 0 R2L 4 3 508 0 84
Probe 7 1 0 1047 2 Normal 8 0 115 0 968
Volume 1, Issue 1 March 2012
REFERENCES
[1] "Symantec-Internet Security threat report highlights (Symantec.com)",
http://www.prdomain.com/companies/Symantec/newreleases/Symant ec_internet_205032.htm
[2] Anderson, D., Frivold, T., Valdes, A.: Next-Generation intrusion Detection Expert System (NIDES): A Summary. Technical Report SRI-CSL-95-07, Computer Science Laboratory, SRI International, Menlo Park, California (1995)
[3] Schonlau, M., Theus, M.: Detecting Masquerades in Intrusion Detection Based on Unpopular Commands. Information Processing Letters, Vol. 76 (2000) 33-38
[4] Forrest, S., Hofmeyr, S.A., Somayaji, A., Longstaff, T.A.: A Sense of Self for Unix Processes. Proceedings of the IEEE Symposium on Security and Privacy, IEEE Computer Society Press, Oakland, CA (1996) 120-128
[5] Lee, W., Stolfo, S.: Data Mining Approaches for Intrusion Detection. Proceedings of the 7th USENIX Security Symposium, Usenix Association, San Antonio, Texas (1998) 79-94
[6] Warrender, C., Forrest, S., Pearlmutter, B.: Detecting Intrusions Using System Calls: Alternative Data Models. Proceedings of the IEEE Symposium on Security and Privacy, IEEE Computer Society Press, Oakland, CA (1999) 133-145
[7] S. Mukkamala, A.H. Hung and A. Abraham, “Intrusion Detection Using an Ensemble of Intelligent Paradigms.” Journal of Network and Computer Applications, Vol.
28(2005), 167-182.
[8] A.H. Sung and S. Mukkamala, “The Feature Selection and Intrusion Detection Problems.” Proceedings of Advances in Computer Science - ASIAN 2004: Higher- Level Decision Making. 9th Asian Computing Science Conference. Vol. 3321(2004) , 468-482.
[9] S. Chebrolu, , A. Abraham, and J.P. Thomas, “Feature Deduction and Ensemble Design of Intrusion Detection Systems.” International Journal of Computers andSecurity, Vol 24, Issue 4,(June 2005), 295-307.
[10] S. Mukkamala, A.H. Sung and A. Abraham, “Modeling Intrusion Detection Systems Using Linear Genetic Programming Approach.” LNCS 3029, Springer Hiedelberg, 2004, pp. 633-642.
[11] Abraham and R. Jain, “Soft Computing Models for Network Intrusion Detection Systems.” Soft Computing in Knowledge Discovery: Methods and Applications, Springer Chap 16, 2004, 20pp.
[12] A. Abraham, C. Grosan, and C.M. Vide, “Evolutionary Design of Intrusion Detection Programs.” InternationalJournal of Network Security, Vol. 4, No. 3, 2007, pp. 328-339.
[13] F. Roli, J. Kittler, (Eds.). Multiple Classifier Systems. Springer- Verlag, Lecture Notes in Computer Science,
vol. 2364, 2002
[14] L. Breimann, 2001, “Random Forests.” Journal of Machine Learning, Kluwer Academic, Netherland, Vol.45, pp. 5-32, 2001.
[15] J. Zhang, and M. Zulkernine. “A Hybrid Network Intrusion Detection Technique Using Random Forests.” In Proceedings of the IEEE First International Conference on Availability, Reliability and Security (ARES’06), 2006.
[16] T.M. Khoshgoftaar, M. Golawala and J. Van Hulse, “An Empirical Study of Learning from Imbalanced Data Using Random Forest." In
Proceedings of the 19th. IEEE Conference on Tools with Artificial Intelligence, pp. 310-317, 2007.
[17] P. Xu, and F. Jelinek, “ Random Forests and the Data Sparseness Problem in Language Modeling.” Journal of Computer Speech and Language, 21(1), pp. 105-152, 2007.
[18 ] J. Peters, B. De Baets, N.E.C Verhoest, R. Samson, S. Degroeve, P. De Becker and W. Huybrechts, “Random Forests as a Tool for Ecohydrological Distribution Modelling.” Journal of Ecological Modelling, 207(2- 4), pp. 304-318, 2007.
[19] B. Lariviere, and D. Van den Poel, “Predicting Customer Retention and Profitability by Using Random Forests and Regression Forests Techniques.” Journal of Expert Systems with Applications, 29(2), pp. 472-482, 2005.
[20] S.K. Dong, M.L. Sang, and S.P. Jong, “Building Lightweight Intrusion Detection System Based on Random Forest.” LNCS 3973, Springer-Verlag, Berlin Heidelberg (2006) pp. 224-230.
[21] Lindsay I Smith A tutorial on Principal Components Analysis February 26,2002.