DEVELOPMENTAL TRAJECTORIES OF AUTISM SPECTRUM DISORDER SYMPTOMS IN AT-RISK TODDLERS
Allison T. Meyer
A dissertation submitted to the faculty at the University of North Carolina at Chapel Hill in partial fulfillment of the requirements for the degree of Doctor of Philosophy in the
Department of Psychology and Neuroscience (Clinical)
Chapel Hill 2016
Approved by: Andrea Hussong Laura Klinger
ABSTRACT
Allison T. Meyer: Developmental Trajectories of Autism Spectrum Disorder Symptoms in At-Risk Toddlers
(Under the direction of Laura G. Klinger)
Symptoms of Autism Spectrum Disorder (ASD) including impairments in social communication and the presence of restricted and repetitive behavior (RRBs) are present in the first 2 years of life, prior to diagnosis. This study compared two developmental models describing the early emergence of ASD symptoms, Social Motivation and Attention theories, in a community-based sample of infants who were followed from 12 months of age into early childhood. Participants included 43 children identified at high-risk for a later diagnosis of ASD based on a positive screen on the First Year Inventory (FYI) at 12 months of age. Toddlers were evaluated at 13 and 22 months, followed by a diagnostic evaluation at 3-5 years. Video coding for social motivation (looking at people) and difficulty disengaging attention (shifting of attention and RRBs) was completed at 13 and 22 months. Path analyses were conducted to evaluate the direct and indirect effects of measures of looking at people, attention shifting, and RRBs on ASD symptom severity. Results indicated a significant indirect effect from decreased looking at people at 13 months to decreased attention shifting at 22 months to increased ASD symptom severity at age 3-5 years. Further analyses indicated that this indirect effect remained when only examining social-specific shifting (i.e., attention shifting including a person) but was not present when only including non-social shifting (i.e., shifting attention between objects). Results from this study better support the Social
ACKNOWLEDGEMENTS
I want to start by thanking my advisors Laura Klinger and Lauren Turner-Brown. Laura, you have been my advisor for 5 years. I am incredibly appreciative of the opportunity you gave for me to attend University of North Carolina. We have been together at UNC since you started here in 2011. We have been on this journey together, navigating a new university system and building our relationship as advisor and student. You have provided support when I needed and also allowed me to flourish independently in order to better build my own skills, confidence, and abilities. I have learned so much from you and am so glad I was able to be a part of starting the research program at the TEACCH Autism Program. Lauren, you have been an endless source of resources, ideas, and advice in the few short years we worked together. I have learned so much from you that I will take with me wherever I go. You provided me with an incredible opportunity to complete my dissertation using a research program outside of TEACCH and expand my research network, experiences, and
opportunities in the process.
I would also like to thank all of m committee members Andrea Hussong, Deborah Jones, and Peter Ornstein for their encouragement, support, and advice, Andrea, you were incredibly helpful in pushing me to ask more sophisticated research questions about
development in my research and providing extensive support in understanding the statistical analyses and feel confident in my ability to navigate new methodological processes.
thank you for offering your expertise on attention and the development of attentional
processes which encouraged me to look back at some early work on attention development in cognitive psychology.
In addition to my dissertation committee, I received incredible support from the PEARLS research team at UNC, particularly Linda Watson, Grace Baranek, Steve Reznick, and Betsy Crais. You allowed me to come in and work on this long-term project at the very end and complete my dissertation. I am incredibly grateful for your willingness to take a chance on a new-to-you student and allow me to use this data, your research space, and resources. You listened to my research ideas and helped to further develop my initial ideas into a fascinating question on the development of ASD. Your expertise in ASD and
respective fields allowed me to expand the depth and breadth of my dissertation.
In addition to all the faculty support I received, I would also like to thank my family and friends for their support. They have continually listened to me talk about my dissertation for months (or years) and have always maintained their never-ending support and belief in my ability to complete this project.
TABLE OF CONTENTS
LIST OF TABLES ... ix
LIST OF FIGURES ... x
LIST OF ABBREVIATIONS ... xi
CHAPTER 1: Developmental Trajectories of Autism Spectrum Disorder Symptoms in At-Risk Toddlers ... 1
Social Communication and Reciprocity ... 2
Dyadic Interactions ... 3
Triadic Interactions/Joint Attention ... 6
Summary ... 8
Restricted and Repetitive Behaviors ... 8
Comparison of RRBs to Typical Development and Developmental Delay ... 10
Summary ... 14
Developmental Theories of ASD ... 14
Social Motivation Theory ... 15
Attention Theory ... 17
Issues on Research in Developmental Trajectories in ASD ... 21
Present Study ... 23
Social Motivation Theory Aims ... 24
CHAPTER 2: METHOD ... 26
Study Design and Participants ... 26
Diagnostic Outcome ... 27
Measures ... 29
Treatment ... 36
CHAPTER 3: RESULTS ... 37
Data Analysis Plan ... 37
Analysis of CSBS Measures of Social Motivation and Sticky Attention Variables ... 38
Cognitive Ability and ADOS Symptom Severity ... 42
Analysis of CSBS Variables, Cognitive Ability, and ASD Symptoms ... 45
Path Analysis Model with Overall Attention Shifting ... 47
Path Analysis Model with Social vs. Non-Social Attention Shifting ... 49
CHAPTER 4: DISCUSSION ... 52
Social Motivation Theory ... 54
Attention Theory ... 57
Role of RRBs in Developmental Trajectories ... 61
Cognitive and Developmental Abilities ... 63
Implications for Early Intervention ... 65
Limitations and Future Directions ... 68
Summary and Conclusions ... 71
LIST OF TABLES
Table 1 – Group Differences in Standardized Measures at Time 1 and Time 2…………..…73 Table 2 – Demographics at Time 3………..74 Table 3 – CSBS Measures of Looking at People, Attention Shifting, RSM
Behavior...…….75
Table 4 – Participant Characteristics for CSBS Measures of Looking at People,
Attention Shifting, and RSM Behavior ………..…..………..76 Table 5 – Pearson Correlations Between CSBS Measures of Looking at People,
Attention Shifting, and RSM Behavior...…………..….………...77
Table 6 – Correlation Between Cognitive Ability and ASD Symptoms...………..…….…...78 Table 7 – Correlation Between CSBS Measures of Looking at People, Attention
LIST OF FIGURES
Figure 1 – Proposed path analysis model to assess Social Motivation and
Attention Theories ………..………..80 Figure 2 – Proposed full model of path analysis with Looking at People, Attention
Shifting, and Repetitive and Stereotyped Movements (RSM) Total as
separate predictors at Time 1 and Time 2...………..………...81
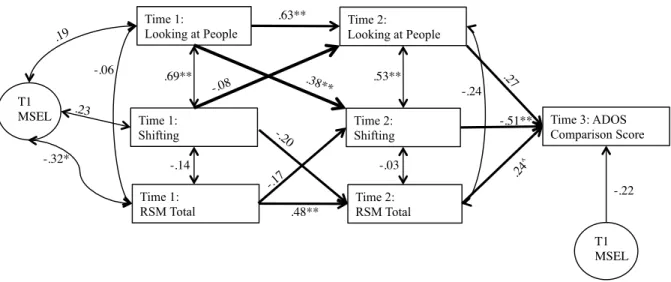
Figure 3 – Results of path analysis examining the direct and indirect effects of Time 1 and Time 2 Variables of Looking at People, Attention Shifting, And Repetitive and Stereotyped Movements (RSM) predicting Time 3
ADOS symptom severity scores.………...82 Figure 4 – Results of path analysis examining the direct and indirect effects of
Time 1 and Time 2 Variables of Looking at People, Social Attention Shifting, and Repetitive and Stereotyped Movements (RSM) predicting
Time 3 ADOS symptom severity scores………..………..………...83 Figure 5 – Results of path analysis examining the direct and indirect effects of
Time 1 and Time 2 Variables of Looking at People, Non-social Attention Shifting, and Repetitive and Stereotyped Movements (RSM) predicting
LIST OF ABBREVIATIONS
ADOS Autism Diagnostic Observation Schedule ASD Autism Spectrum Disorder
CSBS Communication and Symbolic Behavior Scale DAS-2 Differential Ability Scales-Second Edition
DD Developmental Delay
EDP2 Early Development Project-2 FYI First Year Inventory
ID Intellectual Disability
MSEL Mullen Scales of Early Learning
RBS-R Restricted and Repetitive Behavior Scale-Revised RRB Restricted and Repetitive Behavior
CHAPTER 1: Developmental Trajectories of Autism Spectrum Disorder Symptoms in At-Risk Toddlers
Autism Spectrum Disorder (ASD) is characterized by impairments in social
communication and interaction and the presence of restricted and repetitive behaviors and interests (RRBs). These broader symptom categories are present throughout life, however the specific symptoms change throughout development. ASD can be diagnosed accurately by between 2-3 years of age with symptoms both in social communication and interaction and repetitive behaviors developing during the first two years of life (Ozonoff et al., 2015; Rondeau et al., 2011; Woolfenden, Sarkozy, Ridley & Williams, 2012). For example, studies have suggested that individuals with ASD exhibit impairments in social attention in the first 6-12 months of life (Dawson et al., 2004). Individuals with ASD also exhibit atypical repetitive motor behaviors by 12 months (Wolff et al., 2014). Although we know that these atypical social communication and repetitive behaviors unfold across time, little is known about how these two symptom areas interact and influence one another during early development. Understanding these developmental processes can help inform intervention programs that target these impairments early in life. The broad overall goal of this study is to better understand the developmental processes of social attention, attention shifting, and RRBs and their relationship to one another during early development in children with and without ASD from age 1-5 years.
ASD is needed. Specifically, these symptom categories will be discussed as they relate to infants and toddlers later diagnosed with ASD and be compared to early typical development and developmental delay to better understand when differences in development begin to arise. Last, two theoretical models will be discussed in their relation to ASD symptom development. These models focus on how early impairments related to ASD symptoms influence one another and the cascading effects of early impairments in specific
developmental areas.
Social Communication and Reciprocity
Individuals with ASD exhibit impairments in social communication and interaction throughout their life. The DSM-IV-TR (American Psychiatric Association, 2000) separated social and communication impairments into two separate categories. However, given the overlap in these symptoms and the difficulty in differentiating social specific and
communication specific impairments, the most recent diagnostic criteria in the DSM-5 (American Psychiatric Association, 2013) for ASD focuses on impairments in social communication and interaction as a single symptom category.
Core impairments in social communication and interaction are maintained throughout the lifespan; however, the presentation of these symptoms changes over time as the
individual develops and gains new skills. Impairments in social emotional reciprocity include difficulties with back-and-forth conversations, reduced sharing of interests, emotions, or affect, or failure to initiate or respond to social interactions. For young children with ASD, this symptom may appear as difficulty with back-and-forth social games such as peek-a-boo or infrequent showing of preferred toys or other objects. Nonverbal communication
using and understanding nonverbal communication such as eye contact or body language. Infants and toddlers later diagnosed with ASD may use less eye contact or fewer gestures such as pointing or reaching to objects to indicate a preference. Deficits in developing, maintaining, and understanding relationships include difficulties understanding changes in behavior in different contexts, difficulty making friends and engaging in shared play and enjoyment with others. In young children with ASD, this may be exhibited in their decreased interest in other people or children in their environment and/or a difficulty in developing early play skills.
When more specifically examining the development social communication and interaction in infants and toddlers later diagnosed with ASD, the literature has focused on two types of social impairments: dyadic interactions and triadic interactions (e.g., joint attention).
Dyadic Interactions
In children with typical development, dyadic social engagement develops during the first few months of life (Bakeman & Adamson, 1984). That is, young children engage their attention with one other object or person at time (e.g., just a toy or just a person). Dyadic interactions typically involves another person as infants show a preference for and response to social stimuli within the first few months of life (Haith, Bergman, & Moore, 1977). Early dyadic interactions with other people include reciprocal social interactions with a single person such as during peek-a-boo or responding to their name being called.
without clear evidence of a preference for social information by 12 months. Atypical social engagement has been found in studies documenting decreased dyadic orienting, attention to faces (e.g., eye contact), and social reciprocity in infants who are later diagnosed with ASD (Osterling & Dawson, 1994; Wetherby, Woods, Allen, Cleary, Dickinson, & Lord,. 2004). One of the hallmark “red flags” for ASD is failure to respond to one’s name being called or other bids for social attention during early development (Baranek, 1999; Clifford &
Dissanayake, 2008; Leekam & Ramsden, 2006; Osterling & Dawson, 1994). Clifford and Dissanayake (2008) used both retrospective parent interview and old home videos of children from birth to 24 months of age to examine dyadic interactions in children with ASD
compared to those with typical development and developmental delay. Compared to the other groups, parent’s reported that children with ASD exhibited impairments in dyadic
interactions by 6-12 months including infrequent eye contact and decreased responsive social smiles. Video coding of these same dyadic behaviors during the first two years of life
confirmed that children with ASD had impairments in eye contact both in frequency and quality compared to those with typical development and developmental delay (DD).
oriented to social stimuli less frequently than non-social stimuli. Similar to Leekam and Ramsden (2006), those with ASD oriented less to all types of social stimuli compared to those with DD. These findings suggest that social orienting is specifically impaired in children with ASD rather than non-social orienting.
Social engagement is also frequently measured through eye-tracking of human faces. These computer-based measures can help to identify impairments in dyadic interactions in very young children using a controlled experimental design. These tasks measure face recognition or preferential gaze toward social versus nonsocial stimuli. Studies examining how infants and toddlers later diagnosed with ASD attend to social stimuli such as faces have found mixed results. Chawarska and Volkmar (2007) examined face recognition of people versus monkeys in 2 and 4 year-old children with ASD and DD. After being familiarized with the people and monkeys, 2-year-olds with ASD were no better at recognizing human faces compared to monkeys while those with DD did perform better with human faces versus monkey faces, although this difference did not present in 4-year-old participants. This
appear to have decreased or atypical spontaneous attention to social information, particularly faces, which may interfere with their ability to process social information.
Across this body of literature, there is evidence that children later diagnosed with ASD exhibit impairments in social orienting and dyadic interactions at a young age that is not related to developmental delay and may influence subsequent social skill development as evidenced by parent report, behavior observation, and eye-tracking studies.
Triadic Interactions/Joint Attention
Following the development of dyadic interactions, 9 to 10-month-old infants with typical development engage in triadic interactions with others by incorporating objects and other information into social interactions (Striano & Rochat, 1999). During these interactions, infants shift their gaze between an object and a person to communicate with a person about the object; to share their interest in an object, request an object, express emotional distress, or express other needs. This shared or joint attention is an integral part of development that helps children better understand social relationships, interactions, and their general
Studies suggest that infants later diagnosed with ASD are impaired in triadic interactions including a lack of or impairment in both their response and initiation of joint attention (Dawson et al., 2004). A lack of joint attention skills and lack of appropriate gaze during the first 2 years of life is considered one of the “red flags” for parents of children with ASD (Wetherby et al., 2004). Specifically, infants and toddlers later diagnosed with ASD have difficulty following another person’s gaze or point in order to share information or attend to relevant social information (Charman, 2003; Charman, Swenttenham, Baron-Cohen, Cox, Baird, & Drew, 1997). For example, infants later diagnosed with ASD may not look up when their mom points to a plane in the sky and says “Look! A plane!” Based on retrospective parent report and detailed video coding, infants later diagnosed with ASD between birth and 24 months initiate and respond to joint attention less frequently than children with typical development or DD (Clifford & Dissanayake, 2008). Similarly, during naturalistic play assessment, three-year-old children with ASD make fewer attempts to initiate joint attention and are less likely to respond to joint attention compared to children with DD or typical development (Dawson et al., 2004).
To further understand triadic engagement, studies have specifically examined how infants and toddlers later diagnosed with ASD shift their attention between social and nonsocial stimuli. Chawarska, Volkmkar, and Klin (2010) suggest that infants with typical
Summary
Infants and toddlers with ASD exhibit difficulties both in general dyadic social
engagement and triadic interactions in which enjoyment is shared with others. The literature is compelling in suggesting that infants with ASD interact with people and their surrounding environment differently compared to infants with typical development (Osterling & Dawson, 1994; Wetherby et al., 2004). Infants with ASD are clearly searching, scanning, focusing on, and engaging with people, objects, and their environment differently very early in life. Understanding how infants and toddlers with ASD engage with their social environment can provide insight into how infants engage with nonsocial stimuli.
One hypothesis regarding impairments in social engagement is that individuals with ASD have an underlying impairment in social motivation (for review see, Dawson, Webb, & McPartland, 2005) that leads to decreased social interaction with others. Conversely, this hallmark impairment in social motivation suggests that individuals with ASD may be more motivated to engage in nonsocial interactions and experiences. For infants and toddlers with ASD, these nonsocial interests likely include RRBs. That is, infants and toddlers with ASD may experience more positive reinforcement from engaging in repetitive behaviors with objects than from engaging in social interactions with others.
Restricted and Repetitive Behaviors and Interests
between those with ASD and those without as infants and toddlers with ASD engage in repetitive kicking or banging of objects similar to those with typical development (Charman & Baird, 2002; Cox, 1999; Ventola et al., 2006) or those with developmental delay ( Stone et al., 1999). Instead, social and communication impairments associated with ASD were
thought to be present during the first two years of life while repetitive behaviors and restricted interests were believed to not appear until early childhood. More recent research, though, has suggested that young children with ASD do in fact appear engage in behaviors that are representative of the RRB symptoms described in the DSM-5 (e.g., Wolff et al., 2014; Elison et al., 2014).
There are 4 areas of RRBs described in the DSM-5 that are considered when providing a diagnosis of ASD. The first area includes stereotyped repetitive motor movements, use of objects, or speech as core symptoms of ASD. These atypical behaviors are present early in life for infants later diagnosed with ASD, continue throughout early childhood, and interfere with a child’s ability to appropriately and effectively interact with their world. Insistence on sameness and the presence of circumscribed interests are the last 2 types of RRBs. This includes behaviors related to rigidity, ritualized patterns of behavior, and overall difficulties with changes in routine and/or environment. These behaviors increase during early childhood and persist throughout development in individuals with ASD (Chowdhury, Benson, &
Hillier, 2010; Hattier, Matson, Tureck, & Horovitz, 2011). RRBs also include the presence of
2009) although it was not included in the diagnostic criteria until the publication of the DSM-5. This symptom category includes “hyper- or hypo-reactivity to sensory input or unusual interest in sensory aspects of the environment (American Psychiatric Association, 2013).” These symptoms may be evident in ASD as early as 9-12 months of age evidenced by
sensitivity to touch and other sensitivities (Baranek, 1999). While RRBs are a core symptoms category within ASD, it is imperative to understand the development of RRBs in the context of repetitive behaviors during early typical development to compare to atypical development in infants and toddlers later diagnosed with ASD.
Comparison of RRBs to Typical Development and Developmental Delay
Studies examining RRBs in individuals with ASD compared to those with typical
development have primarily looked at RRBs as one broad symptom category rather than each area of RRBs as a separate symptom. However, given the importance of repetitive motor behavior in early typical infant development, some research has examined repetitive motor mannerisms and repetitive objects use more specifically in typical development compared to infants later diagnosed with ASD.
Studies that examine RRBs as a single, broad category have found mixed results. These studies primarily use parent-report measures and interviews rather than video coding or experimental measures. For example, Cox et al. (1999) examined RRBs in children at 20 months and 42 months using the Autism Diagnostic Interview- Revised (ADI-R), a comprehensive parent interview related to ASD symptoms. There were no significant
on this parent interview such that those with ASD exhibited more RRBs than children with typical development.
Other studies have suggested that while children with typical development exhibit some RRBs, children with ASD have behaviors that are above and beyond that of typical
development (Harrop, McConachie, Emsley, Leadbitter, & Green, 2014; Ray-Subramanian & Ellis Weismer, 2012; Wolff et al., 2014). For example, Harrop et al. (2014) found that while children with typical development had some RRBs from age 3-5, the RRBs of children with ASD were consistently higher in frequency and/or intensity.
and continued to be present at 24 months. In those with typical development, these RRBs were present at lower frequency at 12 months and either decreased or stayed significantly lower compared to those later diagnosed with ASD (Wolff et al., 2014). Repetitive motor mannerisms in infants with ASD do not appear to have a clear function or assist in the learning and development of everyday skills as it does in typical development (e.g. transition from crawling to walking).
Studies examining repetitive use of objects in infants later diagnosed with ASD have been mixed in identifying whether this is an early developing symptom of ASD (Bruckner & Yoder, 2007; Elison et al., 2014; Ozonoff et al., 2008; Watt, Wetherby, Barber, & Morgan, 2008). For example, Ozonoff and colleagues (2008) found that 12-month-old infants that were later diagnosed with ASD explored objects differently, such that they spent more time rotating, spinning, and engaging in unusual visual exploration compared to infants with delayed or typical development. In contrast, Elison et al. (2014) suggest that while 12-month olds later diagnosed with ASD engaged in repetitive object manipulation, high risk infants (i.e., infants with a sibling diagnosed with ASD) who were not later diagnosed with ASD showed the same amount of repetitive object manipulation. Thus, this symptom did not differentiate between diagnostic groups. Together, this suggests that repetitive object use may be developmentally representative of subclinical ASD characteristics in infants rather than specific to ASD at this young age.
whether it is specific to ASD. Studies have suggested that while children with DD also exhibit RRBs similar to those with ASD, they are lower in frequency and intensity compared to those with ASD and these group differences increase with age and development. For example, At 12 months, retrospective parent report suggests that children with ASD showed significantly more ASD symptoms than those with DD (Watson et al., 2007). This report from the First Year Inventory (FYI) examined specific items that targeted RRBs indicating that those with ASD were getting “stuck” on an activity or part of toy more often than those with DD at 12 months suggesting an “insistence on sameness” in activities as well as a “repetitive use of objects” in ASD at a very early age. At 18-24 months, differences in RRBs continue to be present, particularly with regards to repetitive and stereotyped behaviors with body and objects in toddlers with ASD compared to those with DD (Morgan, Wetherby, & Barber, 2008). When children with ASD and DD are compared at 28 months, those with ASD continue to exhibit more RRBs than those with other delays. For example, Kim and Lord (2010) examined RRBs in ASD and non-ASD delays (e.g. language delay, mild intellectual disability, global developmental delay) based on scores from the Autism Diagnostic Observation Schedule (ADOS). Results suggest that while the ASD group
developmental delay. In this same study, those with ASD continued to show higher levels of RRBs on all subscales of the RBS-R compared to those with typical development.
Summary
Overall, this literature shows that infants and toddlers with ASD show higher rates of RRBs compared to those with typical development suggesting that RRBs are a defining characteristic of ASD in the first few years of life and can be a useful tool to assist in ASD diagnosis during toddlerhood. The differences in symptomatology between ASD, DD, and typical development throughout infancy and toddlerhood suggest a different developmental pattern of RRBs in ASD.
Developmental Theories of ASD
For decades, researchers have tried to identify an underlying theory behind ASD symptom development during infancy and toddlerhood. Two primarily symptom categories have been clearly identified characterized: (1) impairments in social communication and interaction and (2) the presence of RRBs. Studies suggest that both of these symptom
Social Motivation Theory
Broadly, the Social Motivation Theory of ASD suggests that individuals with ASD have less motivation to attend to social information in their environment from a very early age. As a result, young children with ASD spend less time engaged in social interactions and their social communication and interaction skills develop atypically during the first years of life. Because of this decreased social motivation, engagement is instead directed towards objects, which, in turn, leads to atypical use of objects or repetitive use of objects (see Chevalier, Kohls, Troiani, Brodkin, & Schultz, 2012; Dawson et al., 2004).
Social Motivation theory has primarily focused on individual’s attention to social information, particularly faces and people during early childhood. One of the hallmark features of ASD is impaired or atypical use of eye contact (Mundy, Sigman, Ungerer, & Sherman, 1986; Senju & Johnson, 2009) and difficulties interpreting others facial
expressions (for reviews see Dawson, Web, & McPartland, 2005; Gremiel et al., 2014). In infancy, researchers hypothesize that this begins as decreased motivation to look at faces and social information in the environment.
To date, though, there is not a clear understanding of how this decreased attention and interest in social information is related to behavioral symptoms occurring later in
development. It is hypothesized that this early social impairment has a cascading effect that leads to the core social impairments observed in ASD, although there is no clear evidence on the progression of this effect. Based on this theory, reduced dyadic engagement with faces in the first few months of life leads to impairments in triadic interactions and increased focused on objects during the first two years of life.
This increased focused on objects may show a cascading effect with regards to the development of RRBs. It has been suggested that infants with ASD have a heightened interest in objects rather than what may otherwise be perceived as a disinterest in people and social interactions (e.g., Bruckner & Yoder, 2007; Ozonoff et al., 2008). For example, twelve-month old infants later diagnosed with ASD spend significantly more time exploring objects (i.e. visually inspecting) in an unusual way compared to infants with typical and delayed development (Ozonoff et al., 2008). This suggests that at a young age, individuals with ASD are paying attention to and visually exploring objects in a fundamentally different way. Their attention to objects is different such that it may impair their ability to
appropriately explore their environment to understand the true function of object and focus their attention on meaningful, functional stimuli. In addition, Ozonoff et al. (2008) found that these infants also spent more time rotating and spinning objects, an atypical use of the
engagement with people or social stimuli corresponds directly with heightened focus on objects. While many studies examine behavior during the first year of life, there is then not a clear intermediary assessment of behavior prior to diagnosis at 2-3 years of age. It is
necessary to examine the cascading effects of decreased social engagement through longitudinal studies with repeated measures of social engagement and core impairments related to ASD.
Attention theory
In contrast, attention theory proposes that individuals with ASD have an underlying impairment in general attention focus and engagement across both social and non-social information. This atypical development of attention interferes with an individual’s ability to appropriately engage with both social and nonsocial information. Specifically, it is
hypothesized that infants with ASD have “sticky attention” such that they have difficulty disengaging and shifting their attention (Landry & Bryson, 2004; Sacrey et al., 2013).
This mixed literature may be, in part, due to the age of participants studied. Few studies have examined attention shifting in infants who are later diagnosed with ASD. Studies with older children and adults with ASD typically do not find significant differences in saccadic reaction time and latency to disengage and shift attention during visual
disengagement tasks (see Sacrey et al., 2014 for review). For example, adults with ASD show similar reaction time to adults with typical development on Gap and Overlap trials in a Gap-Overlap task (Kawakubo et al., 2004). Similarly, Fischer and colleagues (2013) suggest that children with ASD ages 5-12 perform similarly to their peers with typical development during a disengagement task. Studies with preschool-aged children tend to show longer reaction times in disengaging attention from a central stimulus and shifting to a new stimulus in children with ASD compared to those with typical development and those with Down syndrome (Landry & Bryson, 2004). This suggests that impaired ability to disengage and shift attention may not be a byproduct of developmental delay but rather a true attention difficulty in young children.
between age 21 and 37 months performed similar to children with typical development. The authors suggest that sticky attention is not an underlying impairment in ASD nor is it a causal factor in the development of ASD in early childhood.
Sacrey, Bryson, and Zwaigenbaum (2013) examine the process of disengagement of attention when grasping objects in a naturalistic play setting from 6-36 months in infants at high-risk for ASD. By 12 months of age, children later diagnosed with ASD took longer to disengage their attention compared to those that were low-risk and/or did not receive a diagnosis of ASD. This effect persisted through the second year of life suggesting that the longer latency of disengagement of attention is present through the second year of life. While attention disengagement is a critical component of understanding attention impairments, the next step in the process is to examine what happens after a child disengages their attention from an object. Are they shifting their attention to another object or person in the
environment? Are they disengaging their attention and then their gaze wanders for a period of time before then re-engaging their attention with something else?
Differences in attention to social information, specifically faces, are clear from an early age, although the underlying function continues to be uncertain. Jones and Klin (2013) suggest atypical visual attention to faces by 6 months in infants later diagnosed with ASD and varied trajectories of attention to faces in a longitudinal study of infants at-risk for ASD. It is possible that this type of atypical attention may be present in attention to both objects and social information in early development of infants and toddlers with ASD as there is evidence of atypical attention to both people and objects in infants and toddlers with ASD.
attention between two people and between people and objects compared to those with developmental delay and children with typical development. Attention shifting is decreased in ASD within the context of social information. Another study examined attention shifting during a play interaction where parents were asked to engage face-to-face with their child, then to hold their face still for 2 minutes, and then re-engage in a face-to-face interaction (Ibanez, Messinger, Newell, Lambert, & Sheskin, 2008). Infant siblings of children with ASD shifted less frequently and spent longer looking away from parents’ faces compared to infant siblings of those with typical development. Together, this highlights the importance of both sticky attention and attention to social information including people and faces in the environment when investigating long-term developmental trajectories.
same behavior one or two times before shifting their attention to something else or looking at a person whereas a child later diagnosed with ASD may continue to engage in a repetitive behavior several times before shifting their attention to something else in their environment. The Attention theory suggests that there is a cascading effect of ASD symptomatology due to an underlying impairment in attention more broadly.
Impairments in attention and the presence of sticky attention appear to be present early in development for children later diagnosed with ASD, particularly when examining social information (i.e., faces). These impairments may have cascading effects on the development of social communication as well the increased presence of RRBs in ASD. However, literature is mixed as to whether this impairment persists across development through childhood and adulthood. A longitudinal study is needed to look at the
developmental unfolding of attention shifting and sticky attention. Further, attention needs to be examined in relation to both social and nonsocial information as much of the research focuses more exclusively on social information.
Issues on Research in Developmental Trajectories in ASD
One way to identify infants at-risk for a later diagnosis of ASD is through infant siblings of children with ASD. These infants are identified to be at high-risk for ASD based on the strong underlying genetic component in ASD as evidenced by the higher rates of ASD in siblings of those with ASD compared to those with siblings without a diagnosis of ASD (Ozonoff et al., 2011). In these prospective studies, infant siblings of children with ASD and infant siblings of children with typical development have been evaluated several times during the first 3-5 years of their life (Elison et al., 2014; Landa & Garrett-Mayer, 2006; Landa, Gross, Stuart, & Faherty, 2013; Ozonoff et al., 2010, 2011; Wolff et al., 2014; Zwaigenbaum, Bryson, Rogers, Roberts, Brian, & Szatmari, 2005). Patterns and signs of development are identified and then tracked across time to determine which are predictive of a later diagnosis of ASD or other developmental delays during toddlerhood and early childhood. These studies provide insight into very early developmental processes that are present prior to an official, behavioral diagnosis of ASD.
While prospective infant sibling studies of ASD have been integral in building our understanding of the development of ASD symptoms; it is necessary to evaluate community-based samples of children at-risk for ASD in order to maintain a truly representative sample of individuals with ASD. Community-based samples of infants at high-risk for ASD are able to identify a larger group of children at-risk for ASD that may or may not have a clear genetic and family history of ASD. These types of samples provide a broader perspective on a representative ASD population as only a portion of individuals with ASD have an older sibling with ASD. However, utilizing community-based samples of children at-risk for a later diagnosis of ASD presents its own challenges. First, many of the early behavioral signs of ASD are not present until 9-12 months of age (Ozonoff et al., 2008; Dawson et al., 2004) or later in the second year of life (Wetherby et al., 2004, 2007). This makes it difficult to determine developmental trajectories starting closer to birth. Further, given the rate of ASD is 1 in 68 individuals, community-based samples require high volume of screening within the larger community in order to identify a large sample of children at-risk for ASD. Even with the need for an extensive and high-volume screening process, research utilizing community-based samples provides exceptional opportunities to understand the symptoms of ASD and their associated developmental trajectories within the broader population.
Present Study
any appropriate diagnosis during the preschool years. Relevant social engagement, attention shifting, and RRBs were coded from video-recorded assessments at 13 and 22 months to track behavioral symptoms in a naturalistic environment. The ability to measure social engagement, attention shifting, and RRBs as they unfolded across a two to three year developmental period allowed for a direct comparison of these two theories of early development in ASD.
Social Motivation Theory Aims:
Social motivation theory suggests that during the first year of life, infants with ASD have a decreased preference for social information that leads to the development of ASD symptomatology across the first few years of life. If the early unfolding of ASD symptoms is related to decreased social motivation, it is hypothesized that decreased looking at people (i.e., decreased social engagement) at 13 months will predict the later development of RRBs and decreased attention shifting at 22 months, which together will predict later ASD diagnosis at, age 3-5 years. See Figure 1.
Attention Theory Aims:
engagement (i.e., looking at people) at 22 months, which together will predict later ASD severity at 3-5 years. See Figure 1.
Exploratory Aim:
This sample of high-risk infants was randomized to receive 1 hour per week of in-home treatment from 13-22 months of age with half receiving the treatment and the other half being in a “services as usual” group. Early data analyses have suggested that the treatment did not significantly change the children’s cognitive ability, ASD symptoms, or adaptive behavior at 22 months. However, it is not yet clear whether treatment had long-term effects on ASD symptoms or diagnosis. Before evaluating the developmental theories of ASD as described above, the present study will
CHAPTER 2: Methods Study Design and Participants
Participants from this study were from the Early Development Project-2 (EDP2), a longitudinal study conducted at the University of North Carolina-Chapel Hill (PIs: Linda Watson, Elizabeth Crais, Lauren Turner-Brown, Grace Baranek, Steve Reznick). This study examined ASD symptoms in a community sample of infants though the use of a caregiver survey, the First Year Inventory (FYI; Watson et al., 2007). The FYI is a 63-item parent report screener used to identify infants at risk for ASD or atypical development at 12 months of age. Using birth records, EDP2 conducted a mass mailing of the FYI to 60,237 families with 12-month old infants in the Triad region of North Carolina (e.g., Wake, Orange, Chatham, Durham, Alamance, and Guilford Counties in the Chapel Hill/Raleigh and Greensboro area were included in these mailings). In total, 14.5% or 8,717 packets were returned with a completed FYI form. Three percent (i.e., 280 families) of the returned forms indicated high scores on the FYI suggesting atypical development or higher risk for ASD. All of the 280 families were called and invited to participate in a research study just after the child’s first birthday. Ninety-six of the 280 toddlers participated in an in-person evaluation at 13-16 months (M=13.78 months, SD=.77; Time 1). Eighty-six of the children were again evaluated 9 months later, prior to their 2nd
Forty-six children were evaluated again at Time 3 to determine diagnostic outcome (M=54.04 months, SD=10.93). Within this final sample, 68.1% are male, 78.7% were White, 12.8% were African-American, 2.1% were Asian American, and 8.5% were mixed race. Some previous studies utilizing community-based samples of children at-risk for ASD or other communication delays had higher rates of male participants (83-89% males) and similar rates of Caucasian vs. non-Caucasian participants (e.g., Wetherby et al., 2004). However, participants from Wetherby and colleagues (2004) were recruited from childcare and healthcare agencies rather than through birth records.
Diagnostic Outcome
Diagnoses and clinical feedback were provided to participants at the Time 3 evaluations. Diagnoses included ASD, Intellectual Disability (ID) or developmental delay (DD),
Language Disorder or Language Delay (LD), Attention Deficit Hyperactivity Disorder (ADHD), Anxiety disorder, and/or Social Pragmatic Communication Disorder (SPCD). Diagnostic categories were grouped into 3 categories including “no concerns,” “some concerns,” and “significant concerns” or meets criteria for full diagnoses. Of the 46 children evaluated at time 3, 16 received a diagnosis of ASD while 18 had no concerns about ASD symptoms. Twelve children presented with some symptoms and concerns regarding ASD, but they did not meet clinical criteria for an ASD diagnosis. In the analyses described below, ASD diagnosis is discussed as a binary variable in that those with some concerns but no diagnosis are grouped with those with “no concerns.”
effects of genetic disorders and ID compared to ASD, these 3 children were excluded from analyses. Recent population studies indicate that approximately 38% of children with ASD also have comorbid diagnoses of ID (Baio, 2014). Given the small number of children with ID in the present study, the ASD sample is not representative of the larger ASD population variation in intellectual ability. In addition, no children without ASD were diagnosed with ID and thus there was not an appropriate comparison sample in the non-ASD group. As a result, 13 participants with ASD were included in the final sample and are considered to have high-functioning ASD as evidenced by their average to above-average cognitive abilities at Time 3.
with ASD without comorbid ID and those without ASD or ID are presented in Tables 1 and 2.
Measures
Communication and Symbolic Behavior Scale (CSBS; Wetherby & Prizant, 2002). The CSBS is a standardized 20-30 minute assessment to assess children on their social communication skills between 6 and 24 months. This assessment includes 6 different
sampling opportunities to elicit a variety of social and communication skills with different objects. The objects used during the sampling opportunities are a balloon, a windup toy, bubbles, jar with cheerios, books, and pretend play toys (e.g., bowl, spoon, cup, doll). In each sampling opportunity, the examiner presents a toy to the child by making the toy work as it is intended (e.g., making the windup toy work). The examiner then waits for the child to
respond by requesting or refusing another turn with the toy. During the CSBS, the child is placed in a seat that attaches to a table and the examiner and a caregiver are on either side. As a result, the child generally stays in one spot and their behavior can be consistently monitored throughout the assessment. This assessment was completed by trained clinicians at Time 1 and Time 2 and includes a broad, global score to determine risk status for communication and social delays. Average standard scores for the CSBS are 100 with a standard deviation of 15 suggesting appropriate development and skills in the areas of communication and
shifting, and RRBs proposed in this study, more detailed video coding is needed. Coding activities for measuring social engagement, attention shifting, and RRBs are discussed below.
Social Motivation. Social motivation was defined as social engagement through looking at people during the CSBS evaluation. Social motivation was measured at Time 1 and Time 2 through video coding of the CSBS. Social motivation was measured as the duration of eye gaze towards people (e.g., the examiner and caregiver). Specifically, the child’s eye gaze patterns were coded to measure where they spent time looking and for how long they fixated on any part of that person (i.e., face, body or hand).
The onset and offset of the child’s gaze for each person was coded throughout the entire assessment. From this data, several composite variables were computed for analyses. First, the total amount gaze time for looking at people was calculated. Total time calculated did not include the time of the assessment where the child was not visible on the screen and therefore their gaze behavior could not be coded. The social engagement variable of Looking at People was calculated as a proportion of total time in order to account for variability in total assessment time.
Attention Shifting. Instances of attention shifting were coded when a child was fixated on one object or person and then shifted directly to another object or person. A shift was only coded when there was a clear disengagement from one thing or person followed immediately by a clear fixation of their attention on something or someone else. A shift was not coded when the child disengaged their attention from an object or person but did not
of shifts per minute in order to account for differences in total assessment time. Three shifting composite variables were calculated with one including all shifts and then one variable measuring Social-only Shifting (i.e., a shift that included another person) and Non-social Shifting (i.e., a shift between objects only).
Video Coding. The social engagement and attention shifting video coding was conducted using ELAN 4.6.1 (Sloetjes & Wittenberg, 2008; http://tla.mpi.nl/tools/tla-tools/elan/). This coding software allows for detailed time-based coding that accurately measures duration of gaze and can mark instances of other relevant behaviors. See attached appendix for coding scheme. While the CSBS is a standardized assessment measure, the length of the assessment varied from 20-30 minutes. In order to account for this variability, composite variables for looking time were converted into proportions of the total assessment time.
Videos were not coded if the CSBS was not recorded during the assessment session or if less than half of the sampling opportunities were not recorded or if the child was not visible during more than half of the activities. In total, 42/43 (98%) CSBS videos from time 1 and 40/43 (93%) videos from time 2 were coded. A second coder, blind to participant
calculated for all composite variables using Intraclass Correlations Coefficients (ICC) and exhibited excellent interrater reliability for Looking at People (.99), and Total Attention Shifting (.94).
Repetitive and Sensory Movement Scale (RSM; Wetherby & Morgan, 2007). RRBs were measured at Time 1 and Time 2 using a coding protocol developed for use with infants and toddlers participating in the CSBS (Wetherby & Morgan, 2007). This scale has been used in several different studies with young children and has differentiated between RRBs in young children with ASD compared to those with typical development (Damiano et al., 2013; Elison et al., 2014; Morgan et al., 2008; Watt et al., 2008).
This coding scheme examined 2 separate areas of RRBs: repetitive movements with body and repetitive or stereotyped movements with objects. In each sampling opportunity (e.g., each set of toys presented), the coder recorded the frequency of each type of repetitive behavior with body and/or objects. In addition, the coder recorded what type of behavior occurs within each category. For repetitive movements with body, behaviors included flapping arms or hands; patting, tapping, or pressing body part; rubbing body part; and stiffening fingers, hands or arms. For repetitive or stereotyped movements with objects, behaviors were categorized into preoccupation in intensity or focus with a particular object and insistence on sameness or difficulty with change in an activity. For the preoccupation category, behaviors included swiping object away; rubbing or squeezing an object; rolling or knocking over an object; rocking, flipping, or turning over an object; and spinning or
Variables were calculated based on the total frequency of behaviors with 3 variables being considered. There are separate total frequencies for RSM with Body, RSM with Objects, and Total RSM. Total RSM was used as the primary variable for overall RRBs in this sample.
Videos were included in RSM coding if all activities were completed and were recorded on video. Some videos included only partial recordings of the CSBS and were not included because the composite RSM variables were total frequency rather than a proportion. In total, 80 tapes were coded with 40 videos (93%) at Time 1 and 40 videos (93%) at Time 2). The videos not coded from Time 1 and Time 2 were not from the same participants. Each participant had a CSBS tape at Time 1 or Time 2 or both. All coding was completed by the author after consulting with Dr. Lindee Morgan, one of the authors of the coding scheme (Wetherby & Morgan, 2007). Coding was completed by hand while watching videos using Windows Media Player. A second coder, blind to diagnostic outcome and treatment group, coded 20 videos (25%) for reliability. Intraclass correlation coefficients indicated good to excellent reliability for all measures (RSM Total=.89; RSM Body=.96; RSM Object=.86). See attached appendix for RSM coding scheme.
ASD Diagnosis. The Autism Diagnostic Observation Schedule-Second Edition (ADOS-2; Lord et al., 2012) was used as a behavioral measure of ASD symptoms at Time 2 and Time 3. The ADOS-2 consists for 5 modules and is a semi-structured play-based
Modules are selected based on the child’s language ability and age. Module 1 is for children who are pre-verbal or use single words and was administered to all participants at Time 2. While formal diagnoses were not provided at Time 2, a total ADOS score was calculated as a measure of ASD symptom severity. A total score of 7 or higher on a Module 1 indicates significant symptoms of ASD.
A licensed psychologist or speech pathologist provided ASD diagnoses using behavioral diagnostic measures (i.e., ADOS-2), parent interview, as well as clinical
judgment. Participants were administered either a Module 1, 2, or 3 based on their language ability and age. Module 1 (pre-verbal or single words) was administered to 2 children; Module 2 (phrase speech) was administered to 20 children, and Module 3 (fluent speech for children above 48 months) was administered to 20 children. From the total ADOS-2 score, an overall severity or comparison score for ASD symptoms was computed on a 1-10 scale with higher scores indicating more severe ASD symptoms. This severity score allows for
appropriate comparison across all modules for all participants at Time 3. This score was used as a continuous measure of ASD symptom severity across all children at Time 3.
Mullen Scales of Early Learning (MSEL; Mullen, 1995). The MSEL is a measure of cognitive ability for children from birth to 68 months and was administered at Time 1 and Time 2. A Developmental Quotient (DQ) Standard Score provides and overall score for cognitive ability in young children. The DQ consists of the Visual Reception, Fine Motor, Expressive Language, and Receptive Language subscales. These subscales are calculated as T-scores with a mean of 50 and standard deviation of 10. An overall Early Learning
standard deviation of 15. Group differences for the ASD compared to the non-ASD group at Time 1 and Time 2 can be found in Table 1.
Differential Ability Scales-2nd
Edition (DAS-2; Elliot, 2007). The DAS-2 is a measure of IQ for children ages 2 years 6 months through 17 years 11 months. This study used subtests for the DAS-2 Early Years as a measure of intellectual ability at Time 3. While Time 1 and Time 2 used the MSEL as a measure of developmental and cognitive ability, it was not appropriate to use at Time 3 given that participants were older and may hit the ceiling of the MSEL without providing a true representation of their abilities. The DAS-2 has a wider age-range for administration and provides a IQ score rather than a developmental quotient (DQ) and thus may be more representative of the child’s true abilities. The DAS-2 provides a Verbal IQ, Nonverbal IQ, Spatial IQ, and General Conceptual Ability (GCA). Overall, the children seen at Time 3 and included in the present study were in the average range for intellectual ability (GCA M=101.91, SD=15.99) indicating that across all participants, the majority were in the average range of functioning suggesting that this sample of children with ASD is considered “high-functioning.”
above and beyond scores from the ADOS-2. Because the ADOS-2 is only 45-60 minutes of a child’s behavior, it may not truly capture many RRBs that occur in other environments. The RBS-R allows for further assessment of RRBs across environments based on parent report. Treatment
After Time 1, participants were randomized to participate in a specific treatment called Adapted Responsive Teaching (ART) or participated in community Services as Usual (SAU) for 6 months (see Baranek et al., 2015 for description of ART from a pilot study). ART is a home-based intervention that works with parents and their young children using a responsive teaching curriculum. The 2 primary goals of ART were related to social-communication and sensory regulatory behaviors. For each goal, different behaviors were targeted using
strategies across 5 domains (reciprocity, contingency, control, affect, and match). Of the children participating in the current study, seen at time 3, 61.7% (n=29) participated in ART and 38.3% (n=18) received SAU. There were no main effects of ART for social
communication, sensory-regulatory, or adaptive behaviors (Watson et al., in preparation) in the larger study (e.g., 29 receiving ART; 19 receiving SAU). However, given that treatment was provided during the ages in which the present study examined developmental
CHAPTER 3: Results Data Analysis Plan
Descriptive and preliminary analyses were conducted using Statistical Package for Social Science Version 23.0 (SPSS; IBM, 2015). To more thoroughly examine the competing theories on the role of social motivation and attention in predicting ASD symptom severity, two path analyses were conducted using MPlus 7 (Muthén & Muthén, 2012). The models used a maximum likelihood estimation. Model fit was determined using several specifiers including Chi Square Test of Model Fit, the Root Mean Square Error of Approximation (RMSEA), the Comparative Fit Index (CFI), and Tucker Lewis Index (TLI). RMSEA values less than .05 and CFI and TLI values greater than 0.9 are considered to be excellent fit (Kelloway 2015; Tabachnick & Fidell 2013).
and Time 1 Looking at People) was included in the model (solid arrows in Figure 1). Preliminary analyses were conducted to determine the relationship between RRBs and attention shifting as the Attention Theory assumes they are related to one another. If these two variables are not related to one another, then it is unlikely they are measuring the same construct and will be included in larger path analysis models simultaneously. Path analyses were conducted initially using the overall composite measure of overall attention shifting (e.g., combined social and non-social shifts). Next, models were conducted using the separate social and non-social shifting measures in order to determine whether shifting involving social information differed in its role compared to shifts that did not include social information. See Figure 1 for a schematic of the proposed analyses.
Analysis of CSBS Measures of Social Motivation and Sticky Attention Variables
data across both time points. The Total RSM consists of both RSM with Body and RSM with Objects.
Overall means at Time 1 and Time 2 for measures of Social Motivation and Sticky Attention can be seen in Table 3. Means based on diagnostic group identified at Time 3 can be seen in Table 4. Paired-samples t-tests were conducted to examine significant changes in overall group behavior from Time 1 to Time 2. Proportion of time Looking at People at Time 2 (M=9.7%, SD=4.5%) was significantly lower than at Time 1 (M=11.2%, SD=5.1%; p=.02) indicating that children spent less time looking at people at 22 months compared to 13
months of age. There was no significant change in Total Shifting and Social Shifting behavior between Time 1 and Time 2. However, non-social shifting at Time 1 (M=1.19 per min, SD=.48) was significantly lower than non-social shifting at Time 2 (M=1.43 per min, SD=.50, p=.04) suggesting that while overall shifting remained the same, children had
higher rates of attention shifting between objects at 22 months compared to 13 months of age. Both RSM with Body and Total RSM were significantly higher at Time 1 compared to Time 2 (RSM Body Time 1: M=2.78, SD=2.44; Time 2: M=1.23, SD=1.50; p<.001; RSM Total Time 1: M=5.15, SD=3.48; Time 2: M=2.92, SD=2.80; p<.001). There was no significant difference in RSM with Objects at Time 1 (M=2.38, SD=2.42) and Time 2 (M=1.69, SD=1.87; p=.24).
diagnosed with ASD did not exhibit significantly different behavior in gaze behavior, shifting, and RSM at 13 months of age (i.e., Time 1) compared to at-risk children who did not receive a later diagnosis of ASD. However, at Time 2 children later diagnosed with ASD had lower rates of total attention shifting (M= 2.67 per min, SD=.89) compared to children not receiving an ASD diagnosis (M=3.96, SD=1.04; t(37)=3.63, p=.001) and lower rates of social-only attention shifting (ASD: M= 1.43 per min, SD=.91; No ASD: M=2.46, SD=1.08; t(37)=2.95, p=.006). There were no significant group differences in non-social attention
shifting (ASD: M= 1.30 per min, SD=.34; No ASD: M=1.50, SD=.58; t(37)=1.39, p=.17) at Time 2. At Time 2, there were no significant differences in any measures of RSM behavior (all p’s>.15).
Within-group differences. Paired-samples t-tests were conducted to identify significant change in Social Motivation and Sticky Attention within each diagnostic group from Time 1 to Time 2. Results of these analyses are presented in Table 4. Notably, the ASD group showed a significant decrease in Looking at People (Time 1 M=11.1%, SD=5.8%; Time 2 M=8.3%, SD=4.7%; t(11)=2.52, p=.03) and Social Shifting across time (Time 1 M=2.31 shifts per minute, SD=1.07; Time 2 M=1.43 shifts per minute, SD=.91; t(11)=3.09,
p=.01). The No ASD group showed a significant increase in Non-Social Shifting across time
(Time 1 M=1.20, SD=.35; Time 2 M=1.50, SD=.58; t(25)=2.61, p=.02). Both diagnostic groups showed a significant decrease in RSM behavior with Body (ASD Group: t(11)=3.53, p=.005; No ASD Group: t(21)=5.38, p<.001). The ASD Group did not show a significant
change in RSM with Objects (Time 1 M=2.42, SD=2.78; Time 2 M=2.23, SD=2.68;
t(11)=.22, p=.83) but the No ASD Group had a marginally significant decrease in RSM with
Correlation Analyses. The primary variables used for the path analyses included Looking at People, Shifting including Social and Non-social Shifting, and RSM Total. Preliminary correlation analyses were conducted with only these experimental variables across both Time 1 and Time 2 in order to better understand their relationships. While several composite variables were calculated, these experimental variables extrapolated from the video coding of the CSBS were utilized in the path analyses discussed below.
Pearson correlations between variables used for later path analyses were conducted to describe initial relationships. Correlations between experimental variables at Time 1 and Time 2 are included in Table 5. Pearson correlations indicate strong positive relationships between Looking at People and Total Shifting. Lower levels of Time 1 Looking at People was associated with lower rates of Time 1 Total Shifting, r(43)=.69, p<.001, and Time 2 Total Shifting ,r(39)=.39, p=.01. That is, 13-month old infants who spent less time looking at people showed lower rates of attention shifting at both 13 and 22 months. There was a significant negative correlation between Time 1 Non-social Shifting and Time 2 Social Shifting, r(39)=-.34, p=.04, and a marginally significant negative correlation between Time 1 Non-social Shifting and Time 2 Total Shifting, r(39)=-.30, p=.06. That is, higher rates of Non-social Shifting at Time 1 were related to lower rates of Social Shifting and Total Shifting at Time 2. There is also a marginally significant negative relationship between concurrent measure of social and non-social shifting at Time 2, r(39)=-.27, p=.06, indicating that at Time 2, lower rates of social shifting were related to higher rates of non-social
shifting.
negatively correlated with Time 2 Total RSM, r(38)=-.32, p=.05. Contrary to predictions that Attention Shifting and RRBs are related constructs and both measure sticky attention, Time 1 measures of Total Shifting were not significantly correlated with Time 1 measures of Total RSM, r(40)=-.12, p=.47, nor was Time 2 Total Shifting correlated with Time 2 Total RSM, r(39)=-.17, p=.31. These effects were maintained when examining the relationship between Social and Non-social Shifting with Total RSM. See Table 5 for all correlations. Attention shifting and RSM behavior are likely not measuring the same construct of sticky attention. As a result, both measures were included in comprehensive path analyses as separate constructs.
Cognitive Ability & ADOS Symptom Severity
Independent samples t-tests indicated that at 13 months, children later diagnosed with ASD did not differ in their developmental abilities (i.e., MSEL scores) from those that did not get diagnosed with ASD. See Table 1 for all MSEL scores. At Time 2, those later diagnosed with ASD had significantly lower Fine Motor Skills, t(41)=3.02, p=.004, and Expressive Language Skills, t(41)=3.11, p=.03, compared to those that were not later diagnosed with ASD. At Time 2, children later diagnosed with ASD also exhibited
significantly more symptoms related to ASD as measured by the ADOS compared to those not later diagnosed with ASD (all ps<.01).
At Time 3, children diagnosed with ASD were not significantly different from those without ASD on measures of cognitive ability measured by the DAS-2. As expected, children with ASD at Time 3 exhibited significantly more ASD symptoms as measured by the
based on the ADOS-2. It should be noted that ADOS-2 comparison scores were not normally distributed given that the majority of participants did not meet criteria for ASD. As a result, 60% of participants had ADOS-2 severity scores of 3 or less while 40% had scores of 4 or above. Total scores from the RBS-R indicate that children with ASD also exhibited more RRBs based on parent report compared to those without ASD (ASD=30.31; No ASD=10.47; t(41)=-3.74, p=.001). Children diagnosed with ASD presented with significantly more ASD
symptoms in a clinical setting based on behavioral measures as well as at home and in the community based on parent report.
Pearson correlations were conducted between measures of cognitive ability and ASD symptoms at Time 1, Time 2, and Time 3 to better understand their relationship across early development. For all correlations, see Table 6. Measures of developmental and cognitive ability were positively correlated between Time 1, Time 2, and Time 3. ADOS comparison scores at time 3 were significantly correlated with cognitive ability as measured by the MSEL at time 1 ,r(40)=-.32, p=.04, and time 2, r(40)=-.61, p<.001. That is, more impaired cognitive ability at 13 and 22 months was related to higher ASD symptoms in preschoolers. Similarly, Time 2 MSEL was also significantly negatively correlated with concurrent ADOS scores, r(44)=-.43, p=.004.
Simple linear regressions were then conducted to better examine the effects of cognitive ability on ASD symptoms with Time 3 ADOS symptom severity as the dependent variable and cognitive measures from Time 1, Time 2, and Time 3 as the predictor variables. Time 1 MSEL independently significantly predicted Time 3 ADOS symptom severity, F(1,38)=4.40, p=.04, with an R2
of .10. Time 2 MSEL independently significantly predicted Time 3 ADOS symptom severity, F(1,38)=22.99, p<.001, with an R2
symptom severity scores increased .83 points for every 10 point decrease in Time 2 MSEL standard score. Finally, DAS-2 GCA scores did not significantly predict Time 3 ADOS scores, F(1,38)=.52, p=.48. These findings suggest that early assessments of cognitive ability were significantly predictive of later ASD symptom severity while concurrent measures of intellectual ability during the preschool years were not predictive of ASD symptoms.
Treatment. Possible effects of ART treatment were examined as part of an
exploratory analysis to determine whether treatment significantly predicated ASD symptoms or diagnosis. If so, ART treatment group should be used covariate in the larger path analyses to control for a possible confound between children who received and did not receive
treatment throughout the course of this project.. In the No ASD group, 18 participants received ART treatment and 12 participants received no treatment (SAU group). In the ASD group, 7 children received ART treatment and 6 children did not (SAU group). Time 3 ADOS severity scores were not significantly predicted by treatment group, F(1,38)=.05, p=.83. Similarly, Time 3 categorical diagnosis of ASD vs. no ASD was not significantly
different based on treatment group, χ2(1)=.14, p=.71. In addition, there were no significant differences by treatment group for any Time 2 variables related to Looking at People, Attention Shifting, or RSM Behavior (ts<1; all ps>.48). As a result, treatment group was not included as a covariate in all other analyses including path analyses.
ART treatment did not significantly predict Time 2 measures of Social Motivation and Sticky Attention after entering Time 1 variables. Beta coefficients for treatment group after Time 1 variables were entered were as follows: Looking at People β=.003, t=.03 p=.97; Total Shifting β=-.13, t=-.83 p=.41; Social Shifting β=-.12, t=-.87 p=.39; Non-social Shifting β =-.08, t=-.53 p=.599; Total RSM β=.03, t=.21 p=.83. In sum, participation in treatment did not influence the change in Social Motivation and/or Sticky Attention between 13 and 22 months of age.
Gender and Race. In addition to cognitive ability and treatment, both gender and race were assessed as possible covariates. Time 3 ASD symptom severity was not
significantly different between gender, F(1,38)=1.14, p=.29; nor was Time 3 categorical diagnosis of ASD vs. no ASD significantly different for gender, χ2(1)=.76, p=.38. For race, there was a significant difference when all participants were included, F(3, 36)=3.86, p=.02. However, this is likely due to an outlier, wherein one race-group had only one participant with a very high comparison score (ADOS Symptom Severity=10). When this participant was excluded from the analysis, there was no difference in ASD symptoms severity or categorical diagnosis of ASD based on race, F(2, 36)=2.03, p=.15, χ2(3)=2.43, p=.49, respectively. It is unlikely that the child’s race was related to their ASD symptom severity and, a more parsimonious interpretation is the small sample size. As a result, race was not included as a covariate in the following path analyses.
Analysis of CSBS Variables, Cognitive Ability, and ASD Symptoms