Potential Impacts of Future Climate Change and Emission on the
1
Fate and Transport of PFOS in the Bohai Rim, China
2
Chao Su a, b, Shuai Song a, Yonglong Lu a*, Baninla Yvette a, b, Shijie Liu a , John P. Giesyc, 3
Deliang Chend, Alan Jenkinse, Andrew Sweetmane,f 4
5
a State Key Laboratory of Urban and Regional Ecology, Research Center for Eco-Environmental
6
Sciences, Chinese Academy of Sciences, Beijing 100085, China 7
b University of Chinese Academy of Sciences, Beijing 100049, China
8
c Toxicology Centre and Department of Veterinary Biomedical Sciences, University of
9
Saskatchewan, Saskatoon, Saskatchewan, Canada 10
dDepartment of Earth Sciences, University of Gothenburg, 405 30 Gothenburg, Sweden
11
eCentre for Ecology & Hydrology, Wallingford, OX 10 8BB, UK
12
fLancaster Environment Centre, Lancaster University, Lancaster LA1 4YQ, UK
13
14
Corresponding author: 15
*Yonglong Lu 16
Tel: 86-10-62915537 17
Fax: 86-10-62918177 18
E-mail: [email protected] 19
20
Abstract:
21
Both climate change and contaminant emission rate are expected to affect the transport and fate of 22
POPs. However, studies on their integrative impacts are fewer. This study, taking Perfluorooctane 23
Sulfonate (PFOS) as an example, explored how future climate change and contaminant emission 24
affect the fate of POPs synthetically, as well as urbanization rate being taken into account, using 25
BETR-Urban-Rural (BETR-UR) model, an improved BETR model. The results suggested that 26
being predominant factors, by the following aspects: advection processes, degradation rate, and 28
intermedia transfer processes. Under the “business-as-usual” emission scenario, for most grids, a 29
remarkable decline in PFOS concentration was observed in fresh water and urban soil in the future, 30
particularly in the late 21st century, while coastal water and rural soil displayed an opposite 31
changing trend. Besides, under the integrative effects of reducing emission and climate change 32
scenarios, PFOS concentrations in each compartment decreased sharply over time. Additionally, 33
we discussed the influences of climate change on the fluxes of PFOS to the Bohai Sea. Total sum 34
of emissions increased by 1.61%, 11.80%, 17.04% with increasing precipitation, and sinks by 35
2.59%, 14.30%, 22.24% due to volatilization and degradation flux in 2035, 2065, and 2100, 36
respectively. However, the sum of the emissions was always more than the sum of the sinks in 37
Bohai Sea. The coastal or marine ecosystem should be given greater consideration in the future. 38
This suggests that future assessment of climate change impacts on POPs fate should take emission 39
reduction into consideration. 40
Keywords: climate change, emission rate, urbanization, PFOS fate, multimedia model, regional 41
scale 42
1. Introduction
43
Persistent organic pollutants (POPs) are a kind of pollutants with the following properties: 44
persistence, toxicity, and long-range atmospheric transport (LRAT). Due to these properties, 45
particularly the LRAT resulting in dispersed contamination far from source regions, the fate and 46
behavior of POPs have captivated increasing concern from international environmental 47
organizations, governments, academics, and the public. Many researches showed that the fate and 48
behavior of POPs have been affected by various factors, e.g. emission rate, environmental 49
parameters such as temperature, rain rate, and soil solids organic carbon fraction. (Prevedouros et 50
al., 2004a; Prevedouros et al., 2004b). Climate change is having far-reaching effects on the 51
environment and then on the fate of POPs, not only impacted by and impacting on natural 52
processes within the climate system itself, but also anthropogenic activities (e.g., increased 53
emissions of greenhouse gases) (Paul et al., 2012). Direct changes such as temperature rise, and 54
ocean current patterns, hence resulted in those indirect changes such as land cover changes. 56
In general, the influencing mechanism of climate change on the environmental behavior and 57
fate of POPs could be described from three aspects. Firstly, it is likely to influence the 58
environmental behavior of POPs by enhancing the volatilization from primary and secondary 59
sources, by influencing their partitioning between soil, sediment, water, and atmosphere, including 60
air-surface exchange, wet/dry deposition, and reaction rates (Teran et al., 2012). Secondly, it could 61
change the solubility of chemicals, and consequently change their concentration and activity in the 62
environment. Then, it could affect the decomposition rate of POPs in the environment (Zhou and 63
Ma, 2013). However, our understanding of these mechanism is mostly qualitative, and a more 64
quantitative description of potential effects is needed (Woehrnschimmel et al., 2013). Recently, a 65
few studies have explored the effects using models under climate change scenarios quantitatively 66
(Gouin et al., 2013; Lamon et al., 2009; Ma and Cao, 2010; Paul et al., 2012). Lamon et al. studied 67
fate and transport of PCBs under a realistic climate change scenario using global multimedia 68
model under steady state (Lamon et al., 2009). On regional scale, Paul et al. and Henry et al. 69
explored the potential implications of future climate and land-cover changes for the fate and 70
distribution of POPs in Europe and Arctic, respectively (Paul et al., 2012; Woehrnschimmel et al., 71
2013). The common modeled results showed that the effect of climate change on environmental 72
concentrations of POPs was typically up to factors between 1.5 and 2.5 even up to 4 in modeled 73
concentrations. While, PCB 153 displayed a change with the most reduction in burden of up to 40% 74
in some Mediterranean compartments in Europe (Paul et al., 2012). However, the researches 75
combining climate change and emission rate to study the integrated effects are fewer. 76
The objective of this study is to explore how climate change (temperature, precipitation, wind 77
speed, soil carbon stock, and sea-level rise) and emission rate affect the fate of perfluorooctane 78
sulfonate (PFOS), as well as the urban-rural disparities, with a facus on Bohai Rim in China. In 79
this study, the Berkeley-Trent-Urban-Rural (BETR-UR) model was used to run the simulations 80
under the three climate change scenarios (B1, A1B, and A2) in IPCC 2007 and four emission 81
scenarios for three 20-year periods throughout the 21st century (2016-2035, 2046-2065, and 82
2081-2100), relative to the baseline simulation of 2010. Then, it explored the key affecting factors 83
of PFOS, and analyzed the alterations of mass fluxes of PFOS to the Bohai Sea under climate 84
and ecosystem protection. 86
2. Methods and Materials
87
2.1 Model description and study area 88
Within the original BETR model based on fugacity concept (Mackay, 2001), a connected 89
system of nine discrete and homogeneous compartments is considered as one segmentation (or 90
grid). BETR model has been successfully applied to model the multimedia fate of chemicals, 91
including the North America (MacLeod et al., 2001; Woodfine et al., 2001), Europe (Prevedouros 92
et al., 2004a; Prevedouros et al., 2004b), and the global environment (MacLeod et al., 2005). The 93
BETR-UR model is an improved BETR model (Song et al, 2016). It takes the effects of 94
urbanization into account, dividing the soil and lower air compartments into urban soil and rural 95
soil, lower urban air and lower rural air, respectively. The urban areas mainly indicated those areas 96
with high population density, including industrial land, built-up land, commercial districts, urban 97
residential areas, municipal land for public facilities, and their buffers. Except for urban areas, we 98
defined rural areas as a combination of rural villages, agricultural land, grassland, forest land, rural 99
residential areas, unused land and so on (Wang et al., 2010). The framework of BETR-UR model 100
is illustrated in Fig. 1. In the BETR-UR model, the environment within each segment contains 101
nine compartments. Specific environmental parameters for an urban area like urban perimeter, 102
urban-rural atmospheric mixing rate, freshwater area of urban area etc. and transfer processes 103
between urban and rural area were also improved. More materials could be found in (Song et al., 104
106
Fig. 1 Contaminant transportation processes in the region i linked with j in the BETR-UR 107
model. 108
The Bohai Rim, including part of Bohai Sea and its surrounding area, is one of the most 109
prosperous regions in China. In this paper, the study area included Beijing, Tianjin, Liaoning, 110
Hebei and Shandong provinces and municipalities. A wide range of industries are distributed in 111
this region, including textile treatment, metal plating, production of firefighting chemicals and 112
semiconductor industries, some of which are associated with industrial sources of PFOS and 113
related substances in China (Xie et al., 2013b). Rapid urbanization and industrial development 114
have caused great increase in energy consumption and pollutants emission, further leading to 115
multiple environmental problems. 116
Fig. 2 Study area and model segmentation. 118
The longitude of Bohai Rim is from 116°E to 124°E, and the latitude is from 36°N to 43°N. 119
It is divided into 56 grids by 1°×1° (Fig. 2). For the study area, each grid contained 8 120
compartments which are lower rural air, lower urban air, rural soil, urban soil, fresh water, fresh 121
water sediment, coastal water, and vegetation. The effects of upper air were ignored as the 122
influence of long-range air transport within this region was considered to be limited. The 56 123
sub-grids are linked by advection of air, fresh water and coastal water between adjacent segments, 124
and the runoff of fresh water to coastal water was also considered. 125
2.2 Physico-chemical properties of PFOS 126
PFOS, as one of the most abundant old-generation members of PFAS family, is a kind of 127
emerging POPs, and is one of the pollutants that are most difficult to degrade. PFOS and related 128
substances are synthesized chemicals manufactured for their desirable properties of chemical 129
stability, high surface activity, and water and oil repellence (Giesy and Kannan, 2001, 2002). 130
China began to produce PFOS-based products at a large scale in 2004, and the annual production 131
of PFOS-related chemicals grew rapidly from 2003 to 2011 (Xie et al., 2013a). The 132
physical-chemical properties of PFOS included in the BETR model are listed in Table 1 (Liu, 133
2014). Additionally, in view of both hydrophobic and hydrophilic properties of PFOS (Brooke et 134
al., 2004), improvements were made to the calculation of PFOS partition coefficient duo to the 135
influence of water salinity on the sorption behavior. Full details are available in the study by (Liu 136
et al., 2015). 137
Table 1 Physico- chemical properties of PFOS 138
Properties MW M.P. Solub V.P. Log(KOW) Log(KOA) τ1/2 LA
PFOS 538.54 400.00 519.00 3.31E-04 4.88 11.73 265500
Properties τ1/2 Soil τ1/2 Veg. τ1/2 FW. τ1/2 CW. τ1/2 Sed. E.P. E.S.
PFOS 100000000 265500 5500000 5500000 17000000 50000 -20000
Notes: molar mass (MW, g/mol), melting point (M.P., ), aqueous solubility (Solub, g/m3), vapor
139
pressure (V.P., Pa), lower air reaction half-life (τ1/2 LA, h), soil reaction half-life (τ1/2 Soil, h),
140
vegetation reaction half-life (τ1/2 Veg., h), fresh water reaction half-life (τ1/2 FW., h), coastal water
reaction half-life (τ1/2 CW., h), sediment reaction half-life (τ1/2 Sed., h), enthalpy of vaporization
142
from water to air (E.P., J/mol) and enthalpy of solution from octanol to water (E.S., J/mol). 143
2.3 Emission scenarios 144
According to the methodology and emission inventory developed by our research group (Xie 145
et al., 2013a; Xie et al., 2013b), spatially distributed emissions of PFOS and its related 146
substances were estimated for the study area in 2010, which was under the hypothesis that all 147
PFOS related substances immediately degraded to PFOS (Liu et al., 2015). In this study, four 148
different future emission scenarios were proposed for the three 20-year periods to the year 2100. 149
The emission scenario 1 is called “business-as-usual (BAU)” scenario, under the assumption that 150
annual PFOS emission continues in the future till 2100. Since PFOS and its related substances 151
were listed in Stockholm Convention on POPs in 2009, the production of PFOS-related chemicals 152
fluctuated and stabilized at around 250 t/a in China from 2009 (Xie et al., 2013b). So the PFOS 153
emission till 2100 was assumed to be the same as in 2010. This is also a reference scenario in 154
order to explore the effects of climate change. Under this assumption, the emissions to each 155
compartment including fresh water, urban soil, rural soil, urban air, and rural air kept constant. 156
The reason for this assumption is that, it is easier to manage and implement the pollution control 157
measures in urban areas even if the population and land-use area of urban areas would increase till 158
2100. For rural areas, even though the population and land-use area would decrease by time (more 159
details are referred to Section 2.4), along with the shift of industrial development from urban to 160
rural areas and the improvement of people’s living standard, the industrial and domestic emissions 161
would almost continue. 162
The emission scenarios 2, 3, and 4 are on the hypothesis that China would begin to phase 163
out PFOS and similar chemicals, and use alternatives fully by 2030, 2050, and 2100, respectively, 164
in compliance with the international treaties and national regulations. It is assumed that the PFOS 165
emission would linearly decrease to zero from 2016 until the year of withdrawal. Since the 166
Chinese government set a series of regulations on the production and use of PFOS in 2014 to 167
abide to the Stockholm Convention, thus encouraging the development of alternatives, while it did 168
withdrawal year, releases will not be suddenly stopped because of applications by secondary users. 170
For all secondary users (metal plating, firefighting, textile, semiconductor, and domestic users), a 171
worst-case situation is given in which the storage of each one was within its shelf life and all 172
expired products would be treated on time. Hence, emissions from storage of secondary products 173
would continue being released during shelf-life period. Remarkably, there are some differences 174
between industrial sectors and domestic users in the future emission. For industrial sectors, taking 175
fire-fighting sector as an example, the shelf life of products is 5 years, then the releases would be 176
as the same as the previous for 5 years. For domestic applications, releases would be assumed to 177
reduce linearly as products come to the end of their natural life. For example, carpets are in use for 178
an average of about 10 years, releasing one tenth of their treatment each year until eventual 179
disposal (Paul et al., 2008). In addition, PFOS-polymers released from textile processes would 180
degrade after 30 years, because the half-life of PFOS-polymers is longer and even more than 30 181
years, and the transforming factor was 0.3 (Brooke et al., 2004). Finally, the future simulations of 182
the three 20-year periods were under the annual mean emission of each period. The estimated total 183
emissions of PFOS and their compartment distributions for the four scenarios are listed in Table 184
S1. 185
2.4 Brief introduction to climate change and urbanization scenarios 186
The following changes were implemented for each climate change scenario (Special Report 187
on Emission Scenarios (SRES) B1, A1B, and A2 in IPCC 2007): precipitation, temperature, 188
sea-level rise, soil carbon stock, and wind speed. The SRES scenarios explore alternative 189
development pathways, covering a wide range of demographic, economic and technological 190
driving forces and resulting greenhouse gas emissions. B1 describes a convergent world, a global 191
population that peaks in mid-century, but with more rapid changes in economic structures toward 192
a service and information economy. The A1B assumes a world of very rapid economic growth, a 193
global population that peaks in mid-century and rapid introduction of new and more efficient 194
technologies but a balance across all sources. A2 describes a very heterogeneous world with high 195
population growth, slow economic development and slow technological changes. The global 196
3.4 for those three scenarios, respectively. More introductions about SRES B1, A1B, and A2 198
could be found in IPCC Climate Change 2007 Synthesis Report (IPCC, 2007). In this paper, the 199
climate change scenarios were referred to some literatures focused on China of which the results 200
were based on IPCC 2007. More details are as follows. 201
l Precipitation
202
Gridded 10-year averaged precipitation rates in the study area were extracted from (Zhang et 203
al., 2012) for the periods 2016-2035, 2046-2065, and 2081-2100 (short of 2035, 2065, 2100 the 204
following, also called early, mid, and late 21st century respectively). Precipitation was projected to 205
increase over the study area by 3%-9% (10 yr)-1, 7.5%-18% (10 yr)-1, and 9%-18% (10 yr)-1 206
respectively, under all three scenarios for the three periods. 207
l Temperature
208
The same process was repeated for surface air temperature (Zhang et al., 2012). The warming 209
rate was projected to increase over the study area by 0.2-0.6 (10 yr)-1, 0.3-0.6 (10 yr)-1, and 210
0.1-0.6 (10 yr)-1 respectively, under all three scenarios for the three periods. Additionally, the 211
significant feature of urbanization is “urban heat island effect”, and the temperature difference 212
between urban and rural area was 2-6 (Martine and Marshall, 2007). Hence, this effect was 213
taken into account in the BETR-UR model, and it was assumed to be 4 for that difference. 214
l Sea-level rise
215
The mean rate of averaged sea-level rise in China was 3.0 mm yr-1 between 1980 and 2014. It
216
was inferred that the sea-level of Bohai Sea in the early 21st century was 0.045 m higher than that
217
in 2010 for all three scenarios (China Sea Level communique 2014). The sea-level rise in mid and 218
late 21st century was referred to the global mean data in IPCC AR5, being 0.26 m, 0.25 m, 0.30 m
219
and 0.47 m, 0.48 m, 0.63 m higher under three scenarios, respectively (IPCC, 2014). 220
l Soil carbon stock
221
The simulated averaged soil carbon stock increased by 5% for 2030s, and by 3% for 2090s 222
under scenarios B1 and A2 for northeastern China (Peng et al., 2009). Hence, it is assumed that it 223
increased by 4% for the 2060’s under those two scenarios. Furthermore, since scenario A1B is a 224
moderate one between B1 and A2, we supposed that projected averaged soil C stock had the same 225
growth with those two scenarios. Additionally, a study showed that soil carbon stock was about 226
(Tao et al., 2015), which was taken into consideration in the model. 228
l Wind speed change
229
A study using all climate model predicted that the annual mean wind speeds in China for the 230
21st century varied slightly under all three scenarios (Jiang et al., 2010). It was projected that mean 231
wind speed increased 0-1 m/s under the three scenarios for the early, mid and late 21st century in
232
the northern part of Northeastern China, middle reaches of the Yellow River and southwest of 233
Tibetan Autonomous Region. Moreover, it increased a little more under scenario A2 than the other 234
two scenarios, and it also increased more in the mid and late 21st century than the early 21st 235
century (Jiang et al., 2010). In this paper, we considered that it had a similar change pattern in the 236
Bohai Rim and northern part of Northeastern China, middle reaches of the Yellow River. 237
Besides, rainfall-runoff relationship and urbanization rate projections were analyzed. The 238
former was referred to the regression model relating mean annual runoff to mean annual 239
precipitation and mean annual temperature by (Chen and Wang, 2004). Rapid urbanization is one 240
of the outstanding features in China, particularly in coastal regions, and China is now at the peak 241
of its urban transition, where rural-urban migration has been a much more important contributor to 242
the growth (Martine and Marshall, 2007). Urban form and function also help define the nature of 243
the interactions between cities and local climate change. For example, the “urban heat island effect” 244
resulting from the impacts of different land uses in urban areas, creates microclimates and health 245
consequences. The size of the urban center, the type of urbanization, urban form, function and 246
land use all contribute to the effect. As villages grow into towns and then into cities, their average 247
temperature increases from 2 to 6 °C above that of the surrounding rural areas (Martine and 248
Marshall, 2007). Since the percentile urbanization trend of Asia from 2000 to 2050 was almost 249
consistent with the curve of urban percentage of Europe from 1950 to 2000, we therefore, assumed 250
that the rate of urbanization of China from 2051 to 2100 was likely the same as that of Europe 251
from 2000 to 2050 (Das Gupta et al., 2014). 252
3. Results and discussion
253
3.1 Model output and validation 254
scenario for each emission scenario. The previous research showed that soil, coastal water, fresh 256
water, and sediment were the top four sinks for PFOS, and the storage in air and vegetation was 257
less than 1.00 %. Consequently, the concentrations and transfer process in urban soil, rural soil, 258
coastal water, fresh water, and sediment were mainly analyzed in the results of this study. The 259
median values of modeled PFOS concentrations in 2010 in fresh water, sediment, urban soil, and 260
rural soil were 8.27 ng/L, 0.38 ng/g, 0.26 ng/g, and 0.11 ng/g, respectively. Additionally, model 261
accuracy was assessed by comparing simulated baseline PFOS concentrations with measured data 262
in fresh water, fresh water sediment, urban soil, and rural soil in the study area (Table S1). 263
Available measured data for PFOS concentrations around the year 2010 were collected from 264
published sources, mostly by our research group (Li et al., 2011; Meng et al., 2015; Wang et al., 265
2014; Wang et al., 2015; Yang et al., 2011; Zhao et al., 2014; Zhao et al., 2013; Zhu et al., 2014). 266
The results showed that the range of simulated concentrations were generally well consistent with 267
the measured data for all the compartments. 268
3.2 Spatially projected concentration changes of PFOS 269
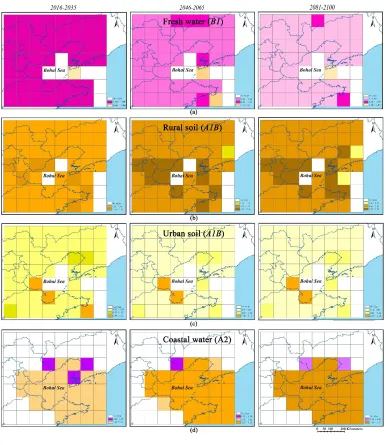
271
Fig. 3 Projected changes of PFOS concentrations in fresh water, rural soil, urban soil and 272
coastal water under specific climate change scenario for emission scenario 1. 273
274
Ratio of projected period concentration and baseline concentration was used to describe the 275
change of PFOS concentration in this study. 276
Concentration changes of PFOS for fresh water, coastal water, urban soil, and rural soil under 277
three future climate change scenarios and four emission scenarios were listed in Table S3. It 278
showed that there were similar changing trend for those four compartments among three climate 279
change scenarios B1, A1B and A2 under each specific emission scenario. Fig. 3 showed the 280
projected changes of PFOS concentrations in those four compartments under specific climate 281
concentration in the future simulations was observed in fresh water and urban soil (except for 283
some grids). Taking grid 26 (Haihe River in Tianjin City) as an example, the concentration ratios 284
in the early, mid, and late 21st century for fresh water were 0.9616, 0.5394, 0.2772, and for urban
285
soil were 0.8708, 0.7530, 0.7533 under climate change scenario B1. And under scenarios A1B and 286
A2, fresh water concentration ratios were 0.9414, 0.4849, 0.2529 and 0.9750, 0.5203, 0.3179 in 287
the future three periods, the urban soil concentration ratios were 0.8698, 0.7515, 0.7546 and 288
0.8693, 0.7504, 0.7537 in the future three periods, respectively. Fresh water was observed with the 289
most rapid decline. The key reason for that was the increased runoff with increasing precipitation 290
even though it brought the PFOS in air to aquatic and terrestrial ecosystems through wet 291
deposition and rain dissolution with the increasing precipitation. According to the regression 292
relationship between runoff and precipitation, temperature (Chen and Wang, 2004), the runoff 293
increased a lot, particularly for the mid, and late 21st century, with a value by 5%, 25%, 32% in the 294
future three periods, respectively, under scenario B1. On the other hand, warming water would 295
reduce the solubility of PFOS (Zhou and Ma, 2013). For the urban soil, it might be because the 296
industrial and domestic emissions kept constant under the assumption of industrial shift from 297
urban to rural areas and managed domestic consumptions while with the higher urbanization rate 298
and extended urban land. On the other hand, concentrations of PFOS would decline driven by 299
temperature increasing volatilization and microbial decomposition rate. And this volatilization 300
effect driven by temperature was more significant in urban areas than rural areas because of the 301
urban heat island effect. 302
On the contrary, for most grids, the concentrations of PFOS in rural soil and coastal water 303
had the opposite trends. Taking grid 26 (Tianjin City) as an example, for rural soil, the 304
concentration ratios were 1.1705, 1.3855, 1.4618 in the future three periods under scenario A1B, 305
and the ratios for coastal water were 1.0029, 1.1688, 1.2259 under scenario A2 in the future three 306
periods, respectively. For coastal water, the runoffs from fresh water to coastal water increased 307
greatly owing to the higher temperature and precipitation, with a value of 14%, 32%, and 38% in 308
the future three periods, respectively. This would bring out the accumulation of PFOS in coastal 309
water. It was consistent with that coastal water was the final sink for PFOS (Liu et al., 2015). For 310
rural soil, under the BAU emission assumption that the related domestic consumptions increased 311
2.3, it was reasonable to show a higher concentration in the future. 313
3.2.2 Projected concentration changes of PFOS under emission reduction scenarios 314
Fig. S1- S3 showed the projected changes of PFOS concentrations in fresh water, rural soil, 315
urban soil and coastal water under specific climate change scenario for emission scenarios 2, 3 and 316
4. For emission scenario 2, the PFOS concentrations in fresh water in the whole area will decreas 317
65% or above in the early 21st century. However, in the mid 21st century, there will be some 318
growth in the southern Bohai Rim comparing to the early 21st century, and for a small number of
319
grids, the PFOS concentrations are higher than 2010. This was closely related to the emission of 320
PFOS. Because in the mid 21st century, the PFOS emission will only be from textile sector, and
321
which in the grids of southern Bohai Rim is higher than the early 21st century under the 322
assumption of emission scenario 2. For rural soil and urban soil, the PFOS concentrations will 323
decrease in the early 21st century, and decrease more in the mid 21st century except for a tiny 324
number of grids. And coastal water is the final sink of PFOS, for a big number of grids, the 325
concentrations are higher than the early 21st century, even for 2010. The trends of other three 326
compartments are almost consistent with the fresh water, because fresh water is the only medium 327
of PFOS released into the environment in the mid 21st century (Fig. S1 and Table S3). 328
For emission scenarios 3 and 4, the PFOS concentrations in the four compartments will 329
reduce with the linear emission reduction over time except for a few grids. Particularly for 330
emission scenario 3, with the PFOS withdrawn in 2050, the PFOS concentrations will decrease a 331
lot in the late 21st century, by 10 to 10,000-fold (Fig. S2, S3 and Table S3). 332
3.3 Annual mass flux changes of PFOS in Bohai Sea 333
In order to explore the impacts of climate change on the fluxes of PFOS to the Bohai Sea, 334
total annual mass flux changes were discussed under emission scenario 1 and climate change 335
scenario A1B because it was a moderate choice. 336
338
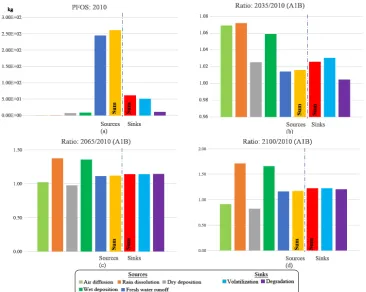
Fig. 4 Total annual mass fluxes (kg), to the Bohai Sea, sources and sinks for (a) 2010. Ratios of 339
total annual mass fluxes: (b) 2035/2010, (c) 2065/2010, and (d) 2100/2010 under scenario A1B. 340
341
Total annual mass fluxes of PFOS to the Bohai Sea for baseline 2010, and the ratios of the 342
fluxes for the years 2035/2010, 2065/2010 and 2100/2010 were presented in Fig. 4. 343
For pathways of PFOS to the Bohai Sea, rain dissolution, wet deposition, and fresh water 344
runoff all will increase somehow in the three future periods, relative to the baseline 2010. Rain 345
dissolution will be up by 7.21%, 37.39%, 71.00%, wet deposition will increase in ascending order 346
by 5.91%, 35.62%, 65.94%, while fresh water runoff will increase by 1.42%, 11.39, 16.30% in 347
2035, 2065, and 2100, respectively, relative to 2010. These changes are due to increased 348
precipitation in the future. Air diffusion and dry gas deposition firstly increase a little in 2035, 349
then decrease more in 2065 and 2100, remains lower than volatilization and degradation. For sink 350
pathways, volatilization and degradation fluxes both will increase more in the future, relative to 351
the present (2010). This is because of the increased air and water temperature and wind speed. 352
Total sum of sources will increase by 1.61%, 11.80%, 17.04%, and that of sinks by 2.59%, 353
much lower than the sum of sources to the Bohai Sea, so the sum of the sources (left side of the 355
dotted line) is always more than the sum of the sinks (right side of the dotted line), and the 356
differences between the sum of the sources and the sum of the sinks will be larger in the future. 357
This added to the evidence that PFOS concentrations in coastal water would increase more in the 358
future periods. It was inconsistent with the modeled results of γ-HCH and PCB 153 in the North
359
Sea (O’Driscoll et al., 2014). So the general result was that there were big influences of climate 360
change on the mass fluxes of PFOS to the Bohai Sea. 361
3.4 The changes of PFOS fate and transportation: taking Tianjin city as a case 362
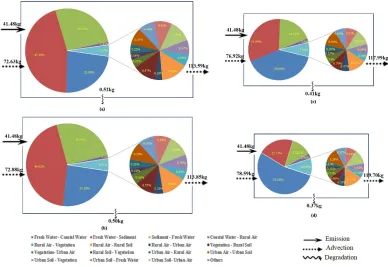
[image:16.595.112.500.294.561.2]363
Fig. 5 The changes of PFOS fate and transportation of grid 26 under emission scenario 1 and 364
moderate climate change scenario A1B : (a) baseline 2010; (b) 2016-2035; (c) 2046-2065; (d) 365
2081-2100. 366
In this part, we took grid 26 (containing the vast majority of Tianjin City) as an example to 367
analyze the impacts of future climate change (scenario A1B) on the fate and transportation of 368
PFOS in detail, including advection fluxes between adjacent grid (inflow/outflow fluxes of air), 369
degradation rate, and intermedia transportation processes (Fig. 5). Under emission scenario 1, due 370
in the mid and late 21st century, by 5.91%, 8.21% for inflow flux, and 3.87%, 5.38% for outflow 372
flux. For the not temperature dependent degradation rate, it will decline slightly with time. 373
Because the degradation rate is a complex parameter, relating to the volume of each environmental 374
compartment, PFOS concentration in each compartment, and the first-order reaction rate constant 375
(Mackay, 2001; MacLeod et al., 2001). The value in Fig. 5 was the sum of all environmental 376
compartments, hence, its reduction was maybe closely linked with the decrease of PFOS 377
concentration in fresh water, fresh water sediment, urban soil, volume of rural soil, and rural air. 378
For the intermedia transportation processes, we could see that from fresh water to coastal 379
water, fresh water to sediment, sediment to fresh water, and coastal water to rural air were the four 380
predominant transfer ways among all transfer processes (Fig. 5). Among these four pathways, the 381
transfer rate of fresh water to coastal water, coastal water to rural air increases over time, 382
particularly for the former, from 1/4 of the total in 2010 to more than half in the late 21st century. 383
It is because of increased runoffs from fresh water to coastal water led by more and more 384
precipitation in the mid and later 21st century. For the transfer rate of coastal water to rural air, it is 385
driven by temperature increasing volatilization. The transfer rate of the other two predominant 386
pathways will reduce much in the future, especially in the mid and late 21st century, decreasing by
387
5.62% - 74.55% for fresh water to sediment, and 5.73% - 74.62% for sediment to fresh water, in 388
the future (Fig. 5). According to the transfer principle between fresh water and sediment, along 389
with the concentration reduction in fresh water, the concentration in sediment will also decrease, 390
as well as the transfer rate between them. 391
4. Conclusion
392
This paper explored the potential integrative effects of future climate change and emission 393
rate on the fate and transportation of PFOS in the Bohai Rim of China using BETR-UR model, 394
taking the effects of urbanization into consideration at the same time. Our results suggested that 395
wind speed, degradation rate, and intermedia transfer processes affect PFOS advection processes. 396
Under the influences of climate change (including temperature, precipitation, wind speed, 397
sea-level rise, and soil carbon stock) and urbanization, the projected concentrations of fresh water 398
in fresh water and urban soil. These reductions were predicted to result from increased 400
temperature, precipitation, and urbanization. While that of coastal water and rural soil displayed 401
an opposite trend, which would bring out more adverse effects and risk on organisms, particularly 402
for marine ecosystem. Besides, there were big influences of climate change on the mass fluxes of 403
PFOS to the Bohai Sea. It is important to point out that these predicted changes would occur under 404
BAU emission. However, through modern, effective chemical management practices and 405
legislation, chemicals with PFOS-like properties might be effectively regulated and reduced, and 406
then concentrations of PFOS in each compartment would sharply decline and lower the risk on 407
ecosystems. It suggests that in the future emission reduction policy-making process, climate 408
change mitigation and adaptation should be taken into serious consideration, as well as 409
urbanization planning. 410
411
Acknowledgement 412
This study was supported by the International Scientific Cooperation Program with Grant No. 413
2012DFA91150, the National Natural Science Foundation of China under Grant No. 414
414201040045 and No. 41371488, and the Key Project of the Chinese Academy of Sciences under 415
Grant No. KZZD-EW-TZ-12. We would like to thank the editors and reviewers for their valuable 416
comments and suggestions. 417
References 418
China Sea Level communique 2014. China Sea Level communique. China Oceanic 419
Administration. 420
Brooke, D., Footitt, A., Nwaogu, T., 2004. Environmental risk evaluation report: 421
Perfluorooctanesulphonate (PFOS). Environment Agency Wallingford. 422
Chen, L., Wang, H., 2004. Sensitivity of Runoff to Climate Change in Small Drainage Basins in 423
China. Resources Science 26, 62-68. 424
of the 1.8 billion, ADOLESCENTS, YOUTH AND THE TRANSFORMATION OF THE 426
FUTURE, State of world population, 2014. UNFPA, https://www. unfpa.
427
org/sites/default/files/pub-pdf/SWOP. 428
Giesy, J.P., Kannan, K., 2001. Global distribution of perfluorooctane sulfonate in wildlife. 429
Environmental science & technology 35, 1339-1342. 430
Giesy, J.P., Kannan, K., 2002. Peer reviewed: perfluorochemical surfactants in the environment. 431
Environmental science & technology 36, 146A-152A. 432
Gouin, T., Armitage, J.M., Cousins, I.T., Muir, D.C., Ng, C.A., Reid, L., Tao, S., 2013. Influence 433
of global climate change on chemical fate and bioaccumulation: The role of multimedia models. 434
Environmental Toxicology and Chemistry 32, 20-31. 435
IPCC, 2007. Synthesis Report. Contribution of Working Groups I, II and III to the Fourth 436
Assessment Report of the Intergovernmental Panel on Climate Change. IPCC, Geneva, 437
Switzerland. 438
IPCC, 2014. CLIMATE CHANGE 2014 SYNTHESIS REPORT. 439
Jiang, Y., Luo, Y., Zhao, Z., 2010. Projection of Wind Speed Changes in China in the 21st 440
Century by Climate Models. Chinese Journal of Atmospheric Sciences 34, 323-336. 441
Lamon, L., von Waldow, H., MacLeod, M., Scheringer, M., Marcomini, A., Hungerbühler, K.,
442
2009. Modeling the global levels and distribution of polychlorinated biphenyls in air under a 443
climate change scenario. Environmental science & technology 43, 5818-5824. 444
Li, F., Sun, H., Hao, Z., He, N., Zhao, L., Zhang, T., Sun, T., 2011. Perfluorinated compounds in 445
Haihe River and Dagu drainage canal in Tianjin, China. Chemosphere 84, 265-271. 446
Liu, S., 2014. Simulation of Spatial Explicit Multimedia Fate of POPs in Bohai Rim. University of 447
Chinese Academy of Sciences. 448
Liu, S., Lu, Y., Xie, S., Wang, T., Jones, K.C., Sweetman, A.J., 2015. Exploring the fate, transport 449
and risk of Perfluorooctane Sulfonate (PFOS) in a coastal region of China using a multimedia 450
model. Environment international 85, 15-26. 451
Ma, J., Cao, Z., 2010. Quantifying the perturbations of persistent organic pollutants induced by 452
climate change. Environmental science & technology 44, 8567-8573. 453
Mackay, D., 2001. Multimedia environmental models: the fugacity approach. CRC press. 454
atmospheric concentrations of polychlorinated biphenyls using a global-scale mass balance model 456
(BETR-Global). Environmental science & technology 39, 6749-6756. 457
MacLeod, M., Woodfine, D.G., Mackay, D., McKone, T., Bennett, D., Maddalena, R., 2001. 458
BETR North America: a regionally segmented multimedia contaminant fate model for North 459
America. Environmental Science and Pollution Research 8, 156-163. 460
Martine, G., Marshall, A., 2007. State of world population 2007: unleashing the potential of urban 461
growth, State of world population 2007: unleashing the potential of urban growth. UNFPA. 462
Meng, J., Wang, T., Wang, P., Zhang, Y., Li, Q., Lu, Y., Giesy, J.P., 2015. Are levels of 463
perfluoroalkyl substances in soil related to urbanization in rapidly developing coastal areas in 464
North China? Environmental Pollution 199, 102-109. 465
O’Driscoll, K., Mayer, B., Su, J., Mathis, M., 2014. The effects of global climate change on the 466
cycling and processes of persistent organic pollutants (POPs) in the North Sea. Ocean Sci 10, 397. 467
Paul, A.G., Hammen, V.C., Hickler, T., Karlson, U.G., Jones, K.C., Sweetman, A.J., 2012. 468
Potential implications of future climate and land cover changes for the fate and distribution of 469
persistent organic pollutants in Europe. Global Ecology and Biogeography 21, 64-74. 470
Paul, A.G., Jones, K.C., Sweetman, A.J., 2008. A first global production, emission, and 471
environmental inventory for perfluorooctane sulfonate. Environmental Science & Technology 43, 472
386-392. 473
Peng, C., Zhou, X., Zhao, S., Wang, X., Zhu, B., Piao, S., Fang, J., 2009. Quantifying the response 474
of forest carbon balance to future climate change in Northeastern China: model validation and 475
prediction. Global and Planetary Change 66, 179-194. 476
Prevedouros, K., Jones, K., Sweetman, A., 2004a. European-scale modeling of concentrations and 477
distribution of polybrominated diphenyl ethers in the pentabromodiphenyl ether product. 478
Environmental science & technology 38, 5993-6001. 479
Prevedouros, K., MacLeod, M., Jones, K.C., Sweetman, A.J., 2004b. Modelling the fate of 480
persistent organic pollutants in Europe: parameterisation of a gridded distribution model. 481
Environmental Pollution 128, 251-261. 482
Song, S., Su, C., Lu, Y., Wang, T., Zhang, Y., Liu, S., 2016. Urban and rural transport of 483
semivolatile organic compounds at regional scale: A multimedia model approach. Journal of 484
Tao, Y., Li, F., Wang, R., Zhao, D., 2015. Effects of land use and cover change on terrestrial 486
carbon stocks in urbanized areas: a study from Changzhou, China. Journal of Cleaner Production 487
103, 651-657. 488
Teran, T., Lamon, L., Marcomini, A., 2012. Climate change effects on POPs' environmental 489
behaviour: a scientific perspective for future regulatory actions. Atmospheric Pollution Research 3, 490
466-476. 491
Wang, P., Lu, Y., Wang, T., Fu, Y., Zhu, Z., Liu, S., Xie, S., Xiao, Y., Giesy, J.P., 2014. 492
Occurrence and transport of 17 perfluoroalkyl acids in 12 coastal rivers in south Bohai coastal 493
region of China with concentrated fluoropolymer facilities. Environmental pollution 190, 115-122. 494
Wang, P., Lu, Y., Wang, T., Zhu, Z., Li, Q., Zhang, Y., Fu, Y., Xiao, Y., Giesy, J.P., 2015. 495
Transport of short-chain perfluoroalkyl acids from concentrated fluoropolymer facilities to the 496
Daling River estuary, China. Environmental Science and Pollution Research 22, 9626-9636. 497
Wang, W., Simonich, S.L.M., Xue, M., Zhao, J., Zhang, N., Wang, R., Cao, J., Tao, S., 2010. 498
Concentrations, sources and spatial distribution of polycyclic aromatic hydrocarbons in soils from 499
Beijing, Tianjin and surrounding areas, North China. Environmental Pollution 158, 1245-1251. 500
Woehrnschimmel, H., MacLeod, M., Hungerbuhler, K., 2013. Emissions, Fate and Transport of 501
Persistent Organic Pollutants to the Arctic in a Changing Global Climate. Environmental Science 502
& Technology 47, 2323-2330. 503
Woodfine, D.G., MacLeod, M., Mackay, D., Brimacombe, J.R., 2001. Development of continental 504
scale multimedia contaminant fate models: integrating GIS. Environmental Science and Pollution 505
Research 8, 164-172. 506
Xie, S., Lu, Y., Wang, T., Liu, S., Jones, K., Sweetman, A., 2013a. Estimation of PFOS emission 507
from domestic sources in the eastern coastal region of China. Environment international 59, 508
336-343. 509
Xie, S., Wang, T., Liu, S., Jones, K.C., Sweetman, A.J., Lu, Y., 2013b. Industrial source 510
identification and emission estimation of perfluorooctane sulfonate in China. Environment 511
international 52, 1-8. 512
Yang, L., Zhu, L., Liu, Z., 2011. Occurrence and partition of perfluorinated compounds in water 513
and sediment from Liao River and Taihu Lake, China. Chemosphere 83, 806-814. 514
and precipitation over the globe and in China during the 21st century by the BCC Climate System 516
Model BCC_CSM1. 0. Acta Meteorologica Sinica 26, 362-375. 517
Zhao, X., Xia, X., Zhang, S., Wu, Q., Wang, X., 2014. Spatial and vertical variations of 518
perfluoroalkyl substances in sediments of the Haihe River, China. Journal of Environmental 519
Sciences 26, 1557-1566. 520
Zhao, Z., Tang, J., Xie, Z., Chen, Y., Pan, X., Zhong, G., Sturm, R., Zhang, G., Ebinghaus, R., 521
2013. Perfluoroalkyl acids (PFAAs) in riverine and coastal sediments of Laizhou Bay, North 522
China. Science of the total environment 447, 415-423. 523
Zhou, Z., Ma, L., 2013. Research advance of climate change influence on environmental behavior 524
of POPs. Environmental Pollution & Control 35, 84-87. 525
Zhu, Z., Wang, T., Wang, P., Lu, Y., Giesy, J.P., 2014. Perfluoroalkyl and polyfluoroalkyl 526
substances in sediments from South Bohai coastal watersheds, China. Marine pollution bulletin 85, 527
619-627. 528