Analysis Of Water Temperature Of Laguna Lake
Using EFDC Model
Armi M. Cunanan, Jonathan W.L. Salvacion
Abstract: Laguna Lake is one of the widely used fresh water source in Metropolitan Manila. Numerous studies have been conducted for the water quality monitoring of the lake. Large amounts of pollutants are continuously received by the lake from domestic, industrial and others sources. The physical appearance of the lake alone needs attention. Physical characteristics of water include depth, flow velocity, flow rate, temperature, turbidity and transparency is very important. The lake’s water temperature not so much given attention but affects most of the chemical and biological characteristics of water, is given focus in this study. Hydrodynamic characteristics of the lake was considered in coming up with a graphical illustration of the temperature of the Laguna Lake using the Environmental Fluid Dynamics Code (EFDC). Laguna Lake is thermally unstratified with its average depth of 3.21 and mean temperature range from 25 ºC to 29 ºC. The EFDC model used in this study could be further used to model hydrodynamic transport and be linked with Water Quality Analysis Simulation Program (WASP).
Index Terms: hydrodynamics, Environmental Fluid Dynamics Code, Laguna Lake, lake temperature
————————————————————
1
I
NTRODUCTIONLaguna Lake is the biggest lake in the Philippines and is one of the most important inland bodies of water [1] located in the southeast of Manila [2]. It is being used for several purposes such as fisheries, transport route, flood water reservoir, power generation, recreation, irrigation, industrial cooling, waste sink, and potable water since July, 2009 [3]. It has three distinct bays namely West Bay, Central Bay and East Bay. The southernmost portion is called the South Bay. The Laguna Lake or Laguna de Bay is a large shallow freshwater body with an average depth of 2.5 meters with a surface area of 911 km2, a shoreline of 220 km and a holding capacity estimated at 2.19 x10⁹m3 [1] [3]. During the months of December to February, the lowest air temperature and highest wind velocities occur in the Laguna Lake Basin resulting to water turbulence and high water turbidity. Although ample supply of free nutrients is present, low fish growth is experienced. On the months of November to April, dry season occurs. There are two climatic conditions in the Laguna Lake Basin, Type 1 and Type 4 of the Corona Climate System of Classification. There are two distinct seasons under Type 1, dry from November to April and wet from May to October; and Type 4 which is characterized by evenly distributed rainfall all throughout the year. [4] Lake temperature exerts a major influence on the biological activity of aquatic organisms since most aquatic organisms are cold-blooded or poikilothermic, and are unable to internally regulate their core body temperature [5]. A change in temperature of water bodies naturally occurs seasonally and daily. However, the fish’s ability to reproduce is affected by man made changes to the water temperature.
Changes in temperature have an effect on other water quality parameters such as alkalinity, salinity, dissolved oxygen, electrical conductivity, and the chemical and biological reactions such as solubility in oxygen, carbon-dioxide-carbonate-bicarbonate equilibrium, increase in metabolic rate and physiological reactions of organisms are likewise affected. [6]In the present study, the thermal stratification of the Laguna Lake Basin was simulated using the Environmental Fluid Dynamics Code (EFDC) using a one-meter interval of the depths of the lake. This report presents a model which simulates specifically the temperatures in the Laguna de Bay by setting the boundary conditions for the hydrodynamic model including the depth and elevation, volume of inflow and outflow, wind, temperature and atmospheric forces. The data used in the model were collected from Laguna Lake Development Authority (LLDA) and Philippine Atmospheric, Geophysical and Astronomical Services Administration (PAGASA). The model will then be used as a management tool to simulate the water quality of the Laguna Lake. The model showed that the water movement at the Manggahan is dynamic due to the 131.56 m3/sec flow of water in the area.
2.
M
ETHODSEFDC Model
EFDC Explorer (EE) is a Windows-based Graphical User Interface (GUI) for pre- and post-processing of the Environmental Fluid Dynamics Code (EFDC). The program is developed and supported by the engineering company Dynamic Solutions-International (DS-Intl). EFDC Explorer is designed to support model set-up, Cartesian and curvilinear grid generation, testing, calibration and data visualization using 2 dimensional and 3 dimensional plots and animation of model results. [7] The EFDC comprises an advanced three-dimensional surface water modeling system for hydrodynamic and reactive transport simulations of rivers, lakes, reservoirs, wetland systems, estuaries, and the coastal ocean. The modeling system was originally developed at the Virginia Institute of Marine Science as part of a long-term research program to develop operational models for resource management applications in Virginia's estuarine and coastal waters. The EFDC model is a public domain, with current users including universities, governmental agencies, and engineering consultants. [8]
_____________________
Armi M. Cunanan, Mapúa Institute of Technology,
Intramuros, Manila, Philippines, +639989900623.
E-mail: [email protected]
Jonathan W.L. Salvacion, Mapúa Institute of
Technology, Intramuros, Manila, Philippines.
Hydrodynamics
The EFDC model solves the three-dimensional, vertically hydrostatic, free surface, turbulent averaged equations of fluid with variable density. The model uses a stretched or sigma vertical coordinate and Cartesian or curvilinear, orthogonal horizontal coordinates. The hydrodynamic model also solves dynamically coupled transport equations for turbulent kinetic energy, turbulent length scale, salinity, and temperature. [9] The vertically hydrostatic momentum and continuity equations of EFDC model for turbulent flow are solved in a coordinate system which may be curvilinear and orthogonal in the horizontal and stretched or topography-free surface in vertical direction. [10] [8] EFDC uses stretch or sigma vertical coordinates and cartesian or curvilinear, orthogonal horizontal coordinates to represent the physical characteristic of a water body. [11] The momentum and continuity equations in EFDC model using curvilinear grid generation, please refer to (1): [12]
(1)
If Cartesian grid generation would be used, mx and my will be equivalent to 1 and (2) will be used.
(2)
x and y = the curvilinear-orthogonal coordinates z = vertical sigma coordinate
u and v = horizontal velocities in the curvilinear-orthogonal horizontal coordinates (x,y)
mx and my = the metric coefficients that would be calculated from dx and dy of the cells
w = vertical velocity in the stretched vertical and dimensionless coordinate z.
z,p = kinematic excess pressure above the reference density ρo = hydrostatic pressure
ρatm = kinematic atmospheric pressure φ = the free surface potential
g times z* = free surface elevation zb*= bottom bed or topography elevation H(zs* - zb*) = total water column depth f = Coriolis parameter
fe = effective Coriolis parameter incorporating the curvature accelerations
In the EFDC model, governing equations for the flow hydraulics were derived from the vertically hydrostatic boundary layer form of the turbulent equations of motion for an incompressible, variable density fluid. Error! Reference source not found., Error! Reference source not found.,
Error! Reference source not found., , Error! Reference source not found., Error! Reference source not found.. [11]
( 3) (4) (5) ( 6) (7) (8)
ρ = physical
pressure
H = ɧ+z,sum of the depth below the free surface displacement relative to the undisturbed physical vertical coordinate origin z*=0
T = temperature S = salinity
b = buoyancy defined in equation as the normalized deviation of density from the reference value
Av = vertical turbulent or eddy viscosity Qu and Qv = momentum source-sink terms Qs and Qt = source and sink terms
Ab = vertical turbulent diffusivity and vertical kinematic viscosity
Boundary Conditions for the Hydrodynamic Model
Depth and Elevation. Laguna Lake Development Authority (LLDA) together with The University of the Philippines – National Institute of Geological Science (UP-NIGS) are currently updating the bathymetry data of Laguna Lake. Bathymetry data provided by LLDA was digitized in order to generate a Cartesian grid.
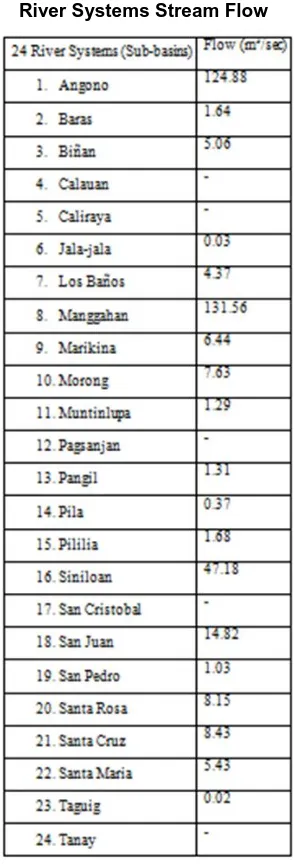
Table 1
River Systems Stream Flow
Wind, Temperature, Atmospheric Forces. Data for the Wind Velocity and Temperature were acquired from the Philippine Atmospheric, Geophysical and Astronomical Services Administration (PAGASA). Record used was the average per month from 1977 to 2003 (see
Table 2
Wind, Temperature and Atmospheric Forces Average Values (1977-2003)). The switch in wind direction is the main indicator between the cool northeast wind (hanging amihan) and the southwest monsoon (hanging habagat) [13]. From the University of the Philippines-Los Baños, Laguna (UP-LB) monitoring station, wind in Laguna Lake is dominated by northeast wind direction averaging to 2 m/sec. Atmospheric forces utilized rainfall, relative humidity, and solar radiation. Meteorological data was used to model the surface heat exchange between the water surface and the atmosphere in the Laguna Lake EFDC model. The following are the meteorological parameters required for the EFDC model: atmospheric pressure in millibars (mb), solar radiation in watts per square meter (W/m2), evaporation in meters per day
(m/day), relative humidity and cloud cover in fraction, dry bulb temperature in degrees Celsius (ºC), wind speed in meter per second (m/s), and wind direction.
Table 2
Wind, Temperature and Atmospheric Forces Average Values (1977-2003)
3.
M
ODELINGStudy Area
Laguna Lake is shaped like a stylized ―W‖ with two peninsulas jutting out from the northern shore. Between these peninsulas, the middle lobe fills the large volcanic Laguna Caldera. In the middle of the lake is the large island of Talim, which falls under the jurisdiction of the towns of Binangonan and Cordona in Rizal Province. The lake is one of the primary sources of freshwater fish in the country and its water drains to Manila Bay via the Pasig River. [14]
The total inflow in the lake is about 178.8m3/s (6,265mm). The highest inflow contributor is the river discharge at 125m3/s (4,380mm), direct rainfall at 38m3/s (1,332mm) and groundwater influx at 15.8m3/s (554mm). The total outflow from the lake is about 181.5 m3/s (6,630mm). The highest component of the outflow of the river is the Pasig River outflow at 150m3/s (5,256mm), evaporation rate at 29 m3/s (1,016mm) and consumptive water users of some such as irrigation, water supply at 2.6 m3/s (88mm). The change in storage in the lake is quite insignificant since the reduction is only about 2.7 m3/s (88mm). It may increase or decrease in a yearly basis depending on the hydro-climactic condition of the basin. [15]
Computational Domain and Mesh Generation
Topographic and bathymetric data from Laguna Lake Development Authority (LLDA) was used to develop an Environmental Fluid Dynamics Code (EFDC) model. Using the cartesian grid generation, resolution used for the computational domain (dx,dy) was 300mx300m, the horizontal domain contains 137 cells in the i-direction and 158 cells in j-direction. Total active cells counted up to 9889. 23 river systems (excluding Marikina River), ground water, power generation, and irrigation were considered inflows. Pasig River is the major outflow contributor of the lake. The horizontal and vertical model grids developed for the Laguna Lake Model were based on the Universal Transverse Mercator (UTM) projection. In the simulation, typical water depths ranged from 0.2m to 19.8m as shown in Fig. 3.
4.
R
ESULTS ANDD
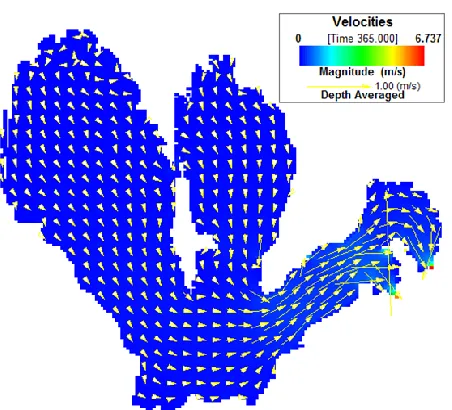
ISCUSSIONData from the National Agromet Station, University of the Philippines, Los Baños (NAS UPLB), Laguna Station, was used in the wind data series of the simulation, average of the data used covered 1977-2003 prevailing wind. The wind average speed is 2 m/sec2 for the entire 365-day run. Monthly prevailing wind direction is as follows. January – Easterly wind; February to May wind – North Easterly wind; June and July – Easterly wind; August – South Westerly wind; September and October - Easterly wind; November and December – North Easterly wind.
Fig. 2 shows the wind circulation pattern of the Laguna Lake Basin
Fig. 2:Wind Circulation Pattern in Laguna Lake Basin with Average wind speed at 2 m/sec2
Fig. 3 shows the bathymetry of the Laguna Lake Basin. The average depth based on the data from the updated LLDA data is 3.21 meters. The majority of the locations with available depth is between 3.0 meters to 3.09 meters. A value of 27.5 ºC annual average mean temperature value from National Agromet Station, University of the Philippines, Los Baños, Laguna Station, was used in the initial condition of temperature data series of the simulation.
Fig. 3: Bathymetric map
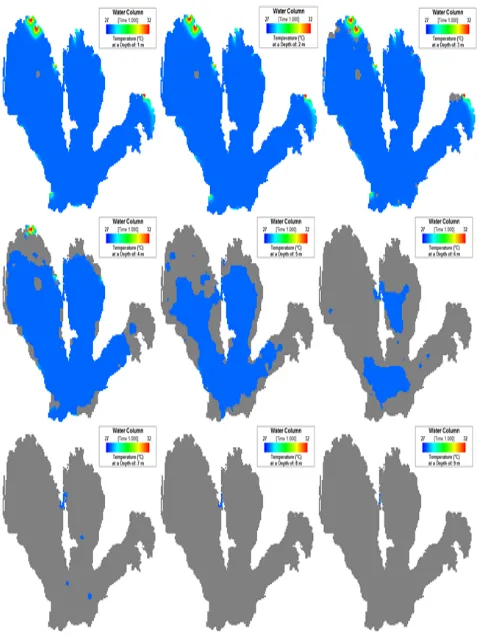
Fig. 4,
Fig. 5 and ,
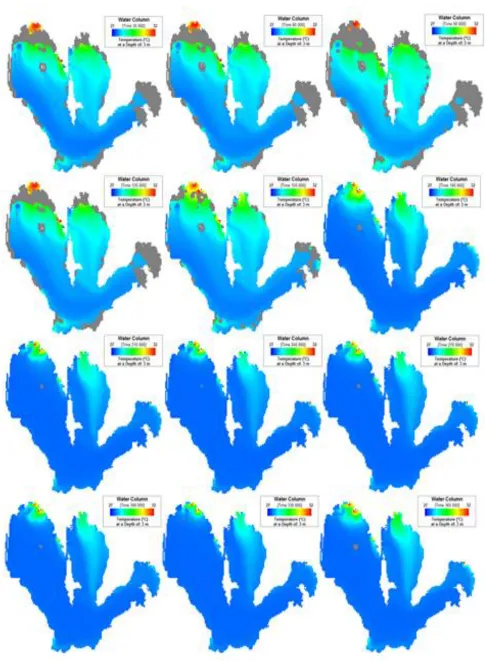
Fig. 6 illustrates the simulated temperature for the Laguna Lake Basin for a 1 year cycle.
Fig. 4 shows the initial condition of the Laguna Lake Basin at day 1 from depths 1 to 9, while
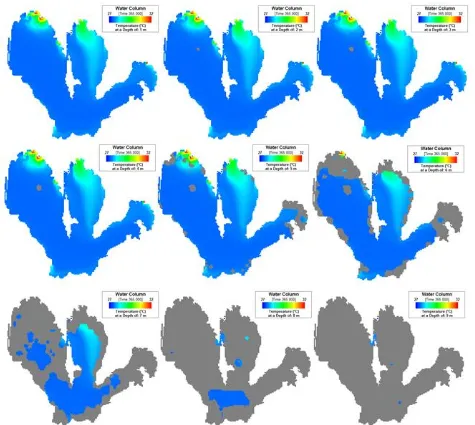
Fig. 5:Laguna Lake Basin water temperature at Day 365, 1 meter to 9 meter depth
Water movements at different scales and of different types significantly affect the distribution of temperature [17]. Oxygen tends to be less soluble as temperature increases. [6]. If the water temperature rises to high, the dissolved oxygen (DO) level decreases, directly threatening aquatic life and contributing to eutrophication [17]. Based on the Department of Environment and Natural Resources Administrative Order 34, 3 ºC is the allowable temperature increase over the average ambient temperature for each month, where in this rise shall be based on the average of the maximum daily readings recorded at the site, but upstream of the mixing zone over a period of one month for water under Class A, B, C and D [18].
5.
C
ONCLUSIONThe lake is shallow at an average depth of 3.21 meters and the temperature is high throughout the year therefore, it is thermally unstratified, On the 1-year simulation period done, water temperature of the Laguna Lake Basin varies only from 27ºC to 32 ºC. The major factor the affects the temperature of the lake are the inflow of the water from its tributary rivers. The wind direction is the major contributor for the direction of the flow of water. This model will be very useful to be used for modeling the water quality and hydrodynamic transport of Laguna Lake.
A
CKNOWLEDGMENTThe author would like to acknowledge the Laguna Lake Development Authority (LLDA), Philippine Atmospheric, Geophysical and Astronomical Services Administration (PAGASA), Department of Science and Technology – Engineering Research and Development for Technology (DOST-ERDT), Mapúa Institute of Technology for the support in the study.
R
EFERENCES[1]. J. S. D. Ireneo G. Bongco, "Annual Water Quality Report of the Laguna de Bay and its Tributary Rivers," Department of Environmental and Natural Resources - Laguna Lake Development Authority, 2012.
[2]. A. E. S. Ikuro Mitsumoto, "A Modelling of Eutrophicatioin in Laguna de Bay as a Tool for Rational Resource Management," pp. pp 49-73, 2001.
[3]. L. L. D. Authority, "Laguna Lake, Lake Uses," 2014.
[4]. C. o. F. a. N. R. U. o. t. P. Philippine Sub-Global Team, Los Baños, "Ecosystems and People: The Philippine Millennium Ecosystem and Assessment (MA) Sub-Global Assessment," 2005.
[5]. L. A. Project. (2014). Lake Access: An Empact Metro Project. Available: www.lakeaccess.org
[6]. E. L. a. R. Division, "2009 to 2012 Annual Water Quality Report on the Laguna de Bay and its Tributary Rivers," 2013.
[7]. P. M. Craig, "User's Manual for EFDC_Explorer7: A Pre/Post Processor for the Environmental Fluid Dynamics Code (Rev00)," vol. Version 120516, p. 236, May, 2012 2012.
[8]. J. M. Hamrick and W. B. Mills, "Analysis of water temperatures in Conowingo Pond as influenced by the Peach Bottom atomic power plant thermal discharge," Environmental Science & Policy, vol. 3, Supplement 1, pp. 197-209, 9/1/ 2000.
[9]. L. L. Meghna Babbar-Sebens, Kaishan Song, Shuangshuang Xie, "On the Use of Landsat-5 TM Satellite for Assimilating Water Temperature Observations in 3D Hydrodynamic Model of Small Inland Reservoir in Midwestern US," Scientific Research, vol. 2, 214-227, 2013.
[10]. Y. Wang, Y. Jiang, W. Liao, P. Gao, X. Huang, H. Wang, et al., "3-D hydro-environmental simulation of Miyun reservoir, Beijin," Journal of Hydro-environment Research.
[11]. G. Wu and Z. Xu, "Prediction of algal blooming using EFDC model: Case study in the Daoxiang Lake," Ecological Modelling, vol. 222, pp. 1245-1252, 3/24/ 2011.
[12]. J. M. W. Hamrick, T. S. ; National Environmental Supercomputing Center; U.S., "Computational Design and Optimization of the EFDC/HEM3D Surface Water Hydrodynamic and Eutrophication Models," Conference paper, p. 14 Pages, 1997.
[13]. Wikipedia. (April 1). Amihan. Available: www.wikipedia.org/wiki/amihan
[14]. Wikipedia. (July 12). Laguna de Bay. Available: www.wikipedia.org/wiki/Laguna_de_Bay
[15]. L. L. D. Authority, "Unpublished-Water Balance of Laguna de Bay," 2014.
[16]. E. M. B. D. o. E. a. N. Resources, "Water Quality Monitoring Manual Volume 1: Manual on Ambient Water Quality Monitoring," 2008.
[17]. Z.-G. Ji, "Hydrodynamics and Water Quality Modelling Rivers, Lakes, and Estuaries," 2009.