JOURNAL OFCLINICALMICROBIOLOGY, Dec. 2008, p. 3880–3891 Vol. 46, No. 12 0095-1137/08/$08.00⫹0 doi:10.1128/JCM.00755-08
Copyright © 2008, American Society for Microbiology. All Rights Reserved.
Differences between Two Real-Time PCR-Based Hepatitis C Virus
(HCV) Assays (RealTime HCV and Cobas AmpliPrep/Cobas
TaqMan) and One Signal Amplification Assay (Versant HCV
RNA 3.0) for RNA Detection and Quantification
䌤
Johannes Vermehren,
1Annika Kau,
1Barbara C. Ga
¨rtner,
2Reinhild Go
¨bel,
3Stefan Zeuzem,
1and Christoph Sarrazin
1*
Zentrum der Inneren Medizin, Medizinische Klinik 1, Klinikum der J. W. Goethe-Universita¨t, Frankfurt am Main, Germany1;
Institut fu¨r Virologie, Universita¨tsklinikum des Saarlandes, Homburg/Saar, Germany2; and Klinik fu¨r Innere Medizin II,
Universita¨tsklinikum des Saarlandes, Homburg/Saar, Germany3
Received 21 April 2008/Returned for modification 26 June 2008/Accepted 5 September 2008
Hepatitis C virus (HCV) RNA detection and quantification are the key diagnostic tools for the management of hepatitis C. Commercially available HCV RNA assays are calibrated to the HCV genotype 1 (gt1)-based WHO standard. Significant differences between assays have been reported. However, it is unknown which assay matches the WHO standard best, and little is known about the sensitivity and linear quantification of the assays for non-gt1 specimens. Two real-time reverse transcriptase PCR-based assays (RealTime HCV and Cobas Ampliprep/Cobas TaqMan HCV [CAP/CTM]) and one signal amplification-based assay (the Versant HCV RNA, version 3.0, branched DNA [bDNA] assay) were compared for their abilities to quantify HCV RNA
in clinical specimens (n ⴝ 65) harboring HCV isolates of gt1 to g5. The mean differences in the amounts
detected by RealTime HCV in comparison to those detected by the bDNA assay and CAP/CTM wereⴚ0.02 and
0.72 log10IU/ml HCV RNA, respectively, for gt1;ⴚ0.22 and 0.03 log10IU/ml HCV RNA, respectively, for gt2;
ⴚ0.27 and ⴚ0.22 log10 IU/ml HCV RNA, respectively, for gt3; ⴚ0.19 and ⴚ1.27 log10 IU/ml HCV RNA,
respectively, for gt4; andⴚ0.03 and 0.09 log10 IU/ml HCV RNA, respectively, for gt5. The lower limits of
detection for RealTime HCV and CAP/CTM were 16.8 and 10.3 IU/ml, respectively, for the WHO standard and in the range of 4.7 to 9.0 and 3.4 to 44.4 IU/ml, respectively, for clinical specimens harboring gt1 to gt6. Direct comparison of the two assays with samples of the WHO standard (code 96/798) with high titers yielded slightly
smaller amounts by RealTime HCV (ⴚ0.2 log10at 1,500 IU/ml andⴚ0.3 log10at 25,000 IU/ml) and larger
amounts by CAP/CTM (0.3 log10at 1,500 IU/ml and 0.2 log10at 25,000 IU/ml). Finally, all three tests were
linear between 4.0ⴛ103
and 1.0ⴛ106
IU/ml (correlation coefficient,>0.99). In conclusion, the real-time PCR
based assays sensitively detected all genotypes and showed comparable linearities for the quantification of HCV RNA, with the exception of gt1 and gt4. The previously reported differences in the absolute quantification of samples harboring gt1 were confirmed and may be explained by different calibrations to the WHO standard.
Hepatitis C virus (HCV) infection is a common cause of chronic liver disease that can lead to end-stage liver disease, including hepatocellular carcinoma.
At present, combination therapy with pegylated interferon and ribavirin is the standard of care. However, this treatment regimen appears to be effective in only 40% to 50% of patients infected with genotype 1 and approximately 80% of patients infected with genotypes 2 and 3 (12, 13, 16).
A sustained virologic response, defined as undetectable HCV RNA at least 6 months after the completion of therapy, may be predicted by a number of host and viral factors, includ-ing age, race, liver fibrosis, the HCV genotype, and the base-line viral load.
Recent reports suggest that decisions on the optimal treat-ment duration may be made on the basis of the baseline viral load and the virologic response at weeks 4, 12, and 24 of
therapy (2, 11, 15, 28). In addition, stopping algorithms have been established on the basis of a less than 2-log10drop in the
viral load at week 12 of therapy, due to a very low rate (no greater than 3%) of a sustained response (9, 12). Moreover, the detection of HCV RNA at week 24 is associated with a low sustained virologic response rate, and treatment discontinua-tion is recommended due to nonresponse (9). Measurement of HCV RNA has therefore become the key parameter for the tailoring of individualized treatment.
For HCV RNA measurement, different standardized quan-tification assays based on signal amplification techniques (the branched DNA [bDNA] assay) and target amplification tech-niques (reverse transcriptase PCR [RT-PCR]) with different sensitivities and different ranges of quantification are commer-cially available.
Recently, real-time RT-PCR-based assays have been intro-duced in routine diagnostics and are rapidly replacing standard RT-PCR- and signal amplification-based assays.
These quantification assays offer the advantage of amplifi-cation over a broad dynamic range, thus improving limits of detection (LODs) toⱕ10 IU/ml and linear quantification up to 107 to 108 IU/ml without the need for predilution. Previous * Corresponding author. Mailing address: Medizinische Klinik 1,
Klinikum der J. W. Goethe-Universita¨t, Theodor-Stern-Kai 7, Frank-furt am Main 60590, Germany. Phone: 6301-5122. Fax: 49-69-6301-6448. E-mail: [email protected].
䌤Published ahead of print on 17 September 2008.
3880
on May 16, 2020 by guest
http://jcm.asm.org/
qualitative and quantitative RT-PCR-based tests may be com-bined in a single assay.
The development of a WHO HCV international unit (IU) standard has contributed to better accuracy and the better comparability of the results obtained by different assays. How-ever, the standard is based on the consensus value attained from the quantitative analysis only of samples harboring HCV RNA of genotype 1 (22, 23). Although all current commer-cially available assays are calibrated to the WHO standard, little is known about the sensitivity and the linear quantifica-tion of these assays when they are directly compared with each other by the use of both clinical and WHO standard specimens. In addition, it has been shown that the results obtained by assays performed with different HCV genotypes may vary sig-nificantly, despite standardization to IU, and it remains unclear which assay produces the correct results (7, 24).
The aim of our study was to evaluate and compare the performance characteristics of three currently available HCV RNA quantification methods, including two real-time PCR-based assays (RealTime HCV [Abbott Molecular Inc., Abbott Park, IL] and the Roche Cobas Ampliprep/Cobas TaqMan HCV assay [CAP/CTM; Roche Molecular Systems, Pleasan-ton, CA]) and a signal amplification-based assay (Siemens Ver-sant HCV RNA, version 3.0 [bDNA], assay; Siemens Health-care Diagnostics, Tarrytown, NY) by testing serum samples from patients infected with HCV genotypes 1 to 5 (6) and the HCV WHO standard.
(Part of this study was presented at the Annual Meeting of the American Association for the Study of Liver Diseases, Boston, MA, 2 to 6 November 2007.)
MATERIALS AND METHODS
HCV genotyping.The HCV genotypes were determined by using the Versant HCV genotype (version 2.0) assay (a line probe assay; Siemens Healthcare Diagnostics, Tarrytown, NY), in accordance with the manufacturer’s instruc-tions. While with version 1 of the line probe assay HCV subtypes 1a and 1b were
correctly identified in only⬍90% of the patient samples, a⬎95% accuracy for
correct subtyping is achievable with version 2 (1, 4, 6). In addition, version 2 correctly identifies samples harboring genotype 6 (4, 20).
HCV RNA assays. (i) Abbott RealTime HCV.RealTime HCV is based on the reverse transcription-PCR technology combined with real-time fluorescent de-tection for the quantification of HCV RNA.
HCV RNA was isolated by the Abbott m2000sp instrument from 1,000-l
aliquots (sample volume required, 500l), as described previously (17).
Ex-tracted samples and controls were then amplified and detected with the Abbott m2000rt instrument, according to the manufacturer’s instructions.
In short, an RNA sequence that is unrelated to the HCV target sequence is added as an internal control (IC). Specimens and ICs are extracted highly efficiently by binding to magnetic particles.
After sample preparation, reverse transcription and amplification are carried
out with the thermostable recombinantTthDNA polymerase. Both, HCV and IC
have their respective primers and probes. The HCV-specific primers and probes
bind within the highly conserved 5⬘nontranslated region of HCV, and the IC
primers and probes bind to a target sequence of an armored RNA particle
derived from the pumpkin plant (Cucurbita pepo).
For detection of the amplification products, the assay utilizes real-time PCR technology with two different dually labeled fluorescent oligonucleotide probes that bind to the HCV or the IC target sequence. The probes carry a fluorescent
moiety that is covalently linked to the 5⬘end and a quenching moiety that is
covalently linked to the 3⬘end. When the HCV or the IC target sequence is
absent, the fluorescent moiety is quenched and there is no fluorescent emission (randomly coiled probes). In the presence of the target sequences, probe hybrid-ization to complementary sequences separates the two moieties and allows flu-orescence emission and detection.
The amplification cycle at which the fluorescent signal is detected by the
m2000rt instrument is proportional to the log of the amount of HCV RNA present in the original sample; thus, the HCV RNA concentration in the spec-imen can be calculated.
The assay has adopted the second international WHO standard for HCV RNA (code 96/798) for calibration, and HCV RNA concentration is reported in IU per ml. Generally, four different modes of results are possible: undetectable (below the LOD of the assay), positive but below 12 IU/ml, positive above 12 IU/ml with
an exact HCV RNA concentration, or positive above 8.0 log10IU/ml (which
[image:2.585.307.533.71.560.2]represents the upper limit of quantification).
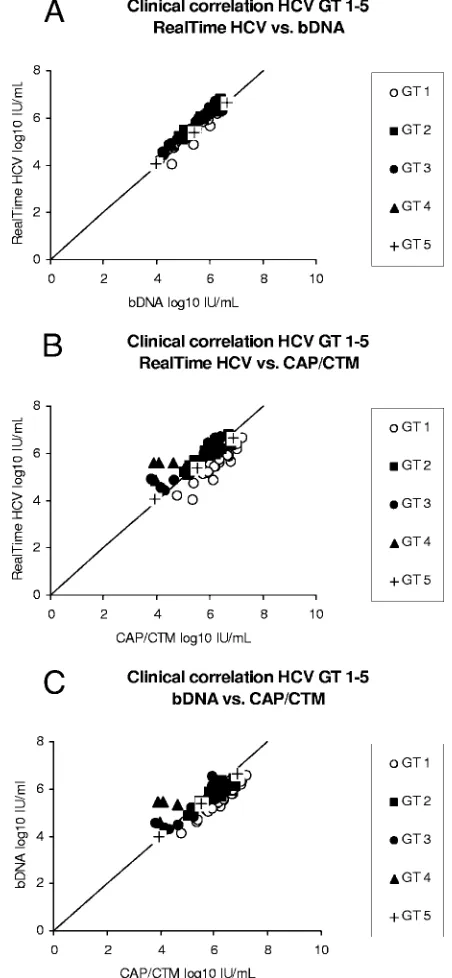
FIG. 1. Correlation of the results for clinical specimens (n⫽65) from patients with chronic HCV infection, as assessed by direct com-parison of the results of RealTime HCV versus those of the bDNA assay (A), the results of RealTime HCV versus those of CAP/CTM (B), and the results of CAP/CTM versus those of the bDNA assay (C). The different genotypes (GTs) are represented by different symbols.
on May 16, 2020 by guest
http://jcm.asm.org/
3882
on May 16, 2020 by guest
http://jcm.asm.org/
RealTime HCV has a reported linear quantification range of between 12 and
107
IU/ml. The assay’s 95% detection rate or LOD is 10.5 IU/ml, as stated in the package insert. Similar results have been reported in an analysis conducted by researchers who were independent of the manufacturer (27).
(ii) Roche CAP/CTM.CAP/CTM is also based on the real-time reverse tran-scription-PCR technology.
HCV RNA extraction from 1,000-l aliquots (sample volume required, 850
l) of clinical samples and controls was performed with the automated Cobas
Ampliprep instrument, according to the manufacturer’s instructions. The ex-tracted samples and controls were then processed for amplification and detection with the Cobas TaqMan 48 analyzer, as described previously (24). CAP/CTM is standardized against the first WHO international standard for HCV RNA (code 96/790), and titers are reported in IU per ml. As for RealTime HCV, the results of CAP/CTM are reported in four different ways: undetectable (below or above the assays’ LOD), positive but below 15 IU/ml, positive above 15 IU/ml with an
exact HCV RNA concentration, or positive and above 6.9⫻107
IU/ml (upper limit of quantification).
The assay’s linear quantification range is between 43 and 6.9⫻107
IU/ml, as indicated in the package insert. The assay’s 95% detection rate is 12.6 IU/ml (package insert) and has ranged from 7.4 to 10.5 IU/ml in recently published studies (26, 29).
(iii) Versant bDNA assay.The Versant bDNA assay is a signal amplification nucleic acid probe test that uses a sandwich nucleic acid hybridization procedure. The test has been standardized to the first WHO international standard (code 96/790) and has a reported dynamic range between the lower LOD of 615 IU/ml
and 7.7⫻106
IU/ml, as stated in the package insert.
The testing procedure has been described elsewhere and was performed by following the manufacturer’s instructions (21).
The bDNA assay is currently the only commercially available assay that has gained FDA approval, but all three tests (RealTime HCV, CAP/CTM, and the
bDNA assay) have received the Communaute´ Europe´enne (CE) mark.
Clinical correlation of HCV RNA assays.The performance characteristics of the three HCV RNA assays (RealTime HCV, CAP/CTM, and the bDNA assay) were evaluated by the comparative quantification of HCV in clinical specimens sorted by genotype.
Sixty-five undiluted clinical serum samples from patients infected with HCV
genotype 1 (n⫽30), 2 (n⫽12), 3 (n⫽16), 4 (n⫽4), or 5 (n⫽3) were obtained
from the outpatient clinic at Saarland University Hospital. Written informed consent was obtained from each patient, and the studies were approved by the Ethics Committee of Medical Research in Homburg, Germany, in accordance with the 1975 Declaration of Helsinki.
All samples were stored at⫺80°C. To allow identical conditions for all assay
procedures, the samples were thawed to generate appropriate aliquots and were
subsequently stored again at⫺80°C prior to parallel testing by all three assays.
To determine the intra-assay variability, aliquots were analyzed in triplicate in a single run. Samples with invalid, nondetectable, and outlying results were ex-cluded from further analysis.
WHO and genotype-specific assay sensitivity.To measure the analytical sen-sitivity of the two real-time PCR-based assays, panels of the second international WHO standard HCV RNA (code 96/798) were serially diluted to the following concentrations: 50, 25, 15, 10, 7.5, 5, and 2.5 IU/ml. The dilutions were stored at
⫺80°C and were subsequently tested in parallel by both assays. Fifteen replicates
of each concentration of the panel were tested in a single run.
In addition, the LOD was also evaluated with serial dilutions of six clinical specimens infected with HCV genotypes 1 to 6. For this purpose, serum samples were collected from patients with chronic HCV infection in the outpatient clinic at the Saarland University Hospital in the same fashion as described above. Panels with the following concentrations were produced: 50, 25, 12.5, 6.25, and 3.125 IU/ml. The original HCV RNA levels used for calculation of the dilutions were determined by RealTime HCV. Aliquots were again tested in parallel by both assays (RealTime HCV, CAP/CTM). Twelve replicates of each concentra-tion were tested in a single run.
Quantification of HCV WHO standard RNA.Even though all commercially available assays have adopted the HCV WHO standard for calibration, differ-ences between assays have been reported (7, 24), and it remains unclear which assay’s results correspond best to the standard material.
The assigned unitage of the second international WHO standard HCV RNA is 50,000 IU/ml. For direct comparison of the two real-time PCR-based assays, high-titer dilutions of the standard were prepared by using HCV antibody-negative human serum. Four aliquots of 25,000 IU/ml and three aliquots of 1,500 IU/ml were each tested in a single run by RealTime HCV and CAP/CTM, respectively.
Genotype-specific assay linearities.The linearities of all three assays were determined on the basis of results of tests with high-titer clinical specimens from patients infected with HCV genotypes 1 through 5. For each genotype, one
high-titer sample (⬎105IU/ml) was selected. Determination of the original HCV
RNA level was performed by RealTime HCV.
Six dilutions (1.0⫻106, 3.3⫻105, 1.1⫻105, 3.7⫻104, 1.2⫻104, and 4.1⫻
103
) were prepared, and HCV antibody-negative and/or HCV RNA-negative plasma obtained from healthy volunteers was used as a dilution matrix. Each dilution was tested in triplicate by all three assays in a single run.
Data analysis.The results are expressed as the mean, median, and standard
deviation (SD), as appropriate. Correlation coefficients (Rvalues) and the rates
of agreement between RealTime HCV, the bDNA assay, and CAP/CTM were determined from the mean differences in quantification for averaged log values by Bland-Altman plot analysis (Bias, version 8.4.6; Epsilon Verlag, Frankfurt, Germany) (3). Intra-assay variability was expressed as the SD and the coefficient of variation (CV), based on the mean log10-transformed HCV RNA concentra-tions. Probit analysis was performed to determine the LOD, with the results for standard reference samples used as independent variables and the numbers of positive results used as dichotomous variables (SPSS program, version 16.0; SPSS Inc., Chicago, IL). The LOD was determined as the 95% probability of
obtaining a positive result for HCV RNA.Rvalues were calculated for linearity
data.
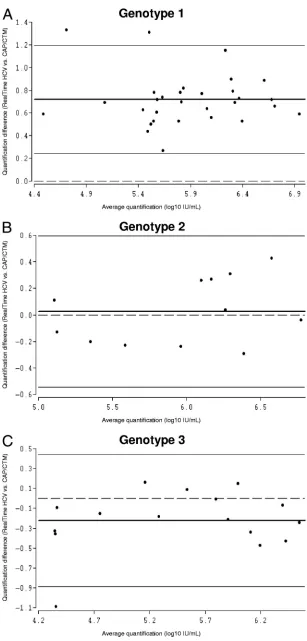
[image:4.585.45.543.90.195.2]FIG. 2. Bland-Altman analysis of genotype-specific mean differences in HCV RNA quantification by RealTime HCV versus that by the bDNA assay. Due to the relatively low number of samples harboring genotypes 4 and 5, Bland-Altman analysis was performed only for genotypes 1 (A), 2 (B), and 3 (C). The bold lines represent the mean differences for the samples, the thin lines represent the 95% limits of agreement, and the dashed lines are the reference lines.
TABLE 1. Correlation of RealTime HCV with bDNA assay and CAP/CTM for determination of HCV RNA concentrations in patients infected with genotypes 1 to 5
Genotype No. of
samples
Mean (range)
concna(log10IU/
ml) by RealTime HCV
bDNA assay CAP/CTM
Mean (range) concn
(log10IU/ml)
Difference in concn
(log10IU/ml) from
that by RealTime HCV
Mean (range) concn
(log10IU/ml)
Difference in concn
(log10IU/ml) from
that by RealTime HCV
1 30 5.50 (4.0–6.7) 5.48 (4.1–6.6) ⫺0.02 6.22 (5.4–7.2) 0.72
2 12 5.96 (5.1–6.8) 5.74 (4.9–6.4) ⫺0.22 5.99 (5.1–6.8) 0.03
3 16 5.58 (4.4–6.7) 5.31 (4.3–6.5) ⫺0.27 5.36 (3.8–6.4) ⫺0.22
4 4 5.41 (4.9–5.6) 5.22 (4.6–5.5) ⫺0.19 4.14 (3.9–4.6) ⫺1.27
5 3 5.36 (4.1–6.7) 5.33 (4.0–6.6) ⫺0.03 5.45 (3.9–6.9) 0.09
a
Mean (range) concentration, mean (range) HCV RNA concentration.
on May 16, 2020 by guest
http://jcm.asm.org/
FIG. 3. Bland-Altman analysis of genotype-specific mean differences in HCV RNA quantification by RealTime HCV versus that by CAP/CTM. Due to the relatively low number of samples harboring genotypes 4 and 5, Bland-Altman analysis was performed only for genotypes 1 (A), 2 (B), and 3 (C). The bold lines represent the mean differences for the samples, the thin lines represent the 95% limits of agreement, and the dashed lines are the reference lines.
3884 VERMEHREN ET AL. J. CLIN. MICROBIOL.
on May 16, 2020 by guest
http://jcm.asm.org/
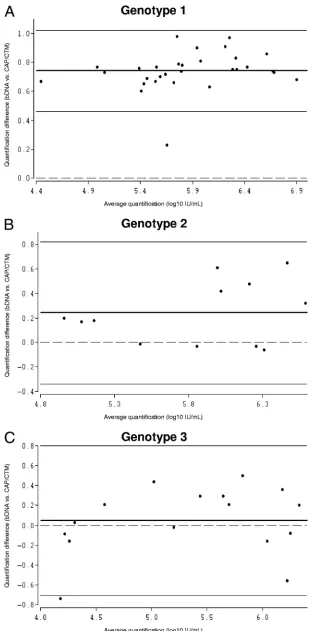
FIG. 4. Bland-Altman analysis of genotype-specific mean differences in HCV RNA quantification by CAP/CTM versus that the bDNA assay. Due to the relatively low number of samples harboring genotypes 4 and 5, Bland-Altman analysis was performed only for genotypes 1 (A), 2 (B), and 3 (C). The bold lines represent the mean differences for the samples, the thin lines represent the 95% limits of agreement, and the dashed lines are the reference lines.
on May 16, 2020 by guest
http://jcm.asm.org/
RESULTS
Agreement of HCV RNA assays.Sixty-five undiluted clinical
samples infected with HCV genotypes 1 to 5 were available for parallel testing by RealTime HCV, CAP/CTM, and the bDNA assay.
Bland-Altman plots of the results for HCV genotypes 1 to 3 were used to determine the agreement between RealTime HCV and the bDNA assay. The differences between the two assays were plotted against the averaged log10 results. For
RealTime HCV versus the bDNA assay, the mean difference between the values of the assays for genotype 1 was⫺0.02 log10
IU/ml HCV RNA, with limits of agreement (mean differ-ence⫾2 SDs) of⫺0.44 and 0.40 log10IU/ml, and more than
95% of the differences fell within these limits. The mean dif-ference between the values for genotype 2 was ⫺0.22 log10
IU/ml, with limits of agreement of⫺0.53 and 0.10 log10IU/ml.
The mean difference in the values for genotype 3 was⫺0.27 log10IU/ml, with limits of agreement of⫺0.63 and 0.09 log10
IU/ml. The mean differences between the values of the two assays for genotypes 4 and 5 were ⫺0.19 and ⫺0.03 log10
IU/ml, respectively (Fig. 1A and 2A to C; Table 1).Rvalues for genotypes 1 to 5 were also calculated and ranged from 0.94 to 0.99.
For genotype 1, the agreement of the values between Real-Time HCV and CAP/CTM was poor, with a mean difference of 0.72 log10IU/ml (limit of agreement, 0.24 and 1.20 log10IU/
ml). The agreement for genotypes 2 and 3 was good, with mean differences of 0.03 log10IU/ml (limit of agreement,⫺0.55 and
0.60 log10IU/ml) and⫺0.22 log10IU/ml (limit of agreement, ⫺0.89 and 0.44 log10 IU/ml), respectively. The mean
differ-ences for genotypes 4 and 5 were⫺1.27 and 0.09 log10IU/ml,
respectively (Fig. 1B and 3A to C; Table 1). R values for genotypes 1 to 5 ranged from 0.36 to 0.99.
Comparison of the bDNA assay with CAP/CTM demon-strated poor agreement of the results for samples harboring genotype 1. The mean difference was 0.74 log10IU/ml, with
limits of agreement of 1.02 and 0.46 log10IU/ml.
The mean differences for genotypes 2 and 3 were 0.24 log10
IU/ml (limit of agreement, 0.82 and⫺0.34 log10IU/ml) and
0.05 log10 IU/ml (limit of agreement, 0.80 and ⫺0.70 log10
IU/ml), respectively. The mean differences for genotypes 4 and
5 were⫺1.08 and 0.12 log10IU/ml, respectively (Fig. 1C and
4A to C).Rvalues for genotypes 1 to 5 were in the range of 0.21 to 0.99.
Intra-assay variability was calculated on the basis of the three replicates measured for each patient sample. The CVs varied from 0.72% to 1.3% for RealTime HCV, 0.55% to 1.35% for the bDNA assay, and 1.4% to 3.02% for CAP/CTM (Table 2). The CVs for specimens with low viral loads (⬍400,000 IU/ml HCV RNA, as assessed by RealTime HCV) were between 1.01% and 1.69% for RealTime HCV, 0.5% and 1.54% for the bDNA assay, and 1.66% and 3.24% for CAP/ CTM (Table 2).
Assay sensitivity for WHO standard and genotype-specific
clinical samples.The positive hit rates (positive values of⬍12
IU/ml orⱖ12 IU/ml) for the WHO HCV RNA standard di-lution series for RealTime HCV were 73% (11 of 15 samples) at 10 IU/ml, 87% (13 of 15 samples) at 15 IU/ml, and 100% at 25 IU/ml. The positive hit rates (positive values of⬍15 IU/ml orⱖ15 IU/ml) for CAP/CTM were 87% (13 of 15 samples) at 10 IU/ml and 100% at 15 and 25 IU/ml.
The lower LOD determined by probit analysis yielded sen-sitivities of 16.8 (95% confidence interval, 13.1 to 27.9) for RealTime HCV and 10.3 (95% confidence interval, 8.4 to 15.1) for CAP/CTM (Table 3 and Table 4).
[image:7.585.46.543.80.233.2]RealTime HCV achieved positive hit rates (positive values
TABLE 2. Intra-assay variability by SD based on variance analyses and estimation of CVs for all samples and samples with low viral loads
Sample type and genotype
No. of samples
RealTime HCV bDNA assay CAP/CTM
Mean CV (%) SD (log10) Mean CV (%) SD (log10) Mean CV (%) SD (log10)
All samples
1 30 1.17 0.06 0.67 0.04 1.40 0.08
2 12 0.96 0.06 0.55 0.03 2.38 0.14
3 16 0.83 0.04 1.35 0.08 2.04 0.10
4 4 1.30 0.07 0.64 0.03 2.58 0.11
5 3 0.72 0.04 1.11 0.05 3.02 0.16
LVLa
1 17 1.38 0.07 0.73 0.04 1.66 0.09
2 3 1.20 0.06 0.92 0.05 2.64 0.13
3 8 1.12 0.05 0.84 0.04 2.86 0.13
4 3 1.69 0.09 0.50 0.02 2.54 0.11
5 2 1.01 0.05 1.54 0.07 3.24 0.16
aLVL, low viral load (⬍400,000 IU/ml), as assessed by RealTime HCV.
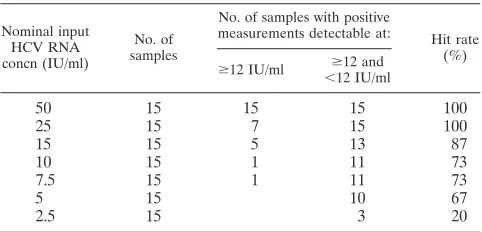
TABLE 3. LOD of RealTime HCVa
Nominal input HCV RNA concn (IU/ml)
No. of samples
No. of samples with positive
measurements detectable at: Hit rate
(%)
ⱖ12 IU/ml ⬍ⱖ12 and
12 IU/ml
50 15 15 15 100
25 15 7 15 100
15 15 5 13 87
10 15 1 11 73
7.5 15 1 11 73
5 15 10 67
2.5 15 3 20
aPanels of the second international WHO standard HCV RNA (code 96/798)
were used. The LOD determined by probit analysis was 16.8 IU/ml (95% con-fidence interval, 13.1 to 27.9 IU/ml).
3886 VERMEHREN ET AL. J. CLIN. MICROBIOL.
on May 16, 2020 by guest
http://jcm.asm.org/
[image:7.585.301.542.583.699.2]of⬍12 IU/ml orⱖ12 IU/ml) ofⱖ95% at a concentration of 6.25 IU/ml for clinical samples harboring genotypes 1, 2, 3, 5, and 6. However, aⱖ95% hit rate for genotype 4 was achieved only at 12.5 IU/ml (Table 5).
For CAP/CTM, positive hit rates (positive values of ⬍15 IU/ml or ⱖ15 IU/ml) of ⱖ95% at a concentration of 6.25 IU/ml were achieved only for samples harboring genotypes 1 and 5. Aⱖ95% positive hit rate was achieved for genotype 3 at 12.5 IU/ml. Positive hit rates ofⱖ95% were achieved for ge-notypes 2 and 4 at 25 IU/ml. In addition, 92% positive hit rates were achieved for genotypes 1, 2, 4, and 5 at higher concen-trations (Table 6).
For clinical specimens harboring genotypes 1 to 6, the sen-sitivities obtained by probit analysis were in the range of 4.7 to 9.0 IU/ml for RealTime HCV. For CAP/CTM, the lower LOD ranged from 3.4 to 14.1 IU/ml for samples harboring genotypes 1, 3, 5, and 6. For samples harboring genotypes 2 and 4, significantly higher values were observed at 44.4 and 40.5 IU/ ml, respectively (Tables 5 and 6).
Quantification of HCV WHO standard RNA.For estimation
of the correct quantification of high concentrations of the WHO standard by the two real-time PCR-based assays, repeat testing at concentrations of 1,500 and 25,000 IU/ml was per-formed.
RealTime HCV quantification results for the WHO stan-dard samples yielded mean deviations of ⫺0.2 log10 IU/ml
(range,⫺0.4 to⫺0.2 log10IU/ml) and⫺0.3 log10IU/ml (range, ⫺0.4 to⫺0.2 log10IU/ml) at 3.2 log10(1,500 IU/ml) and 4.4
log10(25,000 IU/ml), respectively. For CAP/CTM, the
quanti-fication difference was 0.3 log10IU/ml at 3.2 log10and 0.2 log10
IU/ml (range,⫺0.1 to 0.4 log10IU/ml) at 4.4 log10(Table 7).
Genotype-specific assay linearity. For RealTime HCV,
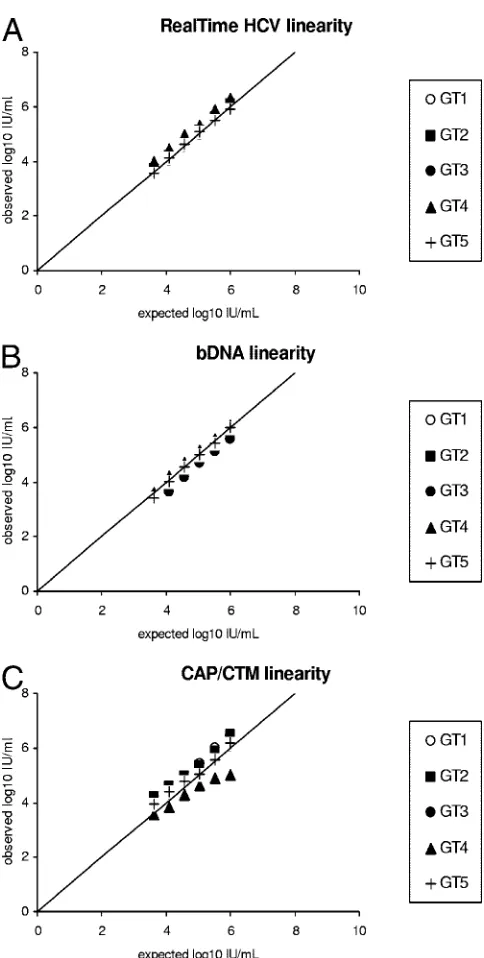
CAP/CTM, and the bDNA assay, the quantification of HCV RNA of five different HCV genotypes (1 to 5) was mostly linear between 4.0⫻103and 1.0⫻106IU/ml. The exception
was the CAP/CTM assay, which showed results lower than expected for the sample harboring genotype 4 at concentra-tions above 1.0⫻104IU/ml (Fig. 5A to C).
[image:8.585.43.284.80.203.2]The overallRvalues between the expected and the observed results were⬎0.99, ⬎0.99, and 0.99 for RealTime HCV, the bDNA assay, and CAP/CTM, respectively, with mean differ-ences in the expected and the observed values of⫺0.06, 0.14, and⫺0.14 log10IU/ml for the three assays, respectively.
TABLE 4. LOD of CAP/CTMa
Nominal input HCV RNA concn (IU/ml)
No. of samples
No. of samples with positive measurements
detectable at: Hit rate (%)
ⱖ12 IU/ml ⱖ12 and
⬍12 IU/ml
50 14 14 14 100
25 15 5 15 100
15 15 1 15 100
10 15 1 13 87
7.5 15 1 14 93
5 15 9 60
2.5 15 4 27
aPanels of the second international WHO standard HCV RNA (code 96/798)
were used. The LOD determined by probit analysis was 10.3 IU/ml (95% con-fidence interval, 8.4 to 15.1 IU/ml).
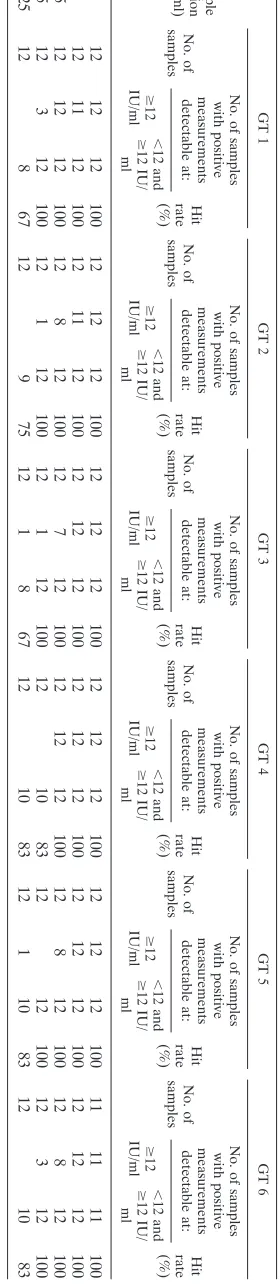
TABLE 5. LOD of the RealTime HCV assay based on clinical specimens representing genotypes 1 to 6 a Sample dilution (IU/ml) GT 1 GT 2 GT 3 GT 4 GT 5 GT 6 No. of samples No. of samples with positive measurements detectable at: Hit rate (%) No. of samples No. of samples with positive measurements detectable at: Hit rate (%) No. of samples No. of samples with positive measurements detectable at: Hit rate (%) No. of samples No. of samples with positive measurements detectable at: Hit rate (%) No. of samples No. of samples with positive measurements detectable at: Hit rate (%) No. of samples No. of samples with positive measurements detectable at: Hit rate (%) ⱖ 12 IU/ml ⬍ 12 and ⱖ 12 IU/ ml ⱖ 12 IU/ml ⬍ 12 and ⱖ 12 IU/ ml ⱖ 12 IU/ml ⬍ 12 and ⱖ 12 IU/ ml ⱖ 12 IU/ml ⬍ 12 and ⱖ 12 IU/ ml ⱖ 12 IU/ml ⬍ 12 and ⱖ 12 IU/ ml ⱖ 12 IU/ml ⬍ 12 and ⱖ 12 IU/ ml 50 12 12 12 100 12 12 12 100 12 12 12 100 12 12 12 100 12 12 12 100 11 11 11 100 25 12 11 12 100 12 11 12 100 12 12 12 100 12 12 12 100 12 12 12 100 12 12 12 100 12.5 12 12 12 100 12 8 12 100 12 7 12 100 12 12 12 100 12 8 12 100 12 8 12 100 6.25 12 3 12 100 12 1 12 100 12 1 12 100 12 10 83 12 12 100 12 3 12 100 3.125 12 8 67 12 9 75 12 1 8 67 12 10 83 12 1 10 83 12 10 83 a For genotypes (GTs) 1 to 6, the LODs determined by probit analysis were 5.4 IU/ml, 5.2 IU/ml, 5.4 IU/ml, 9.0 IU/ml, 4.7 IU/ml, and 4.7 IU/ml, respectivel y.
on May 16, 2020 by guest
http://jcm.asm.org/
[image:8.585.349.489.85.728.2]DISCUSSION
The clinical utility of HCV RNA quantification is well es-tablished (7, 24). Indeed, viral load monitoring before, during, and after antiviral therapy is crucial for the management of hepatitis C. Among other aspects, HCV RNA assays ideally should be sensitive, offer precise and reproducible quantifica-tion results, and be reliable across all the different HCV ge-notypes.
The lack of standardization among HCV quantification as-says has been overcome, in part, by the development of an IU standard (22, 23). However, the results differ significantly be-tween assays, despite the standardization to IU (5, 14, 24), and it remains unknown which assay calibration best matches the standard. In addition, relative quantification results and LODs for different genotypes may vary among assays, since standard-ization to IU and the calibration of assay sensitivity are based on genotype 1a (22, 23).
In this study, we evaluated and compared the performance characteristics of two quantitative real-time reverse transcrip-tion-PCR-based assays (RealTime HCV and CAP/CTM) and one signal amplification-based assay (the bDNA assay).
The quantification of undiluted clinical specimens by Real-Time HCV in comparison to that by the bDNA assay displayed a high correlation and good agreement among all genotypes tested. Mean differences were below⫾0.3 log10IU/ml.
Comparison of RealTime HCV and CAP/CTM showed a good correlation only for samples harboring genotypes 2, 3, and 5. The mean difference between RealTime HCV and CAP/CTM for specimens harboring genotype 1 was 0.72 log10
IU/ml; i.e., the quantification results obtained by the CAP/ CTM assay were found to be higher than those obtained by RealTime HCV. In contrast, the quantification results for sam-ples harboring genotype 4 obtained by the CAP/CTM assay were lower than those obtained by RealTime HCV (⫺1.27 log10IU/ml).
Comparison of CAP/CTM and the bDNA assay again showed a high concordance for samples harboring genotypes 2, 3, and 5, whereas a discrepancy for samples harboring geno-types 1 and 4 similar to that found for RealTime HCV and CAP/CTM was observed (higher levels of quantification for genotype 1 and lower levels of quantification for genotype 4 by CAP/CTM; 0.74 and⫺1.08 log10IU/ml, respectively).
Taken together, our results demonstrated an overall good correlation of the results of all assays. However, when the HCV RNA levels in samples harboring genotype 1 were mea-sured by CAP/CTM, they were always greater than the corre-sponding levels obtained by both RealTime HCV and the bDNA assay. In addition, a lower level of quantification by CAP/CTM was observed for samples harboring genotype 4. Despite the small number of samples available, these results are in line with those of a previous comparative study of Cobas TaqMan assays, the Cobas Amplicor Monitor assay, and the bDNA assay (24). More recently, Chevaliez et al. have de-scribed the overestimation of HCV RNA levels by CAP/CTM (7). However, in that study the global overquantification of HCV RNA of approximately 0.6 log10IU/ml was claimed for
all genotypes. In the present study, as well as in other previous studies, major differences in HCV RNA quantification
be-TABLE 6. LOD of the CAP/CTM assay based on clinical specimens representing genotypes 1 to 6 a
Sample dilution (IU/ml)
GT 1 GT 2 GT 3 GT 4 GT 5 GT 6 No. of samples No. of samples with positive measurements detectable at:
Hit rate (%)
No. of samples No. of samples with positive measurements detectable at:
Hit rate (%)
No. of samples No. of samples with positive measurements detectable at:
Hit rate (%)
No. of samples No. of samples with positive measurements detectable at:
Hit rate (%)
No. of samples No. of samples with positive measurements detectable at:
Hit rate (%)
No. of samples No. of samples with positive measurements detectable at:
Hit rate (%)
ⱖ 15 IU/ml ⬍ 15 and ⱖ 15 IU/ ml ⱖ 15 IU/ml ⬍ 15 and ⱖ 15 IU/ ml ⱖ 15 IU/ml ⬍ 15 and ⱖ 15 IU/ ml ⱖ 15 IU/ml ⬍ 15 and ⱖ 15 IU/ ml ⱖ 15 IU/ml ⬍ 15 and ⱖ 15 IU/ ml ⱖ 15 IU/ml ⬍ 15 and ⱖ 15 IU/ ml 50 12 12 12 100 12 11 11 92 12 11 12 100 12 1 11 92 12 12 12 100 12 12 12 100 25 12 11 11 92 12 7 12 100 12 2 12 100 12 12 100 12 4 12 100 12 12 12 100 12.5 12 10 12 100 12 10 83 11 1 11 100 12 8 67 12 11 92 12 10 12 100 6.25 12 2 12 100 12 11 92 12 10 83 12 5 42 12 12 100 12 11 92 3.125 12 1 11 92 12 8 67 12 9 75 12 4 33 12 5 42 12 1 10 83 aFor genotypes (GTs) 1 to 6, the LODs determined by probit analysis were 3.4 IU/ml, 44.4 IU/ml, 14.1 IU/ml, 40.5 IU/ml, 11.1 IU/ml, and 7.0 IU/ml, respect ively.
3888 VERMEHREN ET AL. J. CLIN. MICROBIOL.
on May 16, 2020 by guest
http://jcm.asm.org/
tween CAP/CTM, the bDNA assay, and RealTime HCV were restricted only to HCV genotype 1 and/or 4 (5, 17, 24, 30).
To date, the underquantification obtained for samples har-boring genotype 4 has not been fully understood (7, 24, 29). The mismatch of primers and/or the TaqMan probe and the target viral sequence is unlikely to be the only reason, since the recent introduction of a revised version of the manual High Pure system for specimen extraction, which is used together with the CTM amplification and detection system (version 2), has overcome the prior underestimation of the amounts of genotypes 2 through 5 without changing the set of primers and/or probes used. In fact, only changes in the ethanol con-centration of the wash buffer used for sample preparation and the temperature of the reverse transcription step were intro-duced (8). However, it has been suggested that suboptimal binding of oligonucleotides due to the secondary structure of the internal ribosome entry site and/or genotype-specific poly-morphisms within the highly conserved 5⬘nontranslated region may be responsible for underestimation of the quantity of genotype 4 by CAP/CTM (24, 29).
The clinical impact of genotype 4 underestimation by CAP/ CTM may be the greatest in Egypt and the Middle East, where this genotype is prevalent. However, this technical issue may have minor implications (i.e., the use of different cutoff values for low versus high viral loads at the baseline) for patient management if viral load testing before, during, and after an-tiviral therapy is always performed by the same assay and in the same laboratory.
Since the bDNA assay has a reported lower LOD of 615 IU/ml, it was not included in our sensitivity experiments. In the present study, RealTime HCV had a sensitivity of 16.8 IU/ml for the second international WHO standard HCV RNA (code 96/798) that was comparable to that of the CAP/CTM assay (10.3 IU/ml) and that correlated with previous results (17, 27, 29).
[image:10.585.44.541.83.151.2]The sensitivity of RealTime HCV was even lower for clinical specimens harboring genotypes 1 to 6 (4.7 to 9.0 IU/ml). In-terestingly, CAP/CTM had a limit of detection between 3.4 and 14.1 IU/ml for samples harboring genotypes 1, 3, 5, and 6, whereas samples harboring genotype 2 and 4 yielded higher probit values of 44.4 and 40.5 IU/ml, respectively. However, the results for the lower LODs of clinical specimens may vary between different samples of different HCV subtypes and origins. In a recent publication by Sizmann et al., equal lower LODs between 6.5 and 15.8 IU/ml for HCV genotypes 1 to 6 were reported (29). In that study, however, no comparison with other real-time PCR-based assays was performed, and the results may vary depending on the method used for assessment of the HCV RNA concentration in the original undiluted sample.
[image:10.585.42.284.196.675.2]FIG. 5. Linearities of RealTime HCV (A), the bDNA assay (B), and CAP/CTM (C), as assessed with five threefold serial dilutions of clinical specimens representing genotypes (GTs) 1 to 5. The expected and the observed HCV RNA concentrations are shown on the basis of known HCV RNA concentrations, as assessed by RealTime HCV.
TABLE 7. Quantification of the second international WHO standard HCV RNAa
Nominal input concn
(IU/ml关log10兴) of
WHO standard
RealTime HCV CAP/CTM
Mean (range) concn Mean difference
from WHO standard
Mean (range) concn Mean difference
from WHO standard
IU/ml log10transformed IU/ml log10transformed
1,500 (3.2) 920 (674–1,102) 3.0 (2.8–3.0) ⫺0.2 3,064 (2,857–3,096) 3.5 (3.5–3.5) 0.3 25,000 (4.4) 13,558 (8,997–16,102) 4.1 (4.0–4.2) ⫺0.3 43,489 (22,085–69,852) 4.6 (4.3–4.8) 0.2 a
The second international WHO standard HCV RNA is code 96/798.
on May 16, 2020 by guest
http://jcm.asm.org/
Generally, patients who may have tested HCV RNA nega-tive during or after antiviral therapy by older assays with lower LODs ofⱖ50 IU/ml may test HCV RNA positive by highly sensitive HCV RNA assays. Highly sensitive HCV RNA assays are now used in clinical practice to define a virologic nonre-sponse to antiviral therapy and to predict relapses after anti-viral therapy (10, 18, 19, 25). In addition, the large dynamic range of the real-time PCR-based assays allows precise HCV RNA quantification without predilution, which was frequently required with previous standard PCR-based assays.
As discussed above, previous studies have shown differences of 0.5 to 0.7 log10IU/ml for clinical specimens harboring
ge-notype 1 between different assays (7, 17, 24). Although the bDNA assay, RealTime HCV, and CAP/CTM are calibrated to the WHO standard, it remains unclear which of the assays corresponds best to the WHO standard on direct comparison. In order to investigate whether one of the assays over- or underestimates the true HCV RNA concentration, we performed for the first time a direct comparison of the two real-time PCR-based assays with the WHO standard.
The standard, produced by the National Institute for Bio-logical Standards and Control (South Mimms, United King-dom), is available only at an assigned unitage of 50,000 IU/ml. Two concentrations (25,000 and 1,500 IU/ml) were chosen and tested in multiple aliquots in a single run each.
The present analysis revealed a consistently lower level of quantification of the WHO standard by RealTime HCV (⫺0.2 to⫺0.3 log10IU/ml) and a consistently higher level of
quan-tification of the WHO standard by CAP/CTM (⫹0.2 to⫹0.3 log10 IU/ml). Thus, the total difference adds up to
approxi-mately 0.5 log10IU/ml, and this corresponds to the findings of
previous clinical studies that evaluated CAP/CTM versus the bDNA assay and RealTime HCV (7, 17, 24).
In conclusion, the real-time PCR-based HCV RNA assays showed comparable, linear HCV RNA quantification abilities and a comparable sensitive detection of all HCV genotypes, with the exception of genotypes 1 and 4. The previously re-ported differences in the absolute quantification of samples harboring HCV genotype 1, which showed higher quantifica-tion results by CAP/CTM and lower quantificaquantifica-tion results by the bDNA assay and/or RealTime HCV, resulting in a total difference of approximately 0.5 to 0.7 log10IU/ml, were
con-firmed (7, 17, 24). Comparative analysis with the current WHO standard suggests that the differences may be explained by the different calibration methods used and/or the different WHO standards used (RealTime HCV is standardized against the second international WHO standard HCV RNA [code 96/798], whereas CAP/CTM is standardized against the first interna-tional WHO standard HCV RNA [code 96/790]).
REFERENCES
1.Andonov, A., and R. K. Chaudhary.1995. Subtyping of hepatitis C virus
isolates by a line probe assay using hybridization. J. Clin. Microbiol.33:254–
256.
2.Berg, T., V. Weich, G. Teuber, H. Klinker, B. Moeller, J. Rasenack, H. Hinrichsen, T. Gerlach, U. Spengler, P. Buggisch, H. Balk, M. Zankel, C. Sarrazin, S. Zeuzem, et al.2007. Time to HCV RNA negativation in hepa-titis C virus (HCV) type 1-infection during PEG-interferon-alpha-2B plus ribavirin therapy. Differences in relation to the assay sensitivity. Hepatology 46:360A.
3.Bland, J. M., and D. G. Altman. 1986. Statistical methods for assessing
agreement between two methods of clinical measurement. Lanceti:307–310.
4.Bouchardeau, F., J. F. Cantaloube, S. Chevaliez, C. Portal, A. Razer, J. J. Lefrere, J. M. Pawlotsky, P. De Micco, and S. Laperche.2007. Improvement
of hepatitis C virus (HCV) genotype determination with the new version of
the Inno-LiPA HCV assay. J. Clin. Microbiol.45:1140–1145.
5.Caliendo, A. M., A. Valsamakis, Y. Zhou, B. Yen-Lieberman, J. Andersen, S. Young, A. Ferreira-Gonzalez, G. J. Tsongalis, R. Pyles, J. W. Bremer, and N. S. Lurain.2006. Multilaboratory comparison of hepatitis C virus viral load
assays. J. Clin. Microbiol.44:1726–1732.
6.Chen, Z., and K. E. Weck.2002. Hepatitis C virus genotyping: interrogation
of the 5⬘untranslated region cannot accurately distinguish genotypes 1a and
1b. J. Clin. Microbiol.40:3127–3134.
7.Chevaliez, S., M. Bouvier-Alias, R. Brillet, and J. M. Pawlotsky.2007. Overes-timation and underesOveres-timation of hepatitis C virus RNA levels in a widely used
real-time polymerase chain reaction-based method. Hepatology46:22–31.
8.Colucci, G., J. Ferguson, C. Harkleroad, S. Lee, D. Romo, S. Soviero, J. Thompson, M. Velez, A. Wang, Y. Miyahara, S. Young, and C. Sarrazin. 2007. Improved COBAS TaqMan hepatitis C virus test (version 2.0) for use with the High Pure system: enhanced genotype inclusivity and performance
characteristics in a multisite study. J. Clin. Microbiol.45:3595–3600.
9.Davis, G. L., J. B. Wong, J. G. McHutchison, M. P. Manns, J. Harvey, and J. Albrecht.2003. Early virologic response to treatment with peginterferon
alfa-2b plus ribavirin in patients with chronic hepatitis C. Hepatology38:
645–652.
10.Ferenci, P., H. Laferl, T. M. Scherzer, A. Maieron, M. Gschwantler, H. Brunner, R. Hubmann, M. Bischof, K. Staufer, C. Datz, P. Steindl-Munda, and H. Kessler.2006. Customizing treatment with peginterferon alfa-2a
(40kd) (PegasysR) plus ribavirin (CopegusR) in patients with HCV genotype
1 or 4 infection. Interim results of a prospective randomized trial. Hepatol-ogy44:336A.
11.Ferenci, P., M. W. Fried, M. L. Shiffman, C. I. Smith, G. Marinos, F. L. Goncales, Jr., D. Haussinger, M. Diago, G. Carosi, D. Dhumeaux, A. Craxi, M. Chaneac, and K. R. Reddy.2005. Predicting sustained virological re-sponses in chronic hepatitis C patients treated with peginterferon alfa-2a (40
KD)/ribavirin. J. Hepatol.43:425–433.
12.Fried, M. W., M. L. Shiffman, K. R. Reddy, C. Smith, G. Marinos, F. L. Goncales, Jr., D. Haussinger, M. Diago, G. Carosi, D. Dhumeaux, A. Craxi, A. Lin, J. Hoffman, and J. Yu.2002. Peginterferon alfa-2a plus ribavirin for
chronic hepatitis C virus infection. N. Engl. J. Med.347:975–982.
13.Hadziyannis, S. J., H. Sette, Jr., T. R. Morgan, V. Balan, M. Diago, P. Marcellin, G. Ramadori, H. Bodenheimer, Jr., D. Bernstein, M. Rizzetto, S. Zeuzem, P. J. Pockros, A. Lin, and A. M. Ackrill.2004. Peginterferon-alpha2a and ribavirin combination therapy in chronic hepatitis C: a random-ized study of treatment duration and ribavirin dose. Ann. Intern. Med. 140:346–355.
14.Halfon, P., M. Bourliere, G. Penaranda, H. Khiri, and D. Ouzan.2006. Real-time PCR assays for hepatitis C virus (HCV) RNA quantitation are adequate for clinical management of patients with chronic HCV infection.
J. Clin. Microbiol.44:2507–2511.
15.Jensen, D. M., T. R. Morgan, P. Marcellin, P. J. Pockros, K. R. Reddy, S. J. Hadziyannis, P. Ferenci, A. M. Ackrill, and B. Willems.2006. Early identi-fication of HCV genotype 1 patients responding to 24 weeks peginterferon
alpha-2a (40 kd)/ribavirin therapy. Hepatology43:954–960.
16.Manns, M. P., J. G. McHutchison, S. C. Gordon, V. K. Rustgi, M. Shiffman, R. Reindollar, Z. D. Goodman, K. Koury, M. Ling, and J. K. Albrecht.2001. Peginterferon alfa-2b plus ribavirin compared with interferon alfa-2b plus ribavirin for initial treatment of chronic hepatitis C: a randomised trial.
Lancet358:958–965.
17.Michelin, B. D., Z. Muller, E. Stelzl, E. Marth, and H. H. Kessler.2007. Evaluation of the Abbott RealTime HCV assay for quantitative detection of
hepatitis C virus RNA. J. Clin. Virol.38:96–100.
18.Mihm, U., W. P. Hofmann, B. Kronenberger, M. Wagner, S. Zeuzem, and C. Sarrazin.2005. Highly sensitive hepatitis C virus RNA detection assays for decision of treatment (dis)continuation in patients with chronic hepatitis C.
J. Hepatol.42:605–606.
19.Morishima, C., T. R. Morgan, J. E. Everhart, E. C. Wright, M. L. Shiffman, G. T. Everson, K. L. Lindsay, A. S. Lok, H. L. Bonkovsky, A. M. Di Bisceglie, W. M. Lee, J. L. Dienstag, M. G. Ghany, and D. R. Gretch.2006. HCV RNA detection by TMA during the hepatitis C antiviral long-term treatment
against cirrhosis (Halt-C) trial. Hepatology44:360–367.
20.Nadarajah, R., G. Y. Khan, S. A. Miller, and G. F. Brooks.2007. Evaluation
of a new-generation line-probe assay that detects 5⬘untranslated and core
regions to genotype and subtype hepatitis C virus. Am. J. Clin. Pathol. 128:300–304.
21.Ross, R. S., S. Viazov, S. Sarr, S. Hoffmann, A. Kramer, and M. Roggendorf. 2002. Quantitation of hepatitis C virus RNA by third generation branched
DNA-based signal amplification assay. J. Virol. Methods101:159–168.
22.Saldanha, J., A. Heath, C. Aberham, J. Albrecht, G. Gentili, M. Gessner, and G. Pisani.2005. World Health Organization collaborative study to establish a replacement WHO international standard for hepatitis C virus RNA
nu-cleic acid amplification technology assays. Vox Sang.88:202–204.
23.Saldanha, J., N. Lelie, M. W. Yu, and A. Heath.2002. Establishment of the first World Health Organization international standard for human
parvovi-rus B19 DNA nucleic acid amplification techniques. Vox Sang.82:24–31.
24.Sarrazin, C., B. C. Gartner, D. Sizmann, R. Babiel, U. Mihm, W. P. Hofmann,
3890 VERMEHREN ET AL. J. CLIN. MICROBIOL.
on May 16, 2020 by guest
http://jcm.asm.org/
M. von Wagner, and S. Zeuzem.2006. Comparison of conventional PCR with real-time PCR and branched DNA-based assays for hepatitis C virus RNA quantification and clinical significance for genotypes 1 to 5. J. Clin. Microbiol. 44:729–737.
25.Sarrazin, C., G. Teuber, R. Kokka, H. Rabenau, and S. Zeuzem.2000. Detection of residual hepatitis C virus RNA by transcription-mediated am-plification in patients with complete virologic response according to
poly-merase chain reaction-based assays. Hepatology32:818–823.
26.Sarrazin, C., A. Dragan, B. C. Ga¨rtner, M. S. Forman, S. Traver, S. Zeuzem, and A. Valsamakis. 2008. Evaluation of an automated, highly sensitive, real-time PCR based assay (Cobas Ampliprep/Cobas TaqMan) for
quanti-fication of HCV RNA. J. Clin. Virol.43:162–168.
27.Schutten, M., E. Fries, C. Burghoorn-Maas, and H. G. Niesters.2007. Evaluation of the analytical performance of the new Abbott RealTime RT-PCRs for the quantitative detection of HCV and HIV-1 RNA. J. Clin. Virol. 40:99–104.
28.Shiffman, M. L., S. Pappas, B. Bacon, E. Godofsky, D. Nelson, H. Harley, M. Diago, A. Lin, G. Hooper, and S. Zeuzem.2006. Utility of virological re-sponse at weeks 4 and 12 in the prediction of SVR rates in genotype 2/3 patients treated with peginterferon-alfa-2a (40KD) plus ribavirin: findings
from ACCELERATE. Hepatology44:316A–317A.
29.Sizmann, D., C. Boeck, J. Boelter, D. Fischer, M. Miethke, S. Nicolaus, M. Zadak, and R. Babiel.2007. Fully automated quantification of hepatitis C virus (HCV) RNA in human plasma and human serum by the Cobas
AmpliPrep/Cobas TaqMan system. J. Clin. Virol.38:326–333.
30.Tuaillon, E., A.-M. Mondain, L. Ottomani, L. Roudie`re, P. Perney, M.-C. Picot, F. Se´guret, F. Blanc, D. Larrey, P. Van de Perre, and J. Ducos.2007. Impact of hepatitis C virus (HCV) genotypes on quantification of HCV RNA in serum by Cobas AmpliPrep/Cobas TaqMan HCV test, Abbott HCV RealTime assay [corrected], and Versant HCV RNA assay. J. Clin.
Micro-biol.45:3077–3081.