DETECTION OF VOLTAGE DISTURBANCES IN POWER QUALITY USING WAVELET TRANSFORMS
NOR ASRINA BINTI RAMLEE
A project report submitted in
fulfilment of the requirement for the award of the Degree of Master of Electrical Engineering
Faculty of Electrical and Electronic Engineering Universiti Tun Hussein Onn Malaysia
v
ABSTRACT
Power quality has cause a great concern to electric utilities with the growing use of sensitive and susceptive electronic and computing equipment. The best analysis on power quality is vital to provide better service to customers. This paper presents the detection of voltage sag and voltage swell event using four types of mother wavelet namely Haar, Dmey, Daubechies and Symlet to identify the most accurate mother. The method is developed by applying time domain signal analysis using Discrete Wavelet Transform (DWT) as a detection tool in MATLAB. The actual interrupted signals were obtained from 22kv transmission line in Skudai, Johor Bahru. They will be decomposed through the wavelet mothers. The best mother is the one that capable to detect the time location of the event accurately.
ABSTRAK
vii
CONTENTS
TITLE i
DECLARATION ii
DEDICATION iii
ACKNOWLEDGEMENT iv
ABSTRACT v
ABSTRAK vi
CONTENTS vii
LIST OF TABLES x
LIST OF FIGURES xi
LIST OF SYMBOLS AND ABBREVIATIONS xiii APPENDICES xiv
CHAPTER 1 INTRODUCTION 1
1.1 Introduction 1
1.2 Project objective 2
1.3 Problem statement 2
1.4 Project scope 3
1.4.1 Voltage sag 3
1.4.2 Voltage swell 3
1.4.3 Mother wavelet function 4
1.5 Literature review 4
1.6 Structure of the thesis 7
CHAPTER 2 POWER QUALITY DISTURBANCES 9
2.1 Introduction 9
2.3 Short-duration voltage variations 12
2.3.1 Voltage sag 12
2.3.1.1 Common causes and effect of
voltage sags 13
2.3.2 Voltage Swell 14
2.3.2.1 Common causes and effects of
voltage swells 15
2.4 Long-duration voltage variations 15
2.4.1 Overvoltage 16
2.4.2 Undervoltage 17
2.5 Power disturbances detection review 18
2.5.1 Classical technique 18
2.5.2 Modern technique 21
2.5.2.1 Discrete wavelet transform 21 CHAPTER 3 DISCRETE WAVELET TRANSFORM AND
MULTIRESOLUTION ANALYSIS 23
3.1 Introduction 23
3.2 The discrete wavelet transform 24
3.3 Multi-resolution analysis decomposition 26
CHAPTER 4 MOTHER WAVELETS 31
4.1 Introduction 31
4.2 Mother wavelets 33
4.2.1 Haar 34
4.2.2 Dmey 36
4.2.3 Daubechies 38
4.2.4 Symlets 41
4.3 Mother wavelets properties 45
4.3.1 Symmetric 45
4.3.2 Orthogonal 45
4.3.3 Biorthogonal 47
CHAPTER 5 METHODOLOGY 48
5.1 Extracting data from RPM 48
5.2 MATLAB signal plotting 51
ix 5.3.1 Activating wavelet 1-D window 54
5.3.2 Disturbance signals analysis 57
5.4 Time location detection 58
CHAPTER 6 DATA ANALYSIS AND RESULTS 62
6.1 Decomposition signals 62
6.2 Time locations 65
6.3 Percentage of difference 67
CHAPTER 7 CONCLUSION AND DISCUSSION 70
7.1 Conclusion of the results 70
7.2 Discussion on literatures and the results 71
7.3 Future works 73
7.4 Summary 74
REFERENCES 76
LIST OF TABLES
2.1 Short-duration variation category and typical event
characteristic defined by the IEEE 1159 11 2.2 Long-duration variation category and typical event
characteristic defined by the IEEE 1159 11 4.1 Scaling function diagram for Daubechies wavelet
family 40
4.2 Wavelet function diagram for Daubechies wavelet
family 41
4.3 Scaling function diagram for Symlet wavelet family 43 4.4 Wavelet function diagram for Symlet wavelet family 44 6.1 Time location for original voltage sag signal peaks
and decomposed signal peaks for each mother
wavelet 65 6.2 Time location for original voltage swell signal peaks
and decomposed signal peaks for each mother
wavelet 66 6.3 Percentage difference of the time locations between
the signal peaks of the decomposed and the original
voltage sag signal. 68
6.4 Percentage difference of the time locations between the signal peaks of the decomposed and the original
voltage swell signal. 68
7.1 Comparison between voltage sag and voltage swell
xi
LIST OF FIGURES
2.1 Voltage sag signal 12
2.2 Voltage swell signal 14
2.3 Overvoltage signal 16
2.4 Undervoltage signal 17
2.5 CBEMA curve 18
2.6 ITIC curve 20
4.1 Haar wavelet function diagram 34
4.2 Haar scaling function diagram 35
4.3 Dmey wavelet function diagram 37
4.4 Dmey scaling function diagram 37
5.1 CBEMA curve for the actual data 48 5.2 The actual sample of voltage sag 49 5.3 The actual sample of voltage swell 49 5.4 RPM Power Recorder System Interface 50
5.5 MATLAB workspace 51
5.6 Import Wizard with the list of data 51 5.7 Import Wizard with folders in the Excel file 52 5.8 MATLAB workspace with data folder 52 5.9 Voltage sag signal from MATLAB 53 5.10 Voltage swell signal from MATLAB 53 5.11 MATLAB menus to operate wavelet window 55
5.12 Wavelet Toolboxes GUI 56
5.13 One-Dimensional Discrete Wavelet Analysis Tool
Interface 56
5.15 Voltage sag analysis using HAAR mother wavelet 58 5.16 Window for choosing signal to be enlarged 59 5.17 Enlarged version of original voltage sag signal 59 5.18 Time location for original voltage sag signal 60 5.19 Enlarged version of output signal for level 2 of
HAAR analysis 61
6.1 Output for level 2 of decomposition signals for
voltage sag 63
6.2 Output for level 2 of decomposition signals for
xiii
LIST OF SYMBOLS AND ABBREVIATIONS
ANN - Artificial Neural Network ATP - Alternative Transient Program
CBEMA - Computer Business Equipment Manufacturers Association
CR - Compression Ratio
CWT - Continuous Wavelet Transform DWT - Discrete Wavelet Transform ER - Energy Ratio
ETP - Electromagnetic Transients Program FFT - Fast Fourier Transform
FIR - Finite Impulse Response
HD-PLC - High Definition Power Line Communication ITIC - Information Technology Industry Council MRA - Multi Resolution Analysis
MSE - Mean Square Error
OFDM - Orthogonal Frequency-Division Multiplexing PNN - Probabilistic Neural Network
PSNR - Peak Signal to Noise Ratio RPM - Reliable Power Meter
SLGF - Single Line-To-Ground Fault STFT - Short Time Fourier transform
݂ - Bandwidth of the signal at every level OF decomposition
݃ሾ݊ሿ - Highpass filter impulse response hሾ݊ሿ - Lowpass filter impulse response ߶ሺݐሻ - Scaling Function
LIST OF APPENDICES
APPENDIX TITLE PAGE
A MRA decomposition process 78
B Flow chart for extracting data from RPM 79 C Flow chart for MATLAB signal plotting 80 D Flow chart for activating Wavelet 1-D Window 81 E Flow chart for power disturbance analysis 82 F1 Voltage Sag analysis using Dmey mother wavelet 83 F2 Voltage Sag analysis using Db2 mother wavelet 84 F3 Voltage Sag analysis using Db3 mother wavelet 85 F4 Voltage Sag analysis using Db4 mother wavelet 86 F5 Voltage Sag analysis using Sym2 mother wavelet 87 F6 Voltage Sag analysis using Sym3 mother wavelet 88 F7 Voltage Sag analysis using Sym4 mother wavelet 89 F8 Voltage Swell analysis using Haar mother wavelet 90 F9 Voltage Swell analysis using Dmey mother wavelet 91 F10 Voltage Swell analysis using Db2 mother wavelet 92 F11 Voltage Swell analysis using Db3 mother wavelet 93 F12 Voltage Swell analysis using Db4 mother wavelet 94 F13 Voltage Swell analysis using Sym2 mother wavelet 95 F14 Voltage Swell analysis using Sym 3 mother wavelet 96 F15 Voltage Swell analysis using Sym4 mother wavelet 97 G Comparison between voltage sag and voltage swell
CHAPTER 1
INTRODUCTION
1.1 Introduction
2
1.2 Project objective
The main objective of this study is to figure out the most suitable mother wavelet to be exercised in detection of the power quality disturbances occurred at 22kv transmission line in Skudai, Johor Bahru. It is important in order to develop the best power disturbance detection system for the transmission line.
1.3 Problem statement
The field of study in this research is related mainly to power quality disturbances issues. Since it is unable to avoid, something must be done to provide better power quality service. In order to do that, the power supplied to the system must be analyzed based on the types of disturbances occurred in the system. Before the analyzing process, the very important process is power disturbances detection.
As mentioned earlier, power quality is equal to voltage quality. So it is reasonable to conduct an analysis on the voltage deviations such as voltage sags and swells in the electrical system. It is well known that the main power quality disturbances are due to the widely used of electric and electronics equipments and it is a growing amount nowadays. So, before poor power quality supplied to the loads, the power quality from the distribution line must be monitored. That is why 22kv transmission line is chosen as the raw data to be detected.
3
1.4 Project scopes
This study is focusing on detection of voltage sags and swells which occurred at 22kv transmission line based in Skudai, Johor Bahru . The raw data will be processed by using Reliable Power Meter (RPM) equipments to extract the interrupted signal which later to be decomposed using four mother wavelets of DWT in MATLAB. Haar, Dmey, Daubechies and Symlet are the selected mother wavelets. Comparison of the performance or the capability of the mother wavelets to detect the time location of the event accurately will be made to find out the best mother wavelet.
1.4.1 Voltage sag
As defined by IEEE Standard 1159-1995, IEEE Recommended Practice for Monitoring Electric Power Quality, voltage sag is a reduction in rms voltage on ac power system at the power frequency to between 0.1 and 0.9 pu for a short period of time between half cycle and one minute. It is the most common disturbance and very important aspect of power quality. It is really hard to predict because it occurs randomly depend on the source of the system faults.
1.4.2 Voltage swell
4
with a temporary voltage rise on the normal phases. It is not as common as voltage sag and is characterized also by both the magnitude and duration.
1.4.3 Mother wavelet functions
Haar wavelet is the first known and simplest wavelet. It is discontinuous, and resembles a step function. It represents the same wavelet as Daubechies, Db1. It has asymmetric, orthogonal, biorthogonal properties of decomposition. Dmeywavelet is a Finite Impulse Response (FIR) based approximation of the Meyer wavelet. It allows fast wavelet coefficients calculation using Discrete Wavelet Transform (DWT). It has symmetric, orthogonal and biorthogonal properties. Daubechies wavelets have no explicit expression except for Db1, which is the Haar wavelet. It has asymmetric, orthogonal and biorthogonal properties of decomposition. Daubechies proposes modifications of the wavelets that increase their symmetry while retaining great simplicity. Daubechies is a big family wavelet. There are a lot of members in the family. Yet, this paper presents only three members of the family namely Db2, Db3 and Db4. The Symlets are nearly symmetrical wavelets proposed by Daubechies as modifications to the Db family. The properties of the two wavelet families are similar but it is more symmetrical compared to Daubechies. For Symlets, this paper presents three members of the family; Sym2, Sym3 and Sym 4.
1.5 Literature review
5
sags, swells and harmonics. Then they applied only the first level of decomposition for both wavelets to detect the disturbances. Finally they found that Daubechies 4 is better than Haar in order to determine the time in which the disturbance appears and disappears because there are two maxims of the coefficients in such times.
While, Harish Kashyap and Jayachandra Shenoy from India proposed automation of power system fault identification using information conveyed by the wavelet analysis of power system transients. The work focused on identification of simple power system faults. Different types of faults were simulated using Electromagnetic Transient Analysis in Mipower package. Different types of faults were created and the transients were recorded for analysis using Meyer wavelet until the 4th level. They obtained that the application of wavelet transform to determine the type of fault and its automation incorporating Probabilistic Neural Network (PNN) could achieve an accuracy of 100% for all type of faults.
In June 2010, Anoop, Gunasekar, Bensiker and Uma proposed a novel technique for detecting and characterizing disturbances of voltage swell in power systems based on wavelet transforms. This proposed scheme is implemented using MATLAB, Simulink, DSP and Wavelet toolboxes. Simulated source signal with noise was first de-noised and then wavelet transform is applied using Daubechies 4. The signal was decomposed until level 4 that voltage disturbance is detected and its duration is determined. The combination of an adaptive prediction filter based sub-band decomposition structure with a rule based histogram analysis block produce successful detection and classification results.
In the year of 2009, Sudipta, Arindam and Abhijit presented a method that characterizes power quality disturbances. The discrete wavelet transform has been used to detect and analyze power quality disturbances. The disturbances of interest include sag, swell, outage and transient. A power system network has been simulated by Electromagnetic Transients Program. Voltage waveforms at strategic points have been obtained for analysis, which includes different power quality disturbances. Then level 4 of Daubechies 4 mother wavelet has been chosen to perform feature extraction.
6
location on transmission lines. Fault simulation of 380 kV transmission line was carried out in Alternative Transient Program (ATP). The DWT was used for data preprocessing and later used for training and testing ANN. Five types of mother wavelets, Daubechies (db5), Biorthogonal (bior5.5), Coiflets (coif5), Symlets (sym5) and Reverse Biorthogonal (rbio5.5) have been considered for signal processing to identify a suitable wavelet family that is more appropriate for use in estimating fault location. They found that better results can be produced using level 3 of Daubechies ‘db5’ wavelet. The use of ANN as a pattern classifier to simulate a fault locator has been also investigated and very satisfactory.
Sharmeela, Mohan, Uma and Baskaran from University of Anna, Chennai proposed a method to detect and classify power quality disturbances using wavelets. The proposed algorithm uses different wavelets and 8th level of decomposition each for a particular class of disturbance. They are DMeyer, Daubechies, Sym5, Coif, Bior and Haar wavelets. A qualitative comparison of results shows the advantages and drawbacks of each wavelet when applied to the detection of the disturbances. Can be concluded that, Db3 detects transients, Db10 and Sym8 detects voltage flicker, Dmey detects harmonics and Db4 detects voltage Sag/Swell accurately. This method is tested for a large class of test conditions simulated in MATLAB.
7
1.6 Structure of the thesis
This thesis consists of six chapters overall. As explained above, Chapter 1 describes the surface of this project. There are a few lines of introduction about power quality studies for the beginning. Then, continued with statements of project objective and the problem statement. The project scope in this first chapter explained some terms that going to be used in this entire project. Literature review also discussed in Chapter 1 as it is one of the important element in this paper.
Chapter 2 will tell us about the detail of power disturbances involve in this paper which are voltage sag and voltage swell. It also consists of IEEE standard for power disturbance as a reference. Since this project involve of power disturbance detection, there is a need to review the approaches that are being used before and today. The detail of the implementation of DWT and the multi resolution analysis (MRA) decomposition process will be explained in Chapter 3. This includes the mathematics equations of DWT and MRA. For more details, the flow chart of MRA decomposition process for every label also describe in this third chapter. For Chapter 4, all the mother wavelets exercised in this paper will be comprehensively explained. As mentioned before the mother wavelets are Haar, Dmey, Daubechies and Symlet. The explanation is involved of mathematic equations, properties and the corresponding diagram of the mother wavelets.Chapter 5 describes about the methodology implemented in this project. Starting from the method used to extract data from RPM. Then, continued with the MATLAB process. The MATLAB process is including plotting the interrupted signals, wavelet toolboxes for analysis and the time location detection.
8
CHAPTER 2
POWER QUALITY DISTURBANCES
2.1 Introduction
Power quality can be defined as the limits of electrical properties that allows electrical system to be well functioned without any significant loss of performance. Without the proper power in electrical system, it may cause many problems to an electrical device or load such as malfunctions, instabilities, short life time or may not operate at all. The quality of electric power has become an important issue nowadays. Customers, in particular have become less tolerant when it comes to poor power quality service. Poor power quality is normally caused by some disturbances which are well known as power quality disturbances. These disturbances degrade the performance and efficiency of customer loads especially power electronic loads.
10
Power quality deviations are commonly caused by many types of disturbances such as frequency variations, slow and fast voltage variations, flickers, voltage sags, voltage swells, harmonics and transients. The growing use of microprocessors in appliances, office equipment and process controls has outburst awareness of the power quality demands for equipments and the unpredictability of its supply. Poor power quality supply can cause damage to electrical equipments and machinery or even fail to operate. A few seconds of outage or a surge can bring any business down for hours or days. This problem has led to a growing interest in the study of power quality.
The study of power quality is covered from the process of disturbances detection until the analysis of the disturbances. Many methods or techniques are found in order to implement all the process. Namely, wavelet transforms, Fourier transform, S- Transform, Multiresolution Analysis, Fuzzy Logic, Neural Network, Hidden Markov model and many more methods which are build from different mathematic equations or tools.
2.2 Power quality disturbances
Power quality disturbances, problems, or events are terms used to describe voltage or current deviations from its ideal waveform. For most application, a good power quality system supplies pure sinusoidal waveform of electric power with the rated frequency and nominal voltage. Power quality disturbances are the variation of these parameters. These disturbances are bound to occur and can cause failure of loads or equipments. Some may only briefly interfere with the most highly sensitive equipment. Others, due to extensive damage on our electric delivery system, could result in the total loss of power for days. Electronic devices are designed to be operated from a uniform clean sine wave. If the AC wave becomes disturbed or distorted, electronics may send false signals, and this conversion process becomes disoriented, disrupted or even damaged.
11
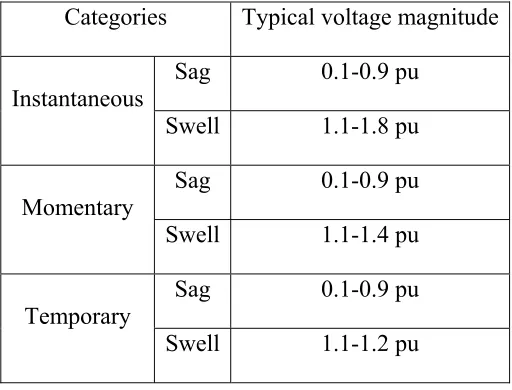
[image:22.612.200.456.206.401.2]which are originally enshrined in Tables 5.3 and 5.5 from IEEE P1159.1 Guide for Recorder and Data Acquisition Requirements for Characterization of Power Quality Events.
Table 2.1: Short-duration variation category and typical event characteristic defined by the IEEE 1159
Categories Typical voltage magnitude
Instantaneous
Sag 0.1-0.9 pu
Swell 1.1-1.8 pu
Momentary Sag 0.1-0.9 pu
Swell 1.1-1.4 pu
Temporary
Sag 0.1-0.9 pu
[image:22.612.214.441.487.569.2]Swell 1.1-1.2 pu
Table 2.2: Long-duration variation category and typical event characteristic defined by the IEEE 1159
Categories Typical voltage magnitude
Overvoltage 1.1-1.2 pu
12
Power quality disturbances are categorized because that there are different ways to solve them depending on the particular variation and classifying will also help in implementing the proper approach and analysis.
2. 3 Short-duration voltage variations
Referring to Table 2.1, there are three types of short-duration voltage variations, namely, instantaneous, momentary and temporary, depending on its duration. Short-duration voltage variations are caused by fault conditions, energization of large loads, which require high starting currents or loose connections in power wiring. The fault condition can be close to or remote from the point of interest. These short duration voltage variations can adversely affect equipment, particularly variable speed drives, computers, programmable logic controls, and motor contactors. Normally short duration voltage variations were not a major concern before the wide-spread use of electronic equipment. The increased use of sophisticated electronic equipment has made it necessary for utility customers to take steps to mitigate the affect of any voltage variations.
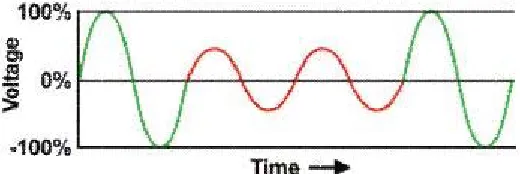
[image:23.612.199.459.552.639.2]2.3.1 Voltage Sag
13
Voltage sag as shown in Figure 2.1 is a reduction to between 0.1 and 0.9 pu in root-mean-square (rms) voltage or current at the power frequency for a short period of time from 0.5 cycles to 1 min. Voltage sag durations are subdivided into three categories: instantaneous (0.5 cycle to 30 cycles), momentary (30 cycles to 3 seconds), and temporary (3 seconds to 1 minute). These durations are intended to correlate with typical protective device operation times as well as duration divisions recommended by international technical organizations. Sags are widely recognized as among the most common and important aspects of power quality problems affecting commercial and industrial customers
A lot of research has been done on the monitoring of voltage disturbance. “An industrial monitoring program determined an 87% of voltage disturbances could be associated to voltage sags.” (Siew Leng, 2001). This shows that voltage sags are particularly troublesome because they are virtually unnoticeable by observing lighting blinks and they occur randomly and are difficult to predict.
2.3.1.1 Common causes and effect of voltage sags
Voltage sags are generally caused by utility equipment problems, accidental damage, animal contact, weather or tree interference which normally leads to system faults on the transmission or distribution system. For example, a fault on a parallel feeder circuit will result in a voltage drop at the substation bus that affects all of the other feeders until the fault is cleared. The same concept would apply for a fault somewhere on the transmission system. Most of the faults on the utility transmission and distribution system are single-line-to-ground (SLG) faults. Voltage sags are normally associated with system faults on the distribution system, sudden increase in system loads, lightning strikes or starting of large load like induction motors. One of the most common causes of faults occurring on high-voltage transmission systems is a lightning strike.
14
voltage sag event. While for more severe cases, possible effects of voltage sags would be system shutdown or reduce efficiency and life span of electrical equipment, particularly motors. According to Pinnacle West Capital Corporation (2000),
When a short circuit occurs on one of the feeders, all customers on the faulted feeder will experience a complete loss of voltage. Customers connected to adjacent feeders may see the voltage sag to 60% of normal voltage.
In addition, Ian K.P. Ross (2006) found that when there is a fault caused by a lightning strike, the voltage can sag to 50 % of the standard range and can last from four to seven cycles. Most loads will be tripped off when encounter this type of voltage level. Therefore, such disturbances are particularly problematic for industry where the malfunction of a device may result in huge financial losses.
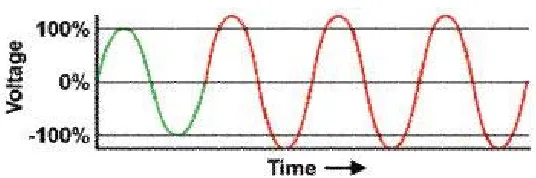
[image:25.612.197.462.399.485.2]2.3.2 Voltage swell
Figure 2.2 Voltage swell signal
15
2.3.2.1 Common causes and effects of voltage swells
A voltage swell can be due to ungrounded or floating delta systems, where the sudden change in ground reference that result in a voltage rise on the ungrounded phases. In the case of a voltage swell due to a SLGF on the system, the result is a temporary voltage rise on the unfaulted phases, which last for the duration of the fault. Voltage swells are always caused by an abrupt reduction in load on a circuit with a poor or damaged voltage regulator, although they can also be caused by a damaged or loose neutral connection. They can also be caused by the deenergization or switching off a very large load. The abrupt interruption of current can generate a large voltage, per the formula: V = L di/dt, where L is the inductance of the line and di/dt is the change in current flow. Moreover, energizing a large capacitor bank can also cause a voltage swell.
During a fault condition, the severity of a voltage swell is very much dependent on the system impedance, location of the fault and grounding. The effect of this type of disturbance would be hardware failure in the equipment due to overheating. It may cause breakdown of components on the power supplies of the equipment, though the effect may be a gradual or accumulative effect. Besides that, it can cause control problems and hardware failure in the equipment, due to overheating that could eventually result to shutdown. Also, electronics and other sensitive equipment are prone to damage due to voltage swell.
2.4 Long-duration voltage variations
16
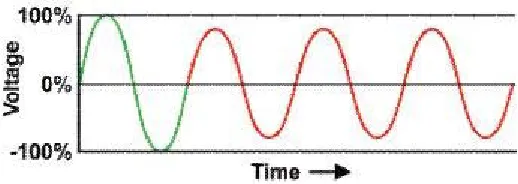
[image:27.612.181.449.129.218.2]2.4.1 Overvoltage
Figure 2.3: Overvoltage signal
Overvoltage is classified as Long-duration voltage variation event, which is defined by the IEEE 1159 as an increase in the rms ac voltage typically to 110% - 120% of nominal power frequency for duration longer than one minute as shown in Figure 2.3 above. Overvoltage transients can be due to excessive correction for voltage drop on the transmission and distribution systems such as energizing several capacitor banks or when switching off a large load. They also often the result when circuit breakers operate, incorrect tap settings on transformers or when lightning hits a feeder. These occur mainly because either the voltage controls are inadequate or the system is too weak for voltage regulation. Possible effect could be hardware failure in the equipment due to overheating.
17
[image:28.612.187.446.133.225.2]2.4.2 Undervoltage
Figure 2.4: Undervoltage signal
Figure 2.4 above shows under voltage signal which is also known as brownout. Undervoltage is described by IEEE 1159 as the decrease in the rms ac voltage, typically to 80% - 90% of nominal power frequency for a period of time greater than 1 minute. Electrical transient voltages can originate inside a facility or out on the utility’s grid, and can propagate through various levels of electrical and data systems. Sources of destructive transient voltages can range from the obvious source such as a lightning stroke strike during a thunderstorm, to the subtle one such as static discharge from a human finger.
18
2.5 Power disturbances detection review
This review is closed up into two main categories, the classical and the modern technique in power disturbances detection. With this review we can see how the techniques developed to make the process easier and more effective based on what are the parameters for concern.
2.5.1 Classical technique
Every power disturbance is originated from particular causes and also the mitigation technique is based on the type of disturbances. In addition, every disturbance has its own deviation pattern and value particularly voltage or current characteristic. The specific ranges of unaccepted deviation for each type of disturbances are enshrined in IEEE 1159 standard.
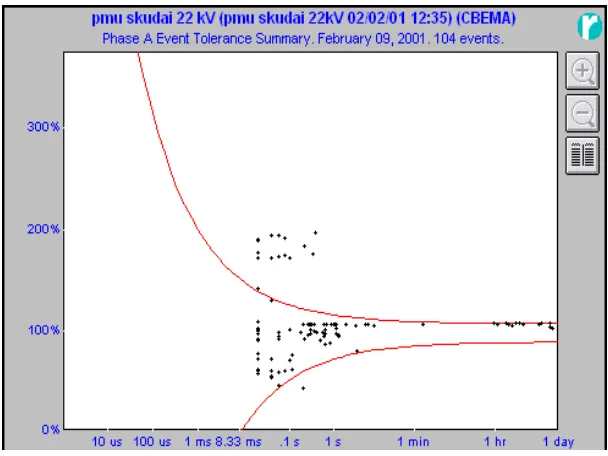
In 1970s, an organization called Computer Business Equipment Manufacturers Association (CBEMA) developed a method as a guideline to the members in designing their power supplies. The method was named as CBEMA Curve and was originally derived to describe the magnitude and duration of voltage variations on the power system. It also becomes the guideline to the organization to determine a reliable system for their electronic equipment. Eventually, it became a standard design for sensitive equipment to be applied on the power system and a common format for reporting power quality variation data. The CBEMA curve was adapted from IEEE Standard 446 (Recommended Practice for Emergency and Standby Power Systems for Industrial and Commercial Applications), whichis typically used in the analysis of power quality monitoring results.
19
[image:30.612.176.480.213.441.2]all the deviation voltage values are plotted outside the curve. Values plotted above the curve indicate malfunctions such as insulation failure, over excitation and over voltage trip. On the other hand, voltages below the envelope are assumed to cause the load to drop out due to lack of energy. For example in Figure 2.5, we can see the some signals plotted inside and some are below the curve.
Figure 2.5: CBEMA curve
20
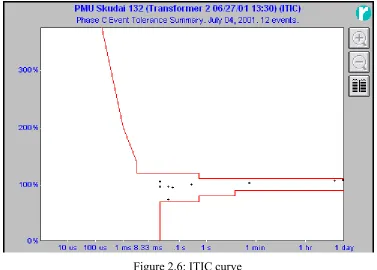
[image:31.612.140.517.256.526.2]However, in 1994, the Information Technology Industry Council, (ITIC) was formed by a working group of the CBEMA. They developed the so called ITIC Curve, which has replaced the CBEMA curve in general usage for single-phase 120 Volt 60 Hz systems. ITIC Curve as shown in Figure 2.6 is a modified version of the CBEMA power acceptability curve, but the concept remains the same. The intent was to derive a curve that can better reflect the performance of typical single-phase, 120 V, 60 Hz computers and their peripherals.
Figure 2.6: ITIC curve
21
complexity. Compared to the old CBEMA curve, the ITIC curve has an expanded acceptable power area. Moreover, the instrumentation to check compliance with the curve appears to be easier to design because of the simplified way the acceptable region is represented.
2.5.2 Modern technique
In this very modern era, computer science technology has been developing rapidly because of its capability in solving problems in many fields of life. This advance technology has made possible to high power signal processing. One of the very important modern techniques is DWT which is widely used in signal processing tools especially to extract the power disturbances signal.
2.5.2.1 Discrete wavelet transform
22
There are several advantages of the wavelet transform. Compared to Fourier series, wavelet series converge uniformly for all continuous functions, while Fourier series do not. They are also adjustable and adaptable. Discrete analysis ensures space-saving coding and is sufficient for exact reconstruction. Many years back, wavelet transform have been developed to solve frequency-dependent problems in many areas. This is because the wavelet transform has many advantages over the traditional Fourier transform. One of the advantages of wavelet transform has over the Fourier transform is its ability to identify the locations containing observed frequency content. It is able to localize the information in the time-frequency plane. Even the Fourier transform can extract pure frequencies from the signal; it cannot indicate the locations of the extracted frequencies.
CHAPTER 3
DISCRETE WAVELET TRANSFORM AND MULTIRESOLUTION ANALYSIS
3.1 Introduction
Before Continuous Wavelet Transform (CWT) and Discrete Wavelet Transform (DWT) were developed, Fourier Transform approach was widely used to overcome signal processing problems. Many mathematical tools were developed under Fourier Transform approach and the most significant is Short Time Fourier transform (STFT). The CWT was developed as an alternative approach to the STFT to overcome the resolution problem. The wavelet analysis is done in a similar way to the STFT analysis. However, there are two main differences between the STFT and the CWT:
1. The Fourier transforms of the windowed signals are not taken, and therefore single peak will be seen corresponding to a sinusoid where negative frequencies are not computed.
24
CWT is used to divide a continuous-time function into wavelets. Unlike Fourier transform, the CWT possesses the ability to construct a time-frequency representation of a signal that offers very good time and frequency localization. Although the discretized continuous wavelet transform enables the computation of the continuous wavelet transform by computers, it is not a true discrete transform. In addition, CWT provides highly redundant information as far as the reconstruction of the signal is concerned. This redundancy, on the other hand, requires a significant amount of computation time and resources.
On the other hand, DWT provides sufficient information both for analysis and synthesis of the original signal, with a significant reduction in the computation time. The DWT is considerably easier to implement when compared to the CWT. Generally, an approximation to DWT is used for data compression if signal is already sampled, and the CWT for signal analysis. Thus, DWT approximation is commonly used in engineering and computer science, and the CWT in scientific research.
3.2 The discrete wavelet transform
In the year of 1976, DWT was found when Croiser, Esteban, and Galand devised a technique to decompose discrete time signals. Crochiere, Weber, and Flanagan did a similar work on coding of speech signals in the same year. They named their analysis scheme as subband coding. In 1983, Burt defined a technique very similar to subband coding and named it pyramidal coding which is also known as multiresolution analysis (MRA).
REFERENCES
1. Ahmad Farid Bin Abidin, (2005), Identification And Classification Of Voltage Disturbances In Power Quality Studies Using Wavelet-Fuzzy Method, Faculty Of Electrical Engineering, Universiti Teknologi Mara, Malaysia
2. Alexander Apostolov, (2003), Detection and Recording of Power Quality Events in Distribution Systems , Fault and Disturbance Analysis Conference, Atlanta,Georgia
3. Anoop Mathew, Gunasekar, D. Bensiker, S.Uma, (2010), Detection and Classification of Voltage Swells Using Wavelet Transforms, International Journal of Computer and Electrical Engineering, Vol. 2, No. 3, pp 1793-8163 4. Author (2000), Power Quality / Utility Voltage Standards, Business Service,
Pinnacle West Capital Corporation
5. Burhan Ergen (2010), Signal and Image Denoising Using Wavelet Transform, Fırat UniversityTurkey
6. Daljeet, Gokhale, Time Domain Signal Analysis Using Modified Haar and Modified Daubechies Wavelet Transform, Signal Processing-An International Journal (SPIJ), Volume (4): Issue (3) 161
77
8. Gonzalez, Moreno, Two applications for Power Quality Analysis using the Matlab Wavelet Toolbox, Department of Electric Electronic and Technology Electronic, University of Cordoba.
9. Haibo, Xiaoping, Janusz (2009), Power Quality Disturbances Analysis Based On EDMRA Method, Electrical Power and Energy Systems 31 pp. 258–268, USA 10. Harish Kashyap, Jayachandra Shenoy, Classification of Power System Faults
Using Wavelet Transforms and Probabilistic Neural Networks, National Institute of Engineering, Mysore, Indian Institute of Science, Bangalore, India.
11. Ian K.P. Ross (2007), Voltage Sags: An Explanation - Causes, Effects and Correction - Part I, Omniverter Incorporation.
12. Joseph Seymour (2005), The Seven Types of Power Problems, American Power Conversion.
13. K.Chandrasekaran, P.AVengkatachalam, Mohd Noh Karsiti , K.S.Rama Rao, (2009), Mitigation Of Power Quality Disturbances, Journal of Theoretical and
Applied Information Technology, Electrical and Electronic Department,
Universiti Teknologi PETRONAS, Malaysia
14. S. EKICI, S. YILDIRIM, (2006), Fault Location Estimation on Transmission Lines Using Wavelet Transform and Artificial Neural Network, Department of Electrical Education, Firat University Elazig, Turkey.
15. Sharmeela, Mohan, Uma, Baskaran (2006), A Novel Detection and Classification Algorithm for Power Quality Disturbances using Wavelets, American Journal of
Applied Sciences 3 (10): pp 2049-2053, College of Engineering, Anna
University, Chennai
16. Singh, Chopra, Kaur (2010), Image Compression Using Wavelet and Wavelet Packet Transformation, International Journal of Computer Science and Technology, Vol. 1, Issue 1
17. Sudipta, Arindam, Abhijit (2009), Detection of Power Quality Disturbances Using wavelet transform, World Academy of Science, Engineering and Technology 49.