GRAPH BASED TEXT REPRESENTATION FOR DOCUMENT
CLUSTERING
1, 2
ASMA KHAZAAL ABDULSAHIB, 1SITI SAKIRA KAMARUDDIN
1Universiti Utara Malaysia, School of Computing, 06010 UUM Sintok, Malaysia
2University of Baghdad, College of Education for Human Science-Ibn Rushd, Baghdad, Iraq.
E-mail: [email protected] , [email protected]
ABSTRACT
Advances in digital technology and the World Wide Web has led to the increase of digital documents that are used for various purposes such as publishing and digital library. This phenomenon raises awareness for the requirement of effective techniques that can help during the search and retrieval of text. One of the most needed tasks is clustering, which categorizes documents automatically into meaningful groups. Clustering is an important task in data mining and machine learning. The accuracy of clustering depends tightly on the selection of the text representation method. Traditional methods of text representation model documents as bags of words using term-frequency index document frequency (TFIDF). This method ignores the relationship and meanings of words in the document. As a result the sparsity and semantic problem that is prevalent in textual document are not resolved. In this study, the problem of sparsity and semantic is reduced by proposing a graph based text representation method, namely dependency graph with the aim of improving the accuracy of document clustering. The dependency graph representation scheme is created through an accumulation of syntactic and semantic analysis. A sample of 20 news groups, dataset was used in this study. The text documents undergo pre-processing and syntactic parsing in order to identify the sentence structure. Then the semantic of words are modeled using dependency graph. The produced dependency graph is then used in the process of cluster analysis. K-means clustering technique was used in this study. The dependency graph based clustering result were compared with the popular text representation method, i.e. TFIDF and Ontology based text representation. The result shows that the dependency graph outperforms both TFIDF and Ontology based text representation. The findings proved that the proposed text representation method leads to more accurate document clustering results.
Keywords: Text Representation Schemes, Dependency Graph, Document Clustering, Sparsity
Problem,Semantic Problem.
1. INTRODUCTION
Document clustering are used in a number of different areas of text mining and information retrieval. At first, document clustering was investigated or improving the precision or recall in information retrieval systems and as an effective way of finding the nearest neighbors of a document. More recently, clustering has been proposed for use in browsing a set of documents or to regulate the results returned by a search engine in response to a user’s query. Document clustering has also been used to automatically generate hierarchical clusters of documents [3]. Document clustering is considered a basic technology in the era of internet. It’s a necessary technique in mining underlying structures in text document data sets. Furthermore, this is a very interesting research topic that has
influenced a number of researchers and
practitioners from a number of fields, including data mining, machine learning, and information
retrieval due to its fundamental role in many of real-world applications [1]. Text clustering means finding the groups that are related to each other. These groups are collected together in an unstructured formal document. In fact, clustering becomes very famous for its ability to offer an exceptional way of digesting in addition to generalize a good quantity of information.
sparsity has attracted increasing attention. Sparsity is one of the core characteristics of real world data. Clustering is one of the techniques, which can be used in order to solve the sparsity problem [4]. The problem faced in clustering data high-dimensional data are sparsity this data. Many researchers have tried to solve this problem where [5] add an additional step to the k-means clustering process to
automatically compute the weights of all
dimensions in each cluster. Experiments have shown the data on both synthetic and real that the new algorithm can generate results clustering better than other algorithms.
Sparsity also depends on the concept of semantics since text documents commonly include different terms to express the same message. So the second problem that is addressed by many researchers is the semantic relations as defined by the researchers as the relationship between concepts or meanings. Some studied undertaken the problem of distinction between two entities of semantic. Where introduced five models and graphical functions of the neural network for classification and semantic relationship as well as the extraction of text from the domain of bioscience [6].
In [7] the authors show the semantic relationship in classification and the semantic relationship between the components of noun compounds and between nominal in general are not easy to categorize rigorously. So the need to find a semantic relationship where the entities in the same document that linked linguistically to each other are modelled. In these cases, the collective entity associated with a link, and that the name mentioned in the same document is joined by exploiting the interdependence between them. The study shows that finding semantic relationship can lead to improvement in the entity linking accuracy [8]. In this study, we propose to solve the sparsity and semantic problem related to text documents using a graph based text representation with the aim of improving the text clustering results. The contributions of this research lies in the method of constructing a graph based text representation which includes extracting noun phrases and chooses the most frequent phrases (top sentences) and convert them into meaningful sentences using the graph based text representation. This research hopes to improve the text clustering performance. A graph based text representation is proposed to solve this problem because previous studies demonstrated that it is able to capture the relation between words and improve the performance of a similarity measure between texts [4].
The main research question in this study relates to how the sparsity problem associated with TF-IDF representation can be reduced. In order to address this question the following sub-questions are formulated first: How to represent text into graph based representation to reduce the sparsity and capture the semantics of text. Second question: Can a graph based text representation method produce good clustering results. So the scope of This research focuses on graph based text representation schemes, using the standard text document clustering methods and a popular variant of 20 Newsgroup dataset. In existing clustering methods, a document is represented as a bag of words "(in BOW model)", "N-grams (in suffix tree document model)", or TF-IDF without considering the relations between the words [4]. Compared with other types of text representation scheme, Graph model is more efficient because it is characterized by its ability to capture the relation between words in text. Graphs are mathematical structures which consist of nodes and edges which link nodes together. This form of representation includes formal analysis of concepts and graphs that relate to concept frames.
The basic idea is to convert documents to the its syntactic structure. Sentence structure at the semantic level can then be represented by dependency graphs. Where each document is represented as a graph with words as nodes and relationship as arc. In case of similarity between documents in different clusters and edge appears between two nodes. If the documents that are contained in the cluster are highly related, the edges in the same cluster will weigh more than the edges across clusters.
Dependency graph can also be defined as a directed graph representing dependencies of several objects towards each other. It is possible to derive an evaluation order or the lack of an evaluation order that respects the given dependencies from the dependency graph. Recent studies proved that this type of text represented has advantages such as the capability to present knowledge more efficiently than other type of text representation methods [9]. In addition, it has the ability to discover causal relationships and improve the performance of a similarity measure between texts [4].
2. RELATED WORK
and email). The graphic representations are selected on the basis of domain knowledge to provide focus on the domains. The drawback in this study is in the accuracy of the results where it tightly depends on the domain.
A system which utilizes the concept of weight for text clustering proposed by [11]. It was developed on k-means algorithm on the principle of ontology. These are used to identify irrelevant or redundant features which may misguide the
strength, thereby achieving more accurate
document clustering. The DG based representation could achieve better clustering results compared to other methods that are based on the BOW model [4]. It can also discover causal relationships and improves the performance of a similarity measure between texts.
The [21] merging the dependency graphs before performing the clustering and applied set operations like union, weighted union, and intersection of the set of edges. They showed that the process of merging was able to improve the overall clustering quality.Different research works have focused on comparing the performance of different clustering algorithms to analyze their advantages and disadvantages and to suggest to users the best technology for a particular situation. In [12] Showed that the partitional clustering algorithms (K-MEANS) are well suitable for clustering large documents because of their low computational demands. Therefore, we will test the dependency graph based represented text on the K-MEANS algorithm to measure the performance of the clustering results.
2.2 TF-IDF
TF-IDF is a commonly utilized method in the field of text mining. The benefit of using this approach is that it allows for the estimation of the significance of a word in a document. Word frequency in a document is basically the number of repeated words in the document. IDF involves a computation of the general significance of a term. Mathematically, the TF-IDF weight of a term is expressed as:
log ⁄ 1
In the equation above, TFi stands for the expression frequency of term i in a document, D is the figure of documents in the body, and DFi stands for the document frequency or number of documents that contain term i. Therefore, log (D/DFi) stands for inverse document frequency. TF-IDF weighting can be derived from the
regularity information matrix. After determining the weight vectors, they are applied to data frequency and presence. TF-IDF is a term-weighing
function utilized broadly for document
representation [1].
One of the key disadvantages of this scheme is that it disregards important semantic links between words and/or word meanings and compares documents based solely on word frequencies. Several of the current approaches that attempt to address this issue either depend on alternate
representation schemes or are based on
probabilistic models [26][25]. A number of studies have attempted to represent text through the use of TF-IDF [29]. Such studies include those conducted by [22], [23],[25],[26],[30]. In [23] recommended an upgrade of TF-IDF weighting in the vector space model for improvement of classification accuracy by introducing a new parameter to represent the in-class characteristic; the new weighting method is called TF-IDF-CF based on TF-IDF. Traditional TF-IDF employs a term weighting scheme that is based on term ontology [28]. The reason for this use is that TF-IDF only pays attention to the repeated words in the document and disregards the other factors that may influence the world weighs.
As [22] proposed an improved TF-IDF algorithm to solve the low accuracy of micro-blog commercial word extraction and application it in term weight calculation. The possibility of applying the improved algorithm involved classifying a large amount of micro blog information into certain patterns and then assigning term weights for the classes under the Hadoop distributed framework by using the improved TF-IDF algorithm. The results indicate that the application of the improved TF IDF algorithm in micro-blog commercial word extraction is enforceable.
2.3 Ontology
Ontology is an explicit specification of a conceptualization in a particular domain. Its importance in knowledge management, knowledge sharing and information retrieval has been realized by researchers, especially in biological and biomedical domains, where new discoveries and knowledge emerge at a fast pace. Much different ontology has been developed in recent years. Whereas each ontology is useful for a particular domain or subdomain, the interoperability between these ontologies has yet to be built up [16].
Can define ontology as a set of domain concepts interest of the organization representing the hierarchical structure. Where [17] defined ontology, as a catalogue of the kinds of things that are supposed to exist in the area. Ontology helps to know what it means for a specific term. Ontologies provide a way to describe the meaning of the terms and relationships so that a common understanding or consensus can be obtained between machines
and people [18]. A number of studies have dealt
with this type of text representation. For instance, In [11], the authors proposed a system that utilizes the concept of weight for text clustering. It was developed with a k-means algorithm based on the principle of ontology. The system is used to identify irrelevant or redundant features that may reduce strength, thereby achieving more accurate document clustering.
While [24] developed a text mining approach based on ontology to collect novel research proposals based on the similarity in the areas of research.The approached proved to be effective and efficient in compiling research proposals with English and Chinese texts. An ontology study was conducted for the classification of the concepts of disciplines in terms of the various regions and forming relations among them.
Another study of [28] where were compared the
performance of strengthening ontological
algorithms based on k-means and DBSCAN clustering. Ontology has been used to introduce the concept of weight, which was calculated by determining the correlation coefficient of the word and the potential of this concept. And conducted various experiments with performance evaluation. The results showed that the inclusion of ontology increased clustering efficiency; where the ontology-based DBSCAN algorithm presented the best performance among the considered k-means algorithms based on ontology.
3. RESEARCH FRAMEWORK
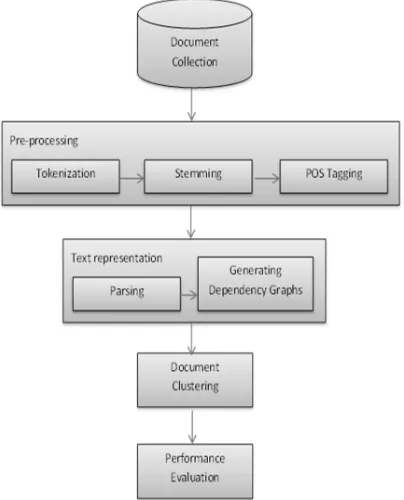
[image:4.595.306.508.247.497.2]The proposed document clustering using graph based method combines the concept semantic weighting and clustering algorithms, i.e., K-Means. The proposed methodology includes five steps, namely, data collection, document preprocessing, text representation, applying text clustering algorithm and finally performance evaluation as shown in Figure 1.
Figure 1: Research Framework.
As shown in Figure 1, There are many steps that must be followed to clean up the text of phrases or words, namely Tokenization, Stemming, and Part of Speech (POS) Tagging. Next the text needs to be represented in graphical forms. To do this need to undergo the process of parsing and dependency graph construction. After building the dependency graph, the weights are given to each node of the dependency graph and it is transformed into the feature vector using the tf-idf measure. Later, clustering algorithm was applied where clustering classifies the documents into several classes based on the features. This is followed with performance evaluation to measure the accuracy of the clustering results.
3.1 Document Collection
by Lang (1995) is a set of approximately 20,000 newsgroup documents. The data are organized into 20 various newsgroups, each conforms to a different topic. Some of the newsgroups are very
closely associated to each other
(comp.sys.ibm.pc.hardware/comp.sys.mac.hardwar
e), and others are not (misc.forsale/
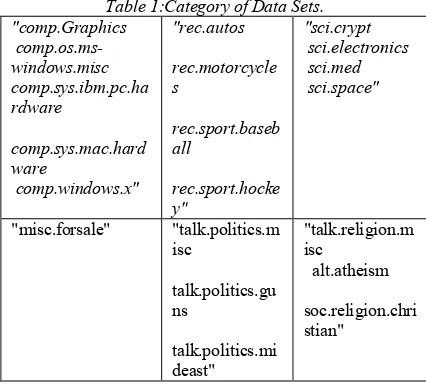
[image:5.595.82.295.241.434.2]soc.religion.christian). Table1 shows the list of the 20 newsgroups, divided depending on subject matter.
Table 1:Category of Data Sets. "comp.Graphics
comp.os.ms-windows.misc comp.sys.ibm.pc.ha rdware
comp.sys.mac.hard ware
comp.windows.x"
"rec.autos
rec.motorcycle s
rec.sport.baseb all
rec.sport.hocke y"
"sci.crypt sci.electronics sci.med sci.space"
"misc.forsale" "talk.politics.m isc
talk.politics.gu ns
talk.politics.mi deast"
"talk.religion.m isc
alt.atheism
soc.religion.chri stian"
3.2 Document Preprocessing
Pre-processing consisting of procedure that transforms the text data in the document to a structure templates for text mining. The main goal of processing is to get basic features or key terms from online news text documents and enhance the relevancy between words and document and the relevancy between words and category. A document almost contains number of not necessary words that could negatively affect the clusters of the document. In this research using programming language python to execute the work. There are four steps that must be followed to clean up the text of phrases or words, namely: Split document into sentences, Stemming, Tokenization and Part of Speech Tagging.
3.2.1 Split documents
The first step in pre-processing splits each
document into sentences using Python
programming language.
3.2.2 Stemming
Stemming is is the process reduction of inflected words to their stem, root or base form or in general, a written word form. Stemming is used in determining domain vocabulary in domain analysis [32]. For example, stemming algorithms should be determined the string "cats" ("possibly "catlike", "catty" etc.) where based on root "cat", "stemmer", "stemming", "stemmed" as depend on "stem". A stemming reduces the words "fishing", "fished", and "fisher" to the root word, "fish". On the other hand, "argue", "argued", "argues", "arguing", "argus" reduce to the stem "argu" (illustrating the case where the stem is not itself a word or root) but "argument","arguments" reduce to the stem "argument" [13]. The Porter stemming algorithm is utilized to stem the words in original 20 newsgroup
documents.
3.2.3 Tokenization
Tokenization is the process of breaking a stream of text into words, phrases, symbols, or other meaningful elements called tokens. The list of tokens becomes the input data for further processing such as parsing or text mining. Tokenization is useful in linguistics, where it is a form of text segmentation, and in computer science, where it forms part of lexical analysis [31].
3.2.4 Part of speech tagging
The Part-of-speech (POS) language part of speech is responsible for the appointment of the layers in the syntax of possible words found in the document (for example, as it is known, unknown, spelling errors). POS are distributed in all parts of the language of a number of passes. Distinguishable
words are grammatically unambiguous early by
using a list of English words (a lexical search), and the layers in the syntax. Tagging of ambiguous words is deferred to passes dealing with clausal patterns to utilize the context and enable accurate POS tagging.
Figure 2: Result Of Tokenization And Stemming.
The next step in the preprocessing phase is the POS tagging. Figure 3 shows the result of the example sentence after POS tagging.
Figure 3: Result of POS Tagging.
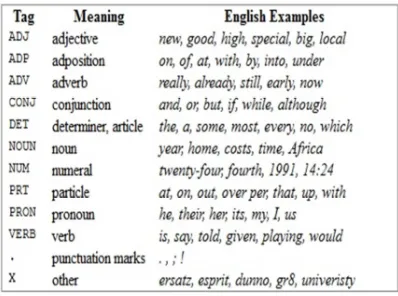
As can be seen in Figure 3 each word in the sentence was assigned a part of speech tag. These tags are taken from the Universal Part-of-Speech Tagset as shown in Figure 4.
Figure 4: Universal Part of Speech Tagset (Source:
http://www.nltk.org).
3.3 Text Representation Schemes
3.3.1 Parsing
Parsing is the process of resolving (a sentence) into its component parts and describe their syntactic roles. The main objective of the syntactic parsing region is to recognize a sentence and designation a grammatical structure to it, namely the parse tree. The sentences are parsed to identify syntactic structure. Furthermore, the parser must be having ability to deal efficiently with the problem of ambiguity, where one sentence or words that may have more than one parse. Parsing algorithms dependent on a grammar which is declarative formalities and it can be calculated in several possible ways.
The segment resolution passes are interspersed with chunking and the syntactic parsing passes, so as to use feedback to assign segments and their boundaries with greater confidence. The main and commonly used parsing algorithms are based on the context free grammar parsing algorithm. In this research, using a Standard English Grammar rule [33] as follows:
S NP VP
NP [DET] [N-MOD].NOUN [PP] VP VERB [NP] [PP]
PP PREP NP
The grammar rule suggests that all sentences (S) should be a combination of Noun Phrase (NP) followed by Verb Phrase (VP). All Verb Phrases are made of verb and followed by an optional Noun Phrase ([NP]) and an optional preposition phrase ([PP]). The noun modifiers can be adjectives to nouns and the preposition can be followed Noun Phrases [27]. Using the parser to get the relations between words from the original text when constructing the dependency graph must parse the text as a first step. Parsing the sentences using the dependency parser which outputs from this process a set of words and the identified pairwise relations between them.
The goal of a parser is to analyze an input sentence and output the corresponding (most preferred) parse tree. From the experiences of previous studies, the Stanford parser is used to obtain word dependencies. Figure 5 shows the parsed sentence for our example sentence.
3.2 Constructing Dependency Graph
In this step, representations of each document as a dependency graph were performed where each node
“I wonder how many atheists out there care to speculate on the face of the world .”
Tokenization
['I', 'wonder', 'how', 'many', 'atheist', 'out', 'there', 'care', 'to', 'speculate', 'on', 'the', 'face', 'of', 'the', 'world'].
Stemming
['I', 'wonder', 'how', 'many', 'atheist', 'out', 'there', 'care', 'to', 'speculate', 'on', 'the', 'face', 'of', 'the', 'world']
['I', 'wonder', 'how', 'many', 'atheist', 'out', 'there', 'care', 'to', 'speculate', 'on', 'the', 'face', 'of', 'the', 'world']
POS Taggin
g
[image:6.595.89.288.540.688.2]corresponds to a word that can be seen as a meta-description of the document. And use the edges between nodes to capture the semantic relations between the pair word. Dependency graph is projective because when all the words written in a linear arrangement. Edges can be drawn without crossing over the words. This is equivalent to saying that word and all the grandchildren (dependents and dependents have dependents, etc.) constitutes a continuum of words in a sentence. After parsing we convert the result of the parser to the dependency graph.
Figure 5: Parsed Sentence.
In the parsing phase, we are concerned with how words and sequences of words combine to form constituents. In the dependency graph construction
phase, we are focussedinstead on how words relate
to other words. Dependency is a binary asymmetric relation that holds between a head and its dependents. The head of a sentence is usually taken to be the tensed verb, and every other word is either dependent on the sentence head, or connects to it through a path of dependencies. Figure 6 illustrates the dependency graph for the example sentence where the arrows point from heads to their dependents.
Figure 6: The Text As Dependency Graph
Output from (DG) is represented as a tree; where this tree explains in details how the sentence connect the words to each other. Figure 7 Shows the sentence as a tree.
3.4 Document Clustering
Clustering classifies the documents into several classes based on the topics. Therefore, each class has one topic. [11] [20] Stressed that one of the main tasks in the text mining is text clustering. The primary aspect of algorithms in clustering contains
[image:7.595.305.509.189.364.2]compactness and isolation of clusters. Nevertheless, this algorithm supposed to gratify these standards based on primary suppositions for example the standards of or input parameter values [14].
Figure 7: Dependency Graph As A Tree.
Our work is to present that the choice of text representation method will affect the clustering results no matter which clustering algorithm is used. In this work we Cluster text represented as a dependency graph using K-MEANS algorithms. In rapid miner many algorithms related to clustering, where including special tools using to work pre-processing for text and completed the process clustering.
3.4.1 K-Means
The k-means algorithm was used to cluster the selected data set represented by TF-IDF and dependency graph. The number of k was set to 20 because the document contains 20 groups. The similarity measure used in this research was cosine similarity. In this study, selecting the raw text of 20 newsgroups, which selecting 200 documents (10 from each group). Tokenization was implemented, and all stop words were deleted after stemming a word to a root word.
Then selected the weighing terms (TF × IDF). A term’s document frequency is the number of documents in which the term occurs in the entire collection, and inverse document frequency is a computation of the general significance of the term. Next, applied the k-means algorithm to cluster the raw text using special tools in a rapid miner. When selecting the algorithm to cluster the text, several characteristics related to this algorithm, such as the number of clusters and measurement of similarity, must also be selected. Cluster analysis works based (S I/PRP (VP (V wonder/VBP)) how/WRB (NP many/JJ
atheist/NN) (PP (P out/IN) (NP there/NN care/NN)) to/TO (VP (V speculate/VB) (PP (P on/IN) (NP the/DT face/NN)) (PP (P of/IN) (NP the/DT world/NN)) ).
on the similarity between data objects, that is, similar objects should be in the same cluster while dissimilar objects should be in different clusters. Text was presented as TF-IDF. Out of the 200 documents, the k-means clustering model obtained 173 clustered correctly and 27 clustered incorrectly. While when represent text as dependency graph. In this model, the documents represented as a
dependency graph are directly clustered without
implementing pre-processing steps because these processes were performed previously before
generating the dependency graph. Next, text
clustering is performed with the k-means algorithms and with cosine similarity as a similarity measure. Out of the 200 documents inputted to the k-means algorithms, 188 sentences were clustered correctly. The remaining 12 sentences were clustered incorrectly.
3.5 Performance Evaluation
The performance of the algorithms was evaluated based on four measures, namely, precision, recall, F measure, and accuracy as shown in Equation 1-4. These measures are derived from the confusion matrix table during the performance analysis. The data set used in the experiments is a collection of 20 Newsgroups datasets.The 20 newsgroups are a popular data set of experiments in text applications of machine learning techniques, such as text clustering and text classification [15].
2
3
2 ∗ ∗ 4
" # " 5
Where:
"TP: is true positive: case was positive and predicted positive
TN: is true negative: case was negative and predicted negative
FP: is false positive: case was negative but predicted positive
FN: is false negative: case was positive but predicted negative"
Precision (Equation 2) is the fraction of true positive to the total of true positive and false positive. Recall (Equation 3) is the fraction of true positive to the total of true positive and false
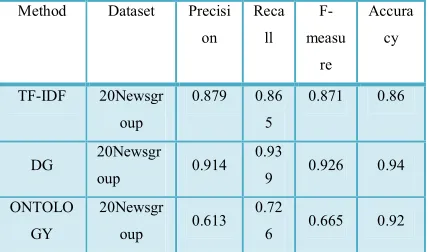
[image:8.595.301.515.316.442.2]negative. F- measure (Equation 4) is a measure that combines precision and recall is the harmonic mean of precision and recall and The accuracy (Equation 5) is the fraction of the clustering that are correct. Accuracy is a commonly used evaluation measure of machine learning classification work. Table 2 shows the result of the evaluation when represents text as dependency graph and represent text as the tf-idf. In this research, the results obtained from representing text as TF-IDF and those obtained when text was represented as a dependency graph compared with current studies using ontologies to cluster text documents.
Table 2: Precision, Recall, F-measure and Accuracy of TFIDF, DG and Ontology representation
4. RESULT DISCUSSION
Overall, the most important measure of
performance is recall, which is a measure of completeness and coverage. A high recall value is produced in specifying the number of sentences that have been clustered correctly. The precision score is a measure of accuracy. The values of recall for the three methods, namely, TF-IDF, DG, and ontology, are 0.865, 0.939, and 0.726 respectively. The highest value is obtained for text representation as a dependency graph. This result indicates that the number of documents clustered correctly when text is represented as a dependency graph is more than the number of documents clustered incorrectly. The F- measure combines the precision and recall scores and provides a clear-cut measurement. Text represented as a dependency graph obtained a higher F measure and accuracy value, which indicates better clustering performance. The results shown in Tables 2 for each method of text represented as TF-IDF, ontology, and DG indicate that the F measure for dependency graph is 0.926; the value for TF-IDF and ontology are 0.871 and 0.665, respectively. Hence, the best result is obtained for dependency graph. Its larger F-
Method Dataset Precisi
on Reca
ll
F-measu
re
Accura
cy
TF-IDF 20Newsgr
oup
0.879 0.86
5
0.871 0.86
DG 20Newsgr
oup 0.914
0.93
9 0.926 0.94
ONTOLO
GY
20Newsgr
oup 0.613
0.72
measure value indicates better clustering results [15]. Lastly, the accuracy for DG is 0.94, whereas those for TF-IDF and ontology (previous study) are 0.865 and 0.665, respectively. These results
indicate that dependency graph is a better
representation method compared with TF-IDF and ontology. Hence, the DG model can be utilized to reduce sparsity and semantic problems, obtain meaningful sentences, and reduce document features.
5. EXAMPLE
This section gives a simple example in order to understand the difference between dependency graph and ontology. To show the process of ontology a small text is selected in Figure 8 where, the total words in this example are 80 words and 26 of them are unknown (have no entry in the lexicon).
Figure 8: The Simple Text in English.
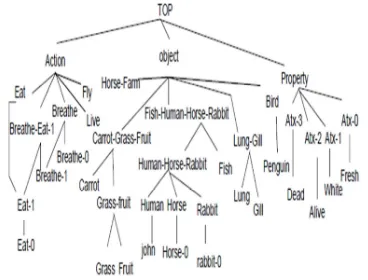
The ontology is limited to the kernel (primitive concepts). Underlined words are unknown and have no meaning in the ontology. Each Relations weight is simply zero for primitives and one for others. After processing the text, placing p-concepts, clustering and reorganization of the ontology, the result is shown in Figure 9 and Table 3.
From the previous example, clearly in the ontology there are some words that are not found in the ontology domain where one of the drawbacks associated with existing ontology systems is a general lack of names in the ontology that correspond to all the information or concepts in a document set. These words are ignored during the construction of the ontology. When the words are represented in ontology as a tree, it can be seen that some words that are not found in ontology domain are ignored. For example killed, Robert, blacky. This will lead to lost in the meaning of some sentences.
In addition the existing ontology systems are unable to map ontology terms to infer linkages to related or referenced entities in wider data sources [19]. However, in the dependency graph no words
are ignored. All the words are constructed and used
in the construction of the dependency
[image:9.595.317.501.226.366.2]graph.Furthermore, there is no need for domain construction in the dependency graph because DG does not depend on domain while in ontology construction of domains is a must and these will lead to extra effort and consumes time. Figure 10 shows the example as dependency graph.
[image:9.595.303.513.418.660.2]Figure 9: The Resulted Hierarchy After Processing the Text.
Table :3 Part of Non-taxonomic Knowledge and Axioms Extracted From the Sample Text.
After constructing a dependency graph is represented as a tree using programming python as follows in Figure 11. The dependency graph is constructed for 200 documents and the percentage of reduction for each document is calculated. The average percentage reduction for all documents used in this research is 20%. Where the minimum
"(P-Agent Human-Horse-Rabbit Breathe-eat-1)
(P-Agent Fish-Human-Horse-Rabbit Breathe)
(P-Agent Fish Breathe-0) (P-Agent Bird Fly)
(Not (P-Agent Penguin Fly)) (P-Agent Human-Horse-Rabbit Eat)
(P-Instrument Lung-Gill Breathe)
(P-Instrument Lung Breathe-1) (P-Instrument Gill Breathe-0) (P-Agent Human-Rabbit Eat-0) (P-Patient Carrot-Grass-Fruit Eat-1)
(P-Patient Grass-Fruit Eat-0) (P-Has-Prop Grass-Fruit Atx-1 Fresh)
(= Horse-0 Blacky) (Is-horse-of Blacky John)
(Has john blacky) (P-Has Human Horse)"
"(Has-Prop Rabbit -0 Atx-0 White) (P-Has-Prop Rabbit Atx-0 White) (Name Rabbit-0 Robby)
(P-Has Rabbit Name) (Has John Horse-Farm)
(P-Loc Farm Eat-Live)
(=> ( and (instance-of ?x Human)
(instance-of ?y Kill) (Patient ?x ?y) ) (Not (Has-prop ?x Atx-2 alive)) )
(=> ( and (instance-of ?x Human)
percentage of reduction is 3% and the maximum of percentage of reduction is 78%.from this result can be seen that the process of constructing dependency graph was able to solve the sparsity problem by reducing the number of features. The line graph shown in Figure 12 shows clearly the percentage of reduction in the document size for all the 200 documents before and after constructing the dependency graph.
Figure 12: The Reduction in Document Size.
Constructing the DG can solve the semantic problem as well through extracting only the meaningful sentences. The dependency graph is also called a directed graph. The nodes represent the lexical items and the arcs represent dependency relations from heads to dependents. In Figure 13 display the heads and dependents in dependency graph.
The arcs are labeled with the grammatical function that holds between a dependent and its
head. For example, I is the SBJ (subject)
of shot (which is the head of the whole sentence),
and in is an NMOD (noun modifier of elephant). In
contrast to phrase structure grammar, therefore, dependency grammars can be used to directly
express grammatical functions as a type of
dependency.
6. CONCLUSION AND FUTURE WORK
In this paper, we propose to solve the sparsity and semantic problem related to the TF-IDF using a
graph based text representation, namely
dependency graph with the aim of improving the text clustering results. We used the standard text document clustering method i.e K-means and a popular variant of 20 Newsgroup dataset. We have presented the detail process of converting the text documents into dependency graph. Our future work is to use the produced dependency graph on standard clustering algorithm such as K-Means and then compare the performance of a dependency graph based representation with other more popular representation such as tf-idf and ontology. We believe that the produced dependency graph will produce better clustering results.
This work, in its different development stages, can be extended in many ways. First, for data representation, only 200 documents were selected. Therefore, in the future, the number of documents can be increased or all the 20 newsgroup datasets can be utilized. Second, other algorithms for clustering processes (aside from the k-means algorithm), can be applied; for example, DBSCAN, particle swarm optimization, and support vector machine, can be utilized. Third, clustering evaluation can be improved by developing the evaluation criteria, namely, precision, recall, F measure, and accuracy. By addressing these areas, the contributions of this research could be improved and refined.
REFRENCES
[1] Aggarwal, C. C., & Zhai, C. (2012). A survey of
text clustering algorithms, Mining text data (pp.
77-128): Springer.
[2] B Dhillon, I. S., & Modha, D. S. (2001). Concept decompositions for large sparse text data using clustering. Machine learning, 42(1-2), 143-175.
[3] Jing, L., Ng, M. K., Xu, J., & Huang, J. Z. (2005). Subspace clustering of text documents with feature weighting k-means algorithm
Advances in Knowledge Discovery and Data Mining (pp. 802-812): Springer.
[4] Wang, Y., Ni, X., Sun, J.-T., Tong, Y., & Chen,
Z. (2011). Representing document as
dependency graph for document clustering. Proceedings of the 20th ACM international conference on Information and knowledge
management.
[5] Jing, L., Ng, M. K., & Huang, J. Z. (2007). An entropy weighting k-means algorithm for subspace clustering of high-dimensional sparse
data., IEEE Transactions on Knowledge and
[6] Rosario, B., & Hearst, M. A. (2004). Classifying semantic relations in bioscience
texts. Proceedings of the 42nd Annual Meeting
on Association for Computational Linguistics.
[7] Dietrich, J., Yakovlev, V., McCartin, C., Jenson, G., & Duchrow, M. (2008). Cluster
analysis of Java dependency graphs.
Proceedings of the 4th ACM symposium on Software visualization.
[8] Han, X., Sun, L., & Zhao, J. (2011). Collective entity linking in web text: A graph-based method. Paper presented at the Proceedings of the 34th international ACM SIGIR conference on Research and development in Information Retrieval.
[9] Qu, Q., Qiu, J., Sun, C., & Wang, Y. (2008). Graph-based knowledge representation model
and pattern retrieval. Fifth International
Conference on.Fuzzy Systems and Knowledge Discovery, 2008. FSKD'08.
[10] Chakravarthy, S., Venkatachalam, A., & Telang, A. (2010).A graph-based approach for multi-folder email classification. IEEE 10th International Conference on Data Mining
(ICDM).
[11] Tar, H. H., & Nyunt, T. T. S. (2011).
Ontology-Based Concept Weighting for Text Documents.
International Conference on Information Communication and Management IPCSIT.
[12] Saad, F. H., de la Iglesia, B., & Bell, D. G. (2006). A Comparison of Two Document Clustering Approaches for Clustering Medical
Documents. DMIN.
[13] Dolamic, L., & Savoy, J. (2008). Stemming approaches for East European languages
Advances in Multilingual and Multimodal Information Retrieval (pp. 37-44): Springer.
[14] Halkidi, M., & Vazirgiannis, M. (2008). A density-based cluster validity approach using
multi-representatives. Pattern Recognition
Letters, 29(6), 773-786.
[15] Slonim, N., & Tishby, N. (2000). Document clustering using word clusters via the information bottleneck method. Proceedings of the 23rd annual international ACM SIGIR conference on Research and development in information retrieval.
[16] Tong, T. (2011). Semantic frameworks for document and ontology clustering. University
of Missouri--Kansas City.
[17] Sowa, J. F. (2000). Ontology, metadata, and
semiotic Conceptual structures: Logical,
linguistic, and computational issues (pp. 55-81): Springer.
[18] Guarino, N. (1998). Formal ontology in information systems: Proceedings of the first international conference (FOIS'98), June 6-8,
Trento, Italy (Vol. 46): IOS press.
[19] Gardner, S. (2007). Ontology-based
information management system and method:
Google Patents.
[20] Huang, J. Z., & Ng, M. (2006). Text clustering:algorithms, semantics and systems. history, 8, 3.
[21] Beck, F., & Diehl, S. (2013). On the impact of software evolution on software clustering. Empirical Software Engineering, 18(5), 970-1004.
[22] Huang, X., & Wu, Q. (2013). Micro-blog commercial word extraction based on improved TF-IDF algorithm. Paper presented at the
TENCON 2013-2013 IEEE Region 10
Conference (31194).
[23] Liu, M., & Yang, J. (2012). An improvement of TFIDF weighting in text categorization. International Proceedings of Computer Science & Information Technology, 47.
[24] Ma, J., Xu, W., Sun, Y.-h., Turban, E., Wang, S., & Liu, O. (2012). An ontology- based text-mining method to cluster proposals for research
project selection.Systems, Man and
Cybernetics, Part A: Systems and Humans,
IEEE Transactions on, 42(3), 784-790..
[25] Pandit, S. (2008). On a robust document classification approach using TF-ID scheme
with learned, context-sensitive semantics.
[26] Ramos, J. (2003). Using tf-idf to determine word relevance in document queries. Paper presented at the Proceedings of the First
Instructional Conference on Machine Learning.
[27] Siti S.K.(2011).Frame work for deviation detection text:Thesis,Universiti Kebangsaan
Malaysia,Bangi.
[28] Punitha, v. s. s. c. (2012). Approaches to Ontology Based Algorithms for Clustering Text Documents.Int.J.ComputerTechnology&Applic ations, 3 (5), 1813-1817.
[29] Liu, F., Pennell, D., Liu, F., & Liu, Y. (2009). Unsupervised approaches for automatic keyword extraction using meeting transcripts. Paper presented at the Proceedings of human language technologies: The 2009 annual conference of the North American chapter of
[30] Jia, Y.-T., Hu, S.-M., & Martin, R. R. (2005). Video completion using tracking and fragment merging. The Visual Computer, 21(8-10), 601-610.
[31] Fares, M., Oepen, S., & Zhang, Y. (2013). Machine learning for high-quality tokenization replicating variable tokenization schemes
Computational linguistics and intelligent text
processing (pp. 231-244): Springer.
[32] Dolamic, L., & Savoy, J. (2008). Stemming approaches for East European languages Advance in Multilingual and Multimodal
Information Retrieval (pp. 37-44): Springer.
[33] Salton, G., & McGill, M. J. (1983).
Introduction to modern information retrieval.
Figure 10: The Example as Dependency Graphs.